India Biogas Market by Source Type (Agricultural, Industrial, Municipal) Market by Application (Electricity Generation, Biofuel Production, Heat Generation) Market by End-User (Power Utilities, Industrial, Commercial, Residential, Other End-Users) Market by Technology (Fixed Dome, Floating Drum, Balloon, Other Plant Concepts, Wet Vs Dry Digestion, Single Vs Multi-Stage), by Geography
INDIA BIOGAS MARKET OVERVIEW
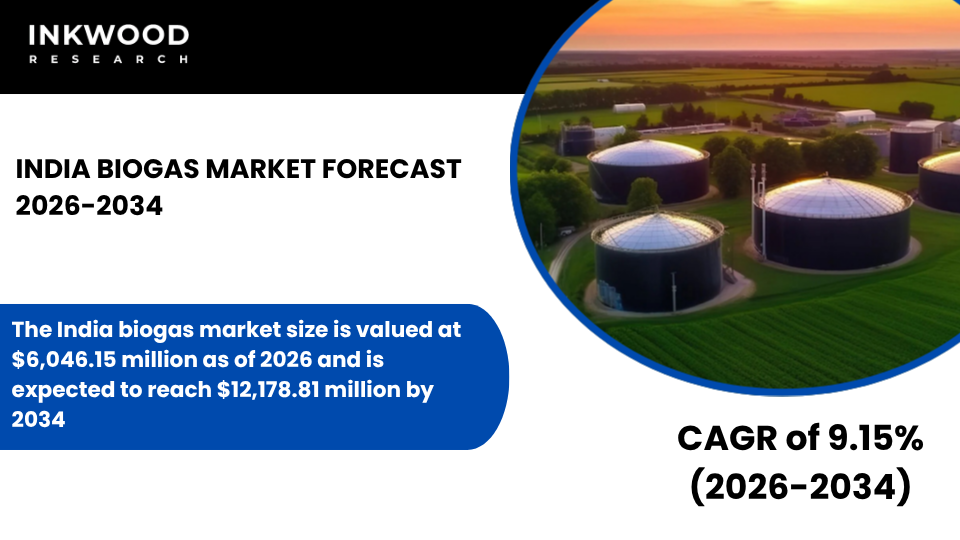
The India biogas market size is valued at $6,046.15 million as of 2026 and is expected to reach $12,178.81 million by 2034, progressing with a CAGR of 9.15% during the forecast years, 2026-2034.
India’s biogas sector demonstrates remarkable growth potential driven by abundant agricultural resources and supportive government initiatives. The country operates over 5.1 million biogas installations, predominantly small-scale household and community digesters designed for rural cooking fuel applications.
According to the Ministry of New and Renewable Energy, India’s livestock population of 535.78 million, including approximately 302 million bovines, provides substantial feedstock availability for biogas generation. Meanwhile, compressed biogas production capacity expanded dramatically from a single project in 2014 to 150 facilities with a cumulative capacity of 1,211 tonnes per day as of March 2025.
Recent government data indicates that 94 compressed biogas plants generated sales exceeding 31,400 tonnes during fiscal year 2024-25, reflecting robust market adoption and commercial viability. Furthermore, policy frameworks play a central role in shaping market development through the National Bioenergy Programme and the Sustainable Alternative Towards Affordable Transportation initiative.
The Ministry of New and Renewable Energy provides financial assistance covering 15-20% of project capital costs, alongside marketing support of Rs 1.50 per kilogram to promote organic fertilizer offtake. Furthermore, the government mandated compressed biogas blending obligations starting April 2025, requiring 1% CBG blending with conventional natural gas for transportation and domestic applications.
To Know More About This Report, Request a Free Sample Copy
This regulatory push addresses India’s energy security concerns, as the nation imports substantial fossil fuel volumes to meet growing consumption demands. Additionally, biogas development supports rural employment generation and agricultural waste management objectives, aligning with broader circular economy principles.
Market evolution reflects a strategic transition from household biogas systems toward commercial-scale compressed biogas projects that serve industrial and transportation sectors. Private sector participation accelerates through joint ventures between public oil companies and specialized biogas engineering firms, bringing technical expertise and investment capital to expand production infrastructure.
The Indian Biogas Association projects the industry size could reach $3-4 billion by 2026, potentially hitting $5 billion by 2030 as compressed biogas plants achieve operational maturity. However, operational challenges persist around feedstock logistics, technology standardization, and after-sales support availability.
Moreover, financing access constraints limit large-scale deployment, particularly for medium-sized enterprises lacking established credit relationships with financial institutions supporting renewable energy projects. As a result, these factors are set to collectively influence the India biogas market growth during the forecasted period.
The India biogas market is segmented into source type, application, end-user, and technology. The application segment is further categorized into electricity generation, biofuel production, and heat generation.
Biofuel production emerges as a strategic application segment, converting raw biogas into compressed biogas that substitutes conventional natural gas in transportation and industrial applications. Biogas upgrading removes carbon dioxide and impurities, creating biomethane with energy density comparable to fossil-based fuels, suitable for vehicle fueling stations and industrial thermal processes.
This application addresses India’s substantial transportation fuel imports while creating domestic renewable energy supply chains rooted in agricultural communities. The segment benefits from government mandates requiring compressed biogas blending into city gas distribution networks, creating guaranteed offtake markets for producers.
Furthermore, major oil marketing companies establish compressed biogas procurement targets under the SATAT initiative, targeting 5,000 plant installations nationwide by 2030. Biofuel production generates additional revenue streams through organic fertilizer sales, as digestate from anaerobic digestion provides nutrient-rich agricultural inputs that reduce chemical fertilizer dependence.
Consequently, the application supports multiple policy objectives, including energy security, agricultural waste management, rural income enhancement, and greenhouse gas emission reduction through methane capture from organic waste decomposition.
Some of the top players operating in the India biogas market include GPS Renewables, Praj Industries Limited, etc.
GPS Renewables operates as India’s key biogas engineering company, delivering comprehensive technology and project solutions across the biofuels value chain. The company specializes in compressed biogas, second-generation ethanol, sustainable aviation fuel, and green hydrogen through its proprietary technologies and engineering capabilities.
The firm has successfully deployed over 100 biogas installations globally, including Asia’s largest compressed biogas plant in Indore, Madhya Pradesh, which processes 550 tonnes of organic waste daily to produce 17 tonnes of compressed biogas. GPS Renewables operates through its ARYA climate infrastructure platform that incubates and develops industrial-scale decarbonization projects.
The company secured substantial financing, including INR 411.50 crore through debt from leading banks and USD 20 million in equity funding from impact investment firms. Strategic partnerships with state-owned oil companies, including Indian Oil Corporation, Bharat Petroleum Corporation, and OIL India, enable nationwide compressed biogas plant deployment through joint venture structures that combine GPS Renewables’ technical expertise with established energy distribution networks.
REPORT SYNOPSIS
| REPORT SCOPE | DETAILS |
|---|---|
| Market Forecast Years | 2026-2034 |
| Base Year | 2025 |
| Market Historical Years | 2022-2024 |
| Forecast Units | Revenue ($ Million) |
| Segments Analyzed | Source Type, Application, End-User, and Technology |
| Country Analyzed | India |
| Companies Analyzed | DMT International, ENGIE SA, Wärtsilä, GPS Renewables, Praj Industries Limited |
TABLE OF CONTENTS
RESEARCH SCOPE & METHODOLOGY
- STUDY OBJECTIVES
- METHODOLOGY
- ASSUMPTIONS & LIMITATIONS
EXECUTIVE SUMMARY
- MARKET SIZE & FORECAST
- MARKET OVERVIEW
- SCOPE OF STUDY
- CRISIS SCENARIO ANALYSIS
- MAJOR MARKET FINDINGS
- INDIA HAS SIGNIFICANT UNTAPPED BIOGAS POTENTIAL DUE TO ABUNDANT AGRICULTURAL AND ORGANIC WASTE
- SMALL SCALE AND COMMUNITY-LEVEL PLANTS DOMINATE CURRENT INSTALLATIONS
- COMMERCIAL AND INDUSTRIAL BIOGAS PROJECTS ARE GRADUALLY GAINING MOMENTUM
- GOVERNMENT INITIATIVES ARE CENTRAL TO MARKET DEVELOPMENT AND ADOPTION
MARKET DYNAMICS
- KEY DRIVERS
- STRONG POLICY SUPPORT UNDER NATIONAL BIO ENERGY AND WASTE MANAGEMENT PROGRAMS DRIVES MARKET GROWTH
- RISING ENERGY DEMAND IN RURAL AND SEMI-URBAN AREAS SUPPORTS DECENTRALIZED BIOGAS SYSTEMS
- INCREASING FOCUS ON CLEAN COOKING AND SANITATION BOOSTS HOUSEHOLD AND COMMUNITY PLANTS
- INDUSTRIAL DEMAND FOR COST EFFECTIVE THERMAL ENERGY SUPPORTS COMMERCIAL BIOGAS USE
- KEY RESTRAINTS
- LIMITED ACCESS TO PROJECT FINANCING CONSTRAINS LARGE-SCALE DEPLOYMENT
- OPERATIONAL CHALLENGES AND FEEDSTOCK LOGISTICS AFFECT PLANT PERFORMANCE
- LACK OF STANDARDIZED TECHNOLOGY AND AFTER-SALES SUPPORT REDUCES RELIABILITY
- LOW AWARENESS AND SKILL GAPS HINDER LONG-TERM PLANT SUSTAINABILITY
- KEY DRIVERS
KEY ANALYTICS
- KEY MARKET TRENDS
- SHIFT FROM HOUSEHOLD BIOGAS TOWARD COMPRESSED BIOGAS PROJECTS IS EMERGING
- PRIVATE SECTOR PARTICIPATION IS INCREASING IN INDUSTRIAL AND MUNICIPAL PROJECTS
- INTEGRATION OF BIOGAS WITH ORGANIC MANURE AND FERTILIZER MARKETS IS EXPANDING
- DIGITAL MONITORING AND MODULAR PLANT DESIGNS ARE GAINING ADOPTION
- PORTER’S FIVE FORCES ANALYSIS
- BUYERS POWER
- SUPPLIERS POWER
- SUBSTITUTION
- NEW ENTRANTS
- INDUSTRY RIVALRY
- GROWTH PROSPECT MAPPING
- GROWTH PROSPECT MAPPING FOR INDIA
- MARKET MATURITY ANALYSIS
- MARKET CONCENTRATION ANALYSIS
- VALUE CHAIN ANALYSIS
- FEEDSTOCK COLLECTION
- WASTE PRETREATMENT
- ANAEROBIC DIGESTION
- BIOGAS UPGRADING
- POWER GENERATION
- DISTRIBUTION SALES
- KEY BUYING CRITERIA
- FEEDSTOCK AVAILABILITY
- CAPEX PAYBACK
- TECHNOLOGY RELIABILITY
- POLICY INCENTIVES
- REGULATORY FRAMEWORK
- KEY MARKET TRENDS
BIOGAS MARKET BY SOURCE TYPE
- AGRICULTURAL
- MARKET FORECAST FIGURE
- SEGMENT ANALYSIS
- INDUSTRIAL
- MARKET FORECAST FIGURE
- SEGMENT ANALYSIS
- MUNICIPAL
- MARKET FORECAST FIGURE
- SEGMENT ANALYSIS
- AGRICULTURAL
BIOGAS MARKET BY APPLICATION
- ELECTRICITY GENERATION
- MARKET FORECAST FIGURE
- SEGMENT ANALYSIS
- BIOFUEL PRODUCTION
- MARKET FORECAST FIGURE
- SEGMENT ANALYSIS
- HEAT GENERATION
- MARKET FORECAST FIGURE
- SEGMENT ANALYSIS
- ELECTRICITY GENERATION
BIOGAS MARKET BY END-USER
- POWER UTILITIES
- MARKET FORECAST FIGURE
- SEGMENT ANALYSIS
- INDUSTRIAL
- MARKET FORECAST FIGURE
- SEGMENT ANALYSIS
- COMMERCIAL
- MARKET FORECAST FIGURE
- SEGMENT ANALYSIS
- RESIDENTIAL
- MARKET FORECAST FIGURE
- SEGMENT ANALYSIS
- OTHER END-USERS
- MARKET FORECAST FIGURE
- SEGMENT ANALYSIS
- POWER UTILITIES
BIOGAS MARKET BY TECHNOLOGY
- FIXED DOME
- MARKET FORECAST FIGURE
- SEGMENT ANALYSIS
- FLOATING DRUM
- MARKET FORECAST FIGURE
- SEGMENT ANALYSIS
- BALLOON
- MARKET FORECAST FIGURE
- SEGMENT ANALYSIS
- OTHER PLANT CONCEPTS
- MARKET FORECAST FIGURE
- SEGMENT ANALYSIS
- WET VS DRY DIGESTION
- MARKET FORECAST FIGURE
- SEGMENT ANALYSIS
- SINGLE VS MULTI‑STAGE
- MARKET FORECAST FIGURE
- SEGMENT ANALYSIS
- FIXED DOME
COMPETITIVE LANDSCAPE
- KEY STRATEGIC DEVELOPMENTS
- MERGERS & ACQUISITIONS
- PRODUCT LAUNCHES & DEVELOPMENTS
- PARTNERSHIPS & AGREEMENTS
- BUSINESS EXPANSIONS & DIVESTITURES
- COMPANY PROFILES
- DMT INTERNATIONAL
- COMPANY OVERVIEW
- PRODUCT LIST
- STRENGTHS & CHALLENGES
- ENGIE SA
- COMPANY OVERVIEW
- PRODUCT LIST
- STRENGTHS & CHALLENGES
- WÄRTSILÄ
- COMPANY OVERVIEW
- PRODUCT LIST
- STRENGTHS & CHALLENGES
- GPS RENEWABLES
- COMPANY OVERVIEW
- PRODUCT LIST
- STRENGTHS & CHALLENGES
- PRAJ INDUSTRIES LIMITED
- COMPANY OVERVIEW
- PRODUCT LIST
- STRENGTHS & CHALLENGES
- DMT INTERNATIONAL
- KEY STRATEGIC DEVELOPMENTS
LIST OF TABLES
TABLE 1: MARKET SNAPSHOT – BIOGAS
TABLE 2: BIOGAS MARKET REGULATORY FRAMEWORK
TABLE 3: MARKET BY SOURCE TYPE, HISTORICAL YEARS, 2022-2024 (IN $ MILLION)
TABLE 4: MARKET BY SOURCE TYPE, FORECAST YEARS, 2026-2034 (IN $ MILLION)
TABLE 5: MARKET BY APPLICATION, HISTORICAL YEARS, 2022-2024 (IN $ MILLION)
TABLE 6: MARKET BY APPLICATION, FORECAST YEARS, 2026-2034 (IN $ MILLION)
TABLE 7: MARKET BY END-USER, HISTORICAL YEARS, 2022-2024 (IN $ MILLION)
TABLE 8: MARKET BY END-USER, FORECAST YEARS, 2026-2034 (IN $ MILLION)
TABLE 9: MARKET BY TECHNOLOGY, HISTORICAL YEARS, 2022-2024 (IN $ MILLION)
TABLE 10: MARKET BY TECHNOLOGY, FORECAST YEARS, 2026-2034 (IN $ MILLION)
TABLE 11: KEY PLAYERS OPERATING IN THE INDIAN MARKET
TABLE 12: LIST OF MERGERS & ACQUISITIONS
TABLE 13: LIST OF PRODUCT LAUNCHES & DEVELOPMENTS
TABLE 14: LIST OF PARTNERSHIPS & AGREEMENTS
TABLE 15: LIST OF BUSINESS EXPANSIONS & DIVESTITURES
LIST OF FIGURES
FIGURE 1: KEY MARKET TRENDS
FIGURE 2: PORTER’S FIVE FORCES ANALYSIS
FIGURE 3: GROWTH PROSPECT MAPPING FOR INDIA
FIGURE 4: MARKET MATURITY ANALYSIS
FIGURE 5: MARKET CONCENTRATION ANALYSIS
FIGURE 6: VALUE CHAIN ANALYSIS
FIGURE 7: KEY BUYING CRITERIA
FIGURE 8: SEGMENT GROWTH POTENTIAL, BY SOURCE TYPE, IN 2025
FIGURE 9: AGRICULTURAL MARKET SIZE, 2026-2034 (IN $ MILLION)
FIGURE 10: INDUSTRIAL MARKET SIZE, 2026-2034 (IN $ MILLION)
FIGURE 11: MUNICIPAL MARKET SIZE, 2026-2034 (IN $ MILLION)
FIGURE 12: SEGMENT GROWTH POTENTIAL, BY APPLICATION, IN 2025
FIGURE 13: ELECTRICITY GENERATION MARKET SIZE, 2026-2034 (IN $ MILLION)
FIGURE 14: BIOFUEL PRODUCTION MARKET SIZE, 2026-2034 (IN $ MILLION)
FIGURE 15: HEAT GENERATION MARKET SIZE, 2026-2034 (IN $ MILLION)
FIGURE 16: SEGMENT GROWTH POTENTIAL, BY END-USER, IN 2025
FIGURE 17: POWER UTILITIES MARKET SIZE, 2026-2034 (IN $ MILLION)
FIGURE 18: INDUSTRIAL MARKET SIZE, 2026-2034 (IN $ MILLION)
FIGURE 19: COMMERCIAL MARKET SIZE, 2026-2034 (IN $ MILLION)
FIGURE 20: RESIDENTIAL MARKET SIZE, 2026-2034 (IN $ MILLION)
FIGURE 21: OTHER END-USERS MARKET SIZE, 2026-2034 (IN $ MILLION)
FIGURE 22: SEGMENT GROWTH POTENTIAL, BY TECHNOLOGY, IN 2025
FIGURE 23: FIXED DOME MARKET SIZE, 2026-2034 (IN $ MILLION)
FIGURE 24: FLOATING DRUM MARKET SIZE, 2026-2034 (IN $ MILLION)
FIGURE 25: BALLOON MARKET SIZE, 2026-2034 (IN $ MILLION)
FIGURE 26: OTHER PLANT CONCEPTS MARKET SIZE, 2026-2034 (IN $ MILLION)
FIGURE 27: WET VS DRY DIGESTION MARKET SIZE, 2026-2034 (IN $ MILLION)
FIGURE 28: SINGLE VS MULTI-STAGE MARKET SIZE, 2026-2034 (IN $ MILLION)
FAQ’s
RELATED REPORTS
-

UNITED STATES AI-DRIVEN CLOUD MIGRATION SERVICES MARKET FORECAST 2026-2034
-

UNITED KINGDOM AI-DRIVEN CLOUD MIGRATION SERVICES MARKET FORECAST 2026-2034
-

UNITED ARAB EMIRATES AI-DRIVEN CLOUD MIGRATION SERVICES MARKET FORECAST 2026-2034
-

SOUTH KOREA AI-DRIVEN CLOUD MIGRATION SERVICES MARKET FORECAST 2026-2034
-

SINGAPORE AI-DRIVEN CLOUD MIGRATION SERVICES MARKET FORECAST 2026-2034
-

SAUDI ARABIA AI-DRIVEN CLOUD MIGRATION SERVICES MARKET FORECAST 2026-2034
-

AUSTRALIA AI-DRIVEN CLOUD MIGRATION SERVICES MARKET FORECAST 2026-2034
-

JAPAN AI-DRIVEN CLOUD MIGRATION SERVICES MARKET FORECAST 2026-2034
-

INDIA AI-DRIVEN CLOUD MIGRATION SERVICES MARKET FORECAST 2026-2034
-

CHINA AI-DRIVEN CLOUD MIGRATION SERVICES MARKET FORECAST 2026-2034