United States Wind Energy Market by Location / Installation Type (Onshore Wind, Offshore Wind (Fixed), Offshore Wind (Floating)), Market by Application (Utility-Scale Power Generation, Commercial & Industrial (C&I), Residential / Small Wind Turbines), Market by Turbine Capacity (Up to 1 MW, 1–3 MW, 3–10 MW, Above 10 MW), Market by End-User (Power Utilities, Independent Power Producers (IPP), Commercial Enterprises, Agricultural Users, Remote / Off-Grid Power Users), Market by Technology (Grid-Connected Systems, Off-Grid Systems), by Geography
UNITED STATES WIND ENERGY MARKET OVERVIEW
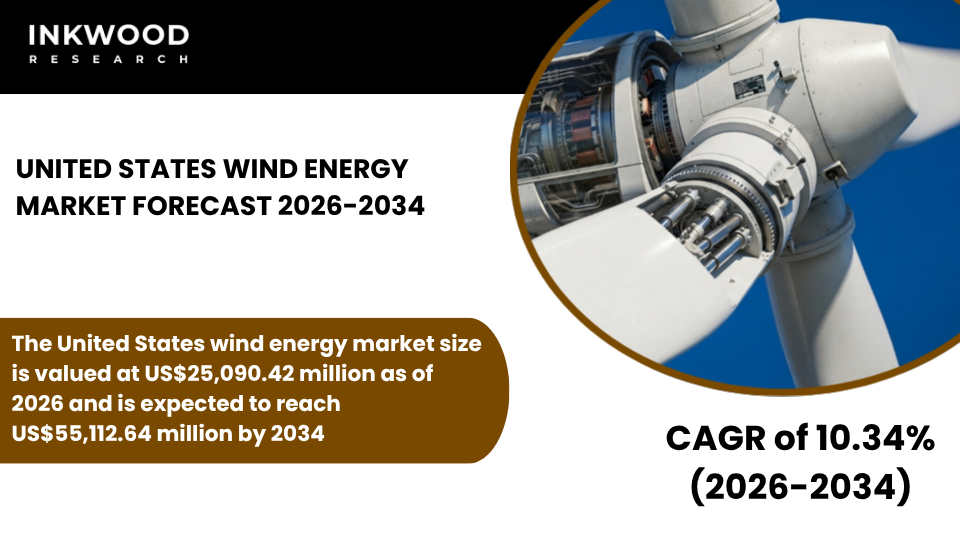
The United States wind energy market size is valued at US$25,090.42 million as of 2026 and is expected to reach US$55,112.64 million by 2034, progressing with a CAGR of 10.34% during the forecast years, 2026-2034.
The United States wind energy market represents one of the most mature and dynamic renewable energy landscapes globally, characterized by substantial installed capacity concentrated primarily in the Midwest, Great Plains, and Texas regions, where abundant wind resources and favorable policies have driven decades of sustained development.
Federal tax incentives, particularly the Production Tax Credit and Investment Tax Credit, continue to play a crucial role in supporting wind power investments by improving project economics and attracting capital from institutional investors, pension funds, and financial institutions.
Moreover, state-level renewable portfolio standards across numerous jurisdictions create binding mandates for utilities to procure specified percentages of their electricity from renewable energy sources, thereby generating consistent demand for new wind farms and capacity expansions. This regulatory framework has established a stable investment environment that encourages long-term planning and commitment from developers, turbine manufacturers, and electric corporations.
Additionally, corporate decarbonization goals have emerged as a powerful market driver, with major technology companies, retailers, manufacturers, and financial services firms entering into multi-year power purchase agreements to secure wind energy supplies while meeting their sustainability commitments and reducing carbon emissions from operations. These corporate PPAs provide revenue certainty for independent power producers and enable project financing without relying solely on utility off-take contracts or merchant market exposure.
The United States wind energy sector benefits from continuous technological advancements that enhance turbine efficiency, increase capacity factors, and expand the geographic range of economically viable wind power generation sites. Modern wind turbines feature larger rotor diameters, taller hub heights, and sophisticated control systems that enable them to capture more energy from available wind resources, even in areas with moderate wind speeds that were previously considered marginal for development.
Furthermore, the repowering of aging wind farms represents a significant growth opportunity, as operators replace older, smaller turbines with newer, higher-capacity models that can generate substantially more electricity from the same land footprint while benefiting from existing transmission infrastructure and interconnection agreements. This repowering trend is particularly pronounced in states like California, Iowa, and Texas, where first-generation wind installations have reached or exceeded their expected operational lifespans.
To Know More About This Report, Request a Free Sample Copy
In addition, the nascent offshore wind sector is poised for rapid expansion, particularly along the East Coast, where federal lease auctions, state procurement programs, and proximity to major electricity demand centers create favorable conditions for large-scale offshore wind projects. States including New York, Massachusetts, New Jersey, Connecticut, and Maryland have established ambitious offshore wind targets and conducted competitive solicitations that have attracted billions of dollars in committed investment from both domestic and international developers.
However, offshore wind development faces regulatory complexities, supply chain constraints, and cost escalation challenges that have led to project delays and contract renegotiations in some instances. Despite these near-term headwinds, the long-term outlook for offshore wind remains positive, supported by improving economies of scale, local content requirements that are building domestic manufacturing capabilities, and ongoing federal permitting reforms designed to streamline approval processes.
Meanwhile, onshore wind continues to account for the majority of new renewable energy capacity additions, benefiting from well-established supply chains, proven technologies, and competitive levelized costs of electricity that often rival or undercut fossil fuel generation. These factors, collectively, are set to drive the wind energy market expansion in the United States during the forecast period.
The United States wind energy market is segmented into location/installation type, application, turbine capacity, end-user, and technology. The technology segment is further categorized into grid-connected systems and off-grid systems.
Grid-connected systems play a pivotal role in the United States wind energy market, representing the overwhelming majority of installed capacity and planned projects across both onshore and offshore locations. Unlike off-grid installations that serve isolated communities or specific facilities without access to transmission infrastructure, grid-connected wind farms are designed to deliver electricity directly into regional transmission networks operated by independent system operators and regional transmission organizations.
These systems enable wind power generation to reach broad customer bases spanning residential, commercial, and industrial consumers across multiple states and electricity markets. Moreover, grid-connected wind projects benefit from well-developed interconnection procedures, standardized power purchase agreement frameworks, and liquid wholesale electricity markets that facilitate the sale of renewable energy and associated environmental attributes.
The segment’s growth is further supported by ongoing investments in transmission infrastructure, including high-voltage direct current lines and grid modernization initiatives that improve the ability to transport wind-generated electricity from resource-rich areas to distant demand centers. In addition, grid-connected systems are essential for achieving state renewable portfolio standards and corporate renewable energy procurement goals, as these policies and commitments typically require electricity to be delivered through the grid rather than consumed directly on-site.
Furthermore, the integration of energy storage systems with grid-connected wind farms is becoming increasingly common, as battery installations enable developers to capture excess generation during high-wind periods and dispatch it during peak demand hours when electricity prices are higher. This hybrid approach enhances revenue potential and provides valuable grid services such as frequency regulation and capacity reserves.
Consequently, grid-connected systems are expected to maintain their dominant position throughout the forecast period, driven by continued policy support, corporate demand, technological improvements in wind turbines and transmission infrastructure, and the scalability advantages inherent in connecting renewable energy projects to established electricity networks.
Some of the top players operating in the United States wind energy market include NextEra Energy Resources, Invenergy, GE Vernova, and Vestas Wind Systems, etc.
NextEra Energy Resources is a leading American renewable energy company and a subsidiary of NextEra Energy, Inc., headquartered in Juno Beach, Florida, specializing in the development, construction, and operation of wind, solar, and battery storage projects across North America. The company operates one of the largest wind power portfolios in the United States, with operational facilities spanning Texas, Oklahoma, Kansas, Iowa, and numerous other states.
REPORT SYNOPSIS
| REPORT SCOPE | DETAILS |
|---|---|
| Market Forecast Years | 2026-2034 |
| Base Year | 2025 |
| Market Historical Years | 2022-2024 |
| Forecast Units | Revenue ($ Million) |
| Segments Analyzed | Location / Installation Type, Application, Turbine Capacity, End-User, and Technology |
| Country Analyzed | Canada |
| Companies Analyzed | Pattern Energy Group LP, Brookfield Renewable Partners, Innergex Renewable Energy Inc, TransAlta Corporation, EDF Renewables, Boralex Inc, Northland Power Inc |
TABLE OF CONTENTS
RESEARCH SCOPE & METHODOLOGY
- STUDY OBJECTIVES
- METHODOLOGY
- ASSUMPTIONS & LIMITATIONS
EXECUTIVE SUMMARY
- MARKET SIZE & FORECAST
- MARKET OVERVIEW
- SCOPE OF STUDY
- CRISIS SCENARIO ANALYSIS
- MAJOR MARKET FINDINGS
- CANADA HAS A STEADY GROWING WIND MARKET WITH STRONG PRESENCE IN ONTARIO AND QUEBEC
- WIND ENERGY PLAYS A SUPPORTING ROLE ALONGSIDE HYDROPOWER IN THE POWER MIX
- PROVINCIAL POLICIES HAVE A GREATER IMPACT THAN FEDERAL PROGRAMS
- UTILITY SCALE PROJECTS DOMINATE TOTAL INSTALLED CAPACITY
MARKET DYNAMICS
- KEY DRIVERS
- PROVINCIAL CLEAN ENERGY TARGETS ARE DRIVING NEW WIND PROJECT DEVELOPMENT
- ABUNDANT LAND AVAILABILITY SUPPORTS LARGE-SCALE ONSHORE PROJECTS
- FALLING LEVELIZED COST OF WIND POWER IMPROVES COMPETITIVENESS
- INDIGENOUS PARTNERSHIPS AND COMMUNITY OWNERSHIP MODELS SUPPORT PROJECT ACCEPTANCE
- KEY RESTRAINTS
- INTERMITTENT PROCUREMENT SCHEDULES CREATE MARKET UNCERTAINTY
- GRID ACCESS LIMITATIONS IN REMOTE REGIONS RESTRICT DEVELOPMENT
- PERMITTING AND ENVIRONMENTAL REVIEW PROCESSES CAN EXTEND PROJECT TIMELINES
- RELATIVELY LOW POWER PRICES IN HYDRO DOMINATED PROVINCES REDUCE INVESTMENT URGENCY
- KEY DRIVERS
KEY ANALYTICS
- KEY MARKET TRENDS
- INCREASING INTEGRATION OF WIND WITH HYDRO FOR GRID BALANCING IS OBSERVED
- GREATER EMPHASIS ON INDIGENOUS EQUITY PARTICIPATION IS SHAPING PROJECT STRUCTURES
- ADVANCED COLD CLIMATE TURBINE TECHNOLOGIES ARE BEING DEPLOYED
- LONG-TERM POWER CONTRACTS WITH UTILITIES REMAIN THE PREFERRED REVENUE MODEL
- PORTER’S FIVE FORCES ANALYSIS
- BUYERS POWER
- SUPPLIERS POWER
- SUBSTITUTION
- NEW ENTRANTS
- INDUSTRY RIVALRY
- GROWTH PROSPECT MAPPING
- GROWTH PROSPECT MAPPING FOR CANADA
- MARKET MATURITY ANALYSIS
- MARKET CONCENTRATION ANALYSIS
- VALUE CHAIN ANALYSIS
- RAW MATERIAL & MACHINERY SUPPLIERS
- DESIGN & DEVELOPMENT SERVICES
- COMPONENT SUPPLIERS
- WIND TURBINE COMPANIES
- CONSTRUCTION AND INSTALLATION SERVICES
- WIND FARM DEVELOPERS
- KEY BUYING CRITERIA
- GOVERNMENT POLICIES AND INCENTIVES
- TECHNOLOGICAL ADVANCEMENTS
- ENVIRONMENTAL AWARENESS AND SUSTAINABILITY
- ENVIRONMENTAL AND SOCIAL IMPACT ASSESSMENTS
- REGULATORY FRAMEWORK
- KEY MARKET TRENDS
WIND ENERGY MARKET BY LOCATION / INSTALLATION TYPE
- ONSHORE WIND
- MARKET FORECAST FIGURE
- SEGMENT ANALYSIS
- OFFSHORE WIND (FIXED)
- MARKET FORECAST FIGURE
- SEGMENT ANALYSIS
- OFFSHORE WIND (FLOATING)
- MARKET FORECAST FIGURE
- SEGMENT ANALYSIS
- ONSHORE WIND
WIND ENERGY MARKET BY APPLICATION
- UTILITY-SCALE POWER GENERATION
- MARKET FORECAST FIGURE
- SEGMENT ANALYSIS
- COMMERCIAL & INDUSTRIAL (C&I)
- MARKET FORECAST FIGURE
- SEGMENT ANALYSIS
- RESIDENTIAL / SMALL WIND TURBINES
- MARKET FORECAST FIGURE
- SEGMENT ANALYSIS
- UTILITY-SCALE POWER GENERATION
WIND ENERGY MARKET BY TURBINE CAPACITY
- UP TO 1 MW
- MARKET FORECAST FIGURE
- SEGMENT ANALYSIS
- 1–3 MW
- MARKET FORECAST FIGURE
- SEGMENT ANALYSIS
- 3–10 MW
- MARKET FORECAST FIGURE
- SEGMENT ANALYSIS
- ABOVE 10 MW
- MARKET FORECAST FIGURE
- SEGMENT ANALYSIS
- UP TO 1 MW
WIND ENERGY MARKET BY END-USER
- POWER UTILITIES
- MARKET FORECAST FIGURE
- SEGMENT ANALYSIS
- INDEPENDENT POWER PRODUCERS (IPP)
- MARKET FORECAST FIGURE
- SEGMENT ANALYSIS
- COMMERCIAL ENTERPRISES
- MARKET FORECAST FIGURE
- SEGMENT ANALYSIS
- AGRICULTURAL USERS
- MARKET FORECAST FIGURE
- SEGMENT ANALYSIS
- REMOTE / OFF-GRID POWER USERS
- MARKET FORECAST FIGURE
- SEGMENT ANALYSIS
- POWER UTILITIES
WIND ENERGY MARKET BY TECHNOLOGY
- GRID-CONNECTED SYSTEMS
- MARKET FORECAST FIGURE
- SEGMENT ANALYSIS
- OFF-GRID SYSTEMS
- MARKET FORECAST FIGURE
- SEGMENT ANALYSIS
- GRID-CONNECTED SYSTEMS
COMPETITIVE LANDSCAPE
- KEY STRATEGIC DEVELOPMENTS
- MERGERS & ACQUISITIONS
- PRODUCT LAUNCHES & DEVELOPMENTS
- PARTNERSHIPS & AGREEMENTS
- BUSINESS EXPANSIONS & DIVESTITURES
- COMPANY PROFILES
- PATTERN ENERGY GROUP LP
- COMPANY OVERVIEW
- PRODUCTS / SERVICES LIST
- STRENGTHS & CHALLENGES
- BROOKFIELD RENEWABLE PARTNERS
- COMPANY OVERVIEW
- PRODUCTS / SERVICES LIST
- STRENGTHS & CHALLENGES
- INNERGEX RENEWABLE ENERGY INC
- COMPANY OVERVIEW
- PRODUCTS / SERVICES LIST
- STRENGTHS & CHALLENGES
- TRANSALTA CORPORATION
- COMPANY OVERVIEW
- PRODUCTS / SERVICES LIST
- STRENGTHS & CHALLENGES
- EDF RENEWABLES
- COMPANY OVERVIEW
- PRODUCTS / SERVICES LIST
- STRENGTHS & CHALLENGES
- BORALEX INC
- COMPANY OVERVIEW
- PRODUCTS / SERVICES LIST
- STRENGTHS & CHALLENGES
- NORTHLAND POWER INC
- COMPANY OVERVIEW
- PRODUCTS / SERVICES LIST
- STRENGTHS & CHALLENGES
- PATTERN ENERGY GROUP LP
- KEY STRATEGIC DEVELOPMENTS
LIST OF TABLES
TABLE 1: MARKET SNAPSHOT – WIND ENERGY
TABLE 2: WIND ENERGY MARKET REGULATORY FRAMEWORK
TABLE 3: MARKET BY LOCATION / INSTALLATION TYPE, HISTORICAL YEARS, 2022-2024 (IN $ MILLION)
TABLE 4: MARKET BY LOCATION / INSTALLATION TYPE, FORECAST YEARS, 2026-2034 (IN $ MILLION)
TABLE 5: MARKET BY APPLICATION, HISTORICAL YEARS, 2022-2024 (IN $ MILLION)
TABLE 6: MARKET BY APPLICATION, FORECAST YEARS, 2026-2034 (IN $ MILLION)
TABLE 7: MARKET BY TURBINE CAPACITY, HISTORICAL YEARS, 2022-2024 (IN $ MILLION)
TABLE 8: MARKET BY TURBINE CAPACITY, FORECAST YEARS, 2026-2034 (IN $ MILLION)
TABLE 9: MARKET BY END-USER, HISTORICAL YEARS, 2022-2024 (IN $ MILLION)
TABLE 10: MARKET BY END-USER, FORECAST YEARS, 2026-2034 (IN $ MILLION)
TABLE 11: MARKET BY TECHNOLOGY, HISTORICAL YEARS, 2022-2024 (IN $ MILLION)
TABLE 12: MARKET BY TECHNOLOGY, FORECAST YEARS, 2026-2034 (IN $ MILLION)
TABLE 13: KEY PLAYERS OPERATING IN THE CANADIAN MARKET
TABLE 14: LIST OF MERGERS & ACQUISITIONS
TABLE 15: LIST OF PRODUCT LAUNCHES & DEVELOPMENTS
TABLE 16: LIST OF PARTNERSHIPS & AGREEMENTS
TABLE 17: LIST OF BUSINESS EXPANSIONS & DIVESTITURES
LIST OF FIGURES
FIGURE 1: MAJOR MARKET FINDINGS
FIGURE 2: MARKET DYNAMICS
FIGURE 3: KEY MARKET TRENDS
FIGURE 4: PORTER’S FIVE FORCES ANALYSIS
FIGURE 5: GROWTH PROSPECT MAPPING FOR CANADA
FIGURE 6: MARKET MATURITY ANALYSIS
FIGURE 7: MARKET CONCENTRATION ANALYSIS
FIGURE 8: VALUE CHAIN ANALYSIS
FIGURE 9: KEY BUYING CRITERIA
FIGURE 10: SEGMENT GROWTH POTENTIAL, BY LOCATION / INSTALLATION TYPE, IN 2025
FIGURE 11: ONSHORE WIND MARKET SIZE, 2026-2034 (IN $ MILLION)
FIGURE 12: OFFSHORE WIND (FIXED) MARKET SIZE, 2026-2034 (IN $ MILLION)
FIGURE 13: OFFSHORE WIND (FLOATING) MARKET SIZE, 2026-2034 (IN $ MILLION)
FIGURE 14: SEGMENT GROWTH POTENTIAL, BY APPLICATION, IN 2025
FIGURE 15: UTILITY-SCALE POWER GENERATION MARKET SIZE, 2026-2034 (IN $ MILLION)
FIGURE 16: COMMERCIAL & INDUSTRIAL (C&I) MARKET SIZE, 2026-2034 (IN $ MILLION)
FIGURE 17: RESIDENTIAL / SMALL WIND TURBINES MARKET SIZE, 2026-2034 (IN $ MILLION)
FIGURE 18: SEGMENT GROWTH POTENTIAL, BY TURBINE CAPACITY, IN 2025
FIGURE 19: UP TO 1 MW MARKET SIZE, 2026-2034 (IN $ MILLION)
FIGURE 20: 1–3 MW MARKET SIZE, 2026-2034 (IN $ MILLION)
FIGURE 21: 3–10 MW MARKET SIZE, 2026-2034 (IN $ MILLION)
FIGURE 22: ABOVE 10 MW MARKET SIZE, 2026-2034 (IN $ MILLION)
FIGURE 23: SEGMENT GROWTH POTENTIAL, BY END-USER, IN 2025
FIGURE 24: POWER UTILITIES MARKET SIZE, 2026-2034 (IN $ MILLION)
FIGURE 25: INDEPENDENT POWER PRODUCERS (IPP) MARKET SIZE, 2026-2034 (IN $ MILLION)
FIGURE 26: COMMERCIAL ENTERPRISES MARKET SIZE, 2026-2034 (IN $ MILLION)
FIGURE 27: AGRICULTURAL USERS MARKET SIZE, 2026-2034 (IN $ MILLION)
FIGURE 28: REMOTE / OFF-GRID POWER USERS MARKET SIZE, 2026-2034 (IN $ MILLION)
FIGURE 29: SEGMENT GROWTH POTENTIAL, BY TECHNOLOGY, IN 2025
FIGURE 30: GRID-CONNECTED SYSTEMS MARKET SIZE, 2026-2034 (IN $ MILLION)
FIGURE 31: OFF-GRID SYSTEMS MARKET SIZE, 2026-2034 (IN $ MILLION)
FAQ’s
RELATED REPORTS
-

UNITED STATES AI-DRIVEN CLOUD MIGRATION SERVICES MARKET FORECAST 2026-2034
-

UNITED KINGDOM AI-DRIVEN CLOUD MIGRATION SERVICES MARKET FORECAST 2026-2034
-

UNITED ARAB EMIRATES AI-DRIVEN CLOUD MIGRATION SERVICES MARKET FORECAST 2026-2034
-

SOUTH KOREA AI-DRIVEN CLOUD MIGRATION SERVICES MARKET FORECAST 2026-2034
-

SINGAPORE AI-DRIVEN CLOUD MIGRATION SERVICES MARKET FORECAST 2026-2034
-

SAUDI ARABIA AI-DRIVEN CLOUD MIGRATION SERVICES MARKET FORECAST 2026-2034
-

AUSTRALIA AI-DRIVEN CLOUD MIGRATION SERVICES MARKET FORECAST 2026-2034
-

JAPAN AI-DRIVEN CLOUD MIGRATION SERVICES MARKET FORECAST 2026-2034
-

INDIA AI-DRIVEN CLOUD MIGRATION SERVICES MARKET FORECAST 2026-2034
-

CHINA AI-DRIVEN CLOUD MIGRATION SERVICES MARKET FORECAST 2026-2034