The United States Food Delivery Platform Fee Structures Market by Delivery Mode (Platform-To-Consumer Delivery, Restaurant-To-Consumer Delivery), Market by Payment Method (Online Payment, Cash On Delivery (COD)), Market by Revenue Model (Commission-Based Revenue, Delivery Fee-Based Revenue, Advertising & Promotion Revenue, Subscription-Based Revenue), Market by Product Type (Meal Delivery, Grocery Delivery, Meal Kit Delivery, Alcohol Delivery, Other Product Types), by Geography
UNITED STATES FOOD DELIVERY PLATFORM FEE STRUCTURES MARKET OVERVIEW
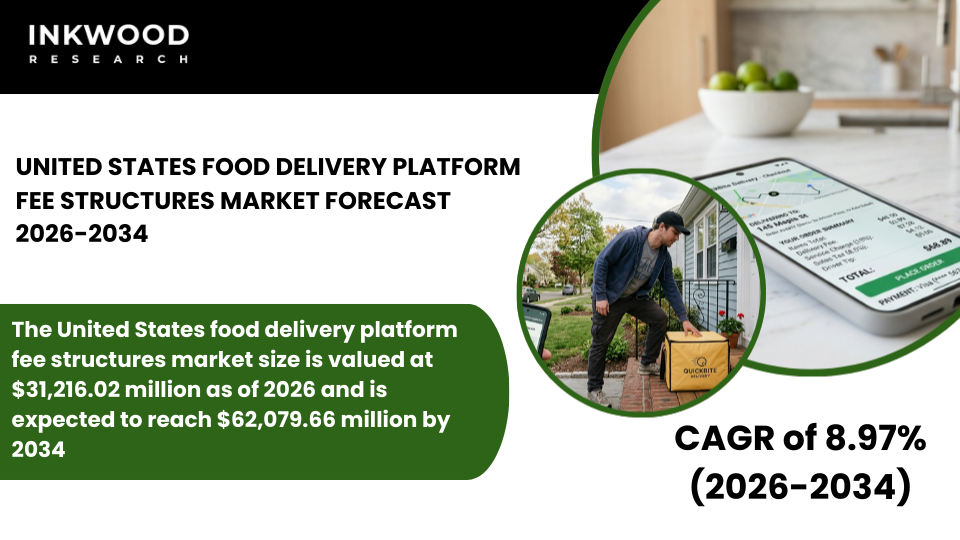
The United States food delivery platform fee structures market size is valued at $31,216.02 million as of 2026 and is expected to reach $62,079.66 million by 2034, progressing with a CAGR of 8.97% during the forecast years, 2026-2034.
MARKET INSIGHTS
The United States stands as the world’s most commercially advanced and regulatory-scrutinized market for food delivery platform fee structures. The country’s online food delivery ecosystem is dominated by a handful of large-scale platforms, each operating sophisticated, multi-layered food delivery platform fee structures that span commission income, delivery service charges, advertising revenue, and subscription-based models.
According to the U.S. Census Bureau, e-commerce food and beverage sales have grown consistently year over year, reflecting a structural shift in how American consumers order and receive meals. This shift, in turn, has made the food delivery platform pricing decisions of companies like DoorDash and Uber Eats increasingly consequential for the hundreds of thousands of restaurants that depend on these platforms for a significant share of their revenue.
Regulatory developments have played a defining role in shaping the U.S. food delivery platform fee structure landscape. New York City’s permanent commission cap, enforced by the NYC Department of Consumer and Worker Protection, limits third-party delivery platforms to charging restaurants no more than 15% for delivery services and 5% for non-delivery services per order. Similar legislation has been introduced or explored in cities including San Francisco, Chicago, and Seattle, signaling a broader municipal effort to rein in restaurant delivery commission levels.
For platforms, these regulatory constraints have accelerated a strategic pivot toward diversified food delivery app revenue streams, particularly advertising products and subscription memberships, to offset any compression in commission-based income. For restaurants, these caps have offered measurable cost relief, though enforcement gaps and platform fee workarounds remain ongoing concerns flagged by industry observers and policymakers alike.
Beyond regulation, the U.S. market is witnessing rapid innovation in food delivery platform business models, with platforms investing heavily in data analytics, AI-driven pricing tools, and logistics technology to improve margins. The U.S. Bureau of Labor Statistics has documented sustained growth in food service sector employment and consumer spending on prepared meals, both of which underpin continued expansion in online food ordering platform fee revenues.
Platforms are also expanding their product scope, moving beyond restaurant meal delivery into grocery, alcohol, and convenience categories, each of which carries its own distinct food delivery commission rate structure and monetization logic. These factors, taken together, are set to boost the food delivery platform fee structures market growth in the United States during the forecast period.
To Know More About This Report, Request a Free Sample Copy
SEGMENTATION ANALYSIS
The United States food delivery platform fee structures market is segmented by delivery mode, payment method, revenue model, and product type. The revenue model segment is categorized into commission-based revenue, delivery fee-based revenue, advertising and promotion revenue, and subscription-based revenue.
Commission-based revenue is a key sub-segment within the revenue model segment of the U.S. food delivery platform fee structures market. It represents the primary mechanism through which platforms generate income from restaurant partners, with food delivery commission rates typically ranging between 15% and 30% of each order value, depending on the service tier and platform.
In the U.S. market specifically, platforms such as DoorDash have introduced tiered commission structures, Basic, Plus, and Premier, that allow restaurants to choose their level of marketing exposure and delivery support in exchange for correspondingly higher or lower food delivery platform fees. This tiered approach to restaurant delivery commission design has proven effective at retaining a broad merchant base, from independent local restaurants to national chains.
In addition, it also gives platforms a lever to grow average take rates among merchants seeking greater visibility. As regulatory caps continue to reshape permissible commission ceilings in key cities, platforms are simultaneously bundling additional value-added services, such as in-app sponsored listings and customer data analytics, into commission tiers, effectively justifying their food delivery platform pricing to both regulators and merchant partners.
COMPETITIVE INSIGHTS
Some of the top players operating in the United States food delivery platform fee structures market include DoorDash Inc, Uber Eats, Grubhub Inc, etc.
DoorDash Inc is the United States’ largest online food ordering platform by market share, headquartered in San Francisco, California. It connects consumers with restaurant partners and independent contractors (Dashers) across thousands of U.S. cities, operating a platform-to-consumer delivery model built around tiered food delivery commission rates and a growing suite of merchant marketing tools.
DoorDash also operates DashPass, its consumer subscription service, and Storefront, a white-label online ordering solution for restaurants, reflecting a diversified food delivery platform business model that extends well beyond its core restaurant delivery commission revenue.
REPORT SYNOPSIS
| REPORT SCOPE | DETAILS |
|---|---|
| Market Forecast Years | 2026-2034 |
| Base Year | 2025 |
| Market Historical Years | 2022-2024 |
| Forecast Units | Revenue ($ Million) |
| Segments Analyzed | Delivery Mode, Payment Method, Revenue Model, Product Type |
| Country Analyzed | The United States |
| Companies Analyzed | DoorDash Inc, Uber Eats, Grubhub Inc, Instacart, Postmates, ChowNow, Gopuff |
TABLE OF CONTENTS
RESEARCH SCOPE & METHODOLOGY
- STUDY OBJECTIVES
- METHODOLOGY
- ASSUMPTIONS & LIMITATIONS
EXECUTIVE SUMMARY
- MARKET SIZE, SHARE & ESTIMATES
- MARKET OVERVIEW
- SCOPE OF STUDY
- MAJOR MARKET FINDINGS
- THE UNITED STATES FOOD DELIVERY PLATFORM FEE STRUCTURES MARKET IS CHARACTERIZED BY HIGH PLATFORM COMMISSION RATES AND DIVERSE MONETIZATION MODELS INCLUDING DELIVERY FEES, ADVERTISING, AND SUBSCRIPTION PROGRAMS
- PLATFORM-TO-CONSUMER DELIVERY MODELS DOMINATE THE MARKET AS MAJOR APPS CONTROL LOGISTICS AND CHARGE RESTAURANTS COMMISSIONS RANGING FROM LOW TO PREMIUM TIERS BASED ON SERVICE LEVELS
- REGULATORY INTERVENTIONS IN SEVERAL STATES AND CITIES HAVE LED TO TEMPORARY OR PERMANENT CAPS ON COMMISSION FEES CHARGED BY FOOD DELIVERY PLATFORMS
- LEADING PLATFORMS ARE INCREASINGLY RELYING ON ADVERTISING, PROMOTIONAL PLACEMENTS, AND LOYALTY PROGRAMS TO OFFSET MARGIN PRESSURES FROM DELIVERY COSTS
MARKET DYNAMICS
- KEY DRIVERS
- RISING CONSUMER DEMAND FOR CONVENIENT DIGITAL FOOD ORDERING SERVICES IS DRIVING THE EXPANSION OF PLATFORM FEE STRUCTURES AND REVENUE MODELS
- THE WIDESPREAD ADOPTION OF MOBILE PAYMENTS AND APP-BASED ORDERING IS ENABLING PLATFORMS TO IMPLEMENT DYNAMIC PRICING AND FEE OPTIMIZATION STRATEGIES
- STRONG INVESTMENT IN LOGISTICS NETWORKS AND AI-DRIVEN DELIVERY OPTIMIZATION IS SUPPORTING HIGHER TAKE RATES AND IMPROVED PLATFORM EFFICIENCY
- THE GROWING ROLE OF RESTAURANT MARKETING TOOLS AND IN-APP ADVERTISING IS GENERATING ADDITIONAL PLATFORM REVENUE STREAMS
- KEY RESTRAINTS
- REGULATORY PRESSURE AND LOCAL GOVERNMENT CAPS ON DELIVERY COMMISSIONS ARE LIMITING THE PROFITABILITY OF FOOD DELIVERY PLATFORM FEE STRUCTURES
- HIGH CUSTOMER ACQUISITION COSTS AND PROMOTIONAL DISCOUNTS ARE REDUCING THE EFFECTIVE REVENUE GENERATED PER ORDER
- RESTAURANT PUSHBACK AGAINST HIGH COMMISSION RATES IS DRIVING NEGOTIATIONS AND ALTERNATIVE DELIVERY CHANNELS
- RISING LABOR AND LOGISTICS COSTS ARE INCREASING THE OPERATIONAL BURDEN FOR PLATFORM-TO-CONSUMER DELIVERY MODELS
- KEY DRIVERS
STRATEGIC MARKET ANALYTICS
- GROWTH METRICS
- TAM, SAM & SOM OPPORTUNITY ANALYSIS
- EMERGING MARKET TRENDS & PARADIGM SHIFTS
- PLATFORMS ARE INTRODUCING TIERED COMMISSION STRUCTURES THAT OFFER RESTAURANTS DIFFERENT VISIBILITY AND DELIVERY SERVICE LEVELS
- SUBSCRIPTION PROGRAMS SUCH AS UNLIMITED FREE DELIVERY MEMBERSHIPS ARE BECOMING A MAJOR COMPONENT OF PLATFORM REVENUE STRATEGIES
- AI-BASED DEMAND FORECASTING AND SURGE PRICING MODELS ARE BEING USED TO OPTIMIZE DELIVERY FEES AND PLATFORM TAKE RATES
- FOOD DELIVERY APPS ARE EXPANDING INTO ADJACENT SERVICES SUCH AS GROCERY AND RETAIL DELIVERY TO DIVERSIFY PLATFORM FEE STRUCTURES
- PORTER’S FIVE FORCES ANALYSIS
- BUYERS POWER
- SUPPLIERS POWER
- SUBSTITUTION
- NEW ENTRANTS
- INDUSTRY RIVALRY
- PESTLE ANALYSIS
- POLITICAL
- ECONOMIC
- SOCIAL LANDSCAPE
- TECHNOLOGY
- LEGAL
- ENVIRONMENTAL
- GROWTH OPPORTUNITY MAPPING & HEATMAP
- GROWTH PROSPECT MAPPING FOR THE UNITED STATES
- MARKET MATURITY & LIFECYCLE ANALYSIS
- MARKET CONCENTRATION ANALYSIS
- GROWTH METRICS
FOOD DELIVERY PLATFORM FEE STRUCTURES VALUE CHAIN & DECISION FRAMEWORK
- VALUE CHAIN ANALYSIS
- MERCHANT ONBOARDING & FEE CONTRACTING
- PLATFORM TECHNOLOGY & FEE ENGINE
- FEE STRUCTURE DESIGN & MONETIZATION
- LOGISTICS & DELIVERY COST MANAGEMENT
- MARKETING, VISIBILITY & DEMAND GENERATION
- SETTLEMENT, ANALYTICS & REGULATORY COMPLIANCE
- KEY BUYING CRITERIA
- COMMISSION LEVELS & FEE TRANSPARENCY
- IMPACT ON MERCHANT PROFITABILITY
- FLEXIBILITY OF FEE MODELS
- DEMAND REACH & ORDER POTENTIAL
- PROMOTION EFFECTIVENESS & VISIBILITY ROI
- SETTLEMENT RELIABILITY & PLATFORM CREDIBILITY
- PRICING MODELS, FEE STRUCTURES & TAKE RATE OPTIMIZATION STRATEGIES
- REGULATORY & POLICY LANDSCAPE ANALYSIS
- VALUE CHAIN ANALYSIS
FOOD DELIVERY PLATFORM FEE STRUCTURES MARKET BY DELIVERY MODE
- PLATFORM-TO-CONSUMER DELIVERY
- MARKET SIZE, FORECAST & SHARE (2022–2034)
- RESTAURANT-TO-CONSUMER DELIVERY
- MARKET SIZE, FORECAST & SHARE (2022–2034)
- PLATFORM-TO-CONSUMER DELIVERY
FOOD DELIVERY PLATFORM FEE STRUCTURES MARKET BY PAYMENT METHOD
- ONLINE PAYMENT
- MARKET SIZE, FORECAST & SHARE (2022–2034)
- CASH ON DELIVERY (COD)
- MARKET SIZE, FORECAST & SHARE (2022–2034)
- ONLINE PAYMENT
FOOD DELIVERY PLATFORM FEE STRUCTURES MARKET BY REVENUE MODEL
- COMMISSION-BASED REVENUE
- MARKET SIZE, FORECAST & SHARE (2022–2034)
- DELIVERY FEE-BASED REVENUE
- MARKET SIZE, FORECAST & SHARE (2022–2034)
- ADVERTISING & PROMOTION REVENUE
- MARKET SIZE, FORECAST & SHARE (2022–2034)
- SUBSCRIPTION-BASED REVENUE
- MARKET SIZE, FORECAST & SHARE (2022–2034)
- COMMISSION-BASED REVENUE
FOOD DELIVERY PLATFORM FEE STRUCTURES MARKET BY PRODUCT TYPE
- MEAL DELIVERY
- MARKET SIZE, FORECAST & SHARE (2022–2034)
- GROCERY DELIVERY
- MARKET SIZE, FORECAST & SHARE (2022–2034)
- MEAL KIT DELIVERY
- MARKET SIZE, FORECAST & SHARE (2022–2034)
- ALCOHOL DELIVERY
- MARKET SIZE, FORECAST & SHARE (2022–2034)
- OTHER PRODUCT TYPES
- MARKET SIZE, FORECAST & SHARE (2022–2034)
- MEAL DELIVERY
COMPETITIVE LANDSCAPE
- KEY STRATEGIC DEVELOPMENTS
- MERGERS & ACQUISITIONS
- PRODUCT LAUNCHES & DEVELOPMENTS
- PARTNERSHIPS & AGREEMENTS
- BUSINESS EXPANSIONS & DIVESTITURES
- COMPETITOR POSITIONING & DIFFERENTIATION MAP
- COMPANY PROFILES
- DOORDASH INC
- COMPANY OVERVIEW
- PRODUCT LIST
- STRENGTHS & CHALLENGES
- UBER EATS
- COMPANY OVERVIEW
- PRODUCT LIST
- STRENGTHS & CHALLENGES
- GRUBHUB INC
- COMPANY OVERVIEW
- PRODUCT LIST
- STRENGTHS & CHALLENGES
- INSTACART
- COMPANY OVERVIEW
- PRODUCT LIST
- STRENGTHS & CHALLENGES
- POSTMATES
- COMPANY OVERVIEW
- PRODUCT LIST
- STRENGTHS & CHALLENGES
- CHOWNOW
- COMPANY OVERVIEW
- PRODUCT LIST
- STRENGTHS & CHALLENGES
- GOPUFF
- COMPANY OVERVIEW
- PRODUCT LIST
- STRENGTHS & CHALLENGES
- DOORDASH INC
- KEY STRATEGIC DEVELOPMENTS
LIST OF TABLES
TABLE 1: MARKET SNAPSHOT – FOOD DELIVERY PLATFORM FEE STRUCTURES
TABLE 2: PRICING MODELS, FEE STRUCTURES & TAKE RATE OPTIMIZATION STRATEGIES
TABLE 3: REGULATORY & POLICY LANDSCAPE ANALYSIS
TABLE 4: MARKET BY DELIVERY MODE, HISTORICAL YEARS, 2022-2024 (IN $ MILLION)
TABLE 5: MARKET BY DELIVERY MODE, FORECAST YEARS, 2026-2034 (IN $ MILLION)
TABLE 6: MARKET BY PAYMENT METHOD, HISTORICAL YEARS, 2022-2024 (IN $ MILLION)
TABLE 7: MARKET BY PAYMENT METHOD, FORECAST YEARS, 2026-2034 (IN $ MILLION)
TABLE 8: MARKET BY REVENUE MODEL, HISTORICAL YEARS, 2022-2024 (IN $ MILLION)
TABLE 9: MARKET BY REVENUE MODEL, FORECAST YEARS, 2026-2034 (IN $ MILLION)
TABLE 10: MARKET BY PRODUCT TYPE, HISTORICAL YEARS, 2022-2024 (IN $ MILLION)
TABLE 11: MARKET BY PRODUCT TYPE, FORECAST YEARS, 2026-2034 (IN $ MILLION)
TABLE 12: KEY PLAYERS OPERATING IN THE UNITED STATES MARKET
TABLE 13: LIST OF MERGERS & ACQUISITIONS
TABLE 14: LIST OF PRODUCT LAUNCHES & DEVELOPMENTS
TABLE 15: LIST OF PARTNERSHIPS & AGREEMENTS
TABLE 16: LIST OF BUSINESS EXPANSIONS & DIVESTITURES
LIST OF FIGURES
FIGURE 1: MAJOR MARKET FINDINGS
FIGURE 2: MARKET DYNAMICS
FIGURE 3: KEY MARKET TRENDS
FIGURE 4: PORTER’S FIVE FORCES ANALYSIS
FIGURE 5: GROWTH PROSPECT MAPPING FOR THE UNITED STATES
FIGURE 6: MARKET MATURITY ANALYSIS
FIGURE 7: MARKET CONCENTRATION ANALYSIS
FIGURE 8: VALUE CHAIN ANALYSIS
FIGURE 9: KEY BUYING CRITERIA
FIGURE 10: SEGMENT GROWTH POTENTIAL, BY DELIVERY MODE, IN 2025
FIGURE 11: PLATFORM-TO-CONSUMER DELIVERY MARKET SIZE, 2026-2034 (IN $ MILLION)
FIGURE 12: RESTAURANT-TO-CONSUMER DELIVERY MARKET SIZE, 2026-2034 (IN $ MILLION)
FIGURE 13: SEGMENT GROWTH POTENTIAL, BY PAYMENT METHOD, IN 2025
FIGURE 14: ONLINE PAYMENT MARKET SIZE, 2026-2034 (IN $ MILLION)
FIGURE 15: CASH ON DELIVERY (COD) MARKET SIZE, 2026-2034 (IN $ MILLION)
FIGURE 16: SEGMENT GROWTH POTENTIAL, BY REVENUE MODEL, IN 2025
FIGURE 17: COMMISSION-BASED REVENUE MARKET SIZE, 2026-2034 (IN $ MILLION)
FIGURE 18: DELIVERY FEE-BASED REVENUE MARKET SIZE, 2026-2034 (IN $ MILLION)
FIGURE 19: ADVERTISING & PROMOTION REVENUE MARKET SIZE, 2026-2034 (IN $ MILLION)
FIGURE 20: SUBSCRIPTION-BASED REVENUE MARKET SIZE, 2026-2034 (IN $ MILLION)
FIGURE 21: SEGMENT GROWTH POTENTIAL, BY PRODUCT TYPE, IN 2025
FIGURE 22: MEAL DELIVERY MARKET SIZE, 2026-2034 (IN $ MILLION)
FIGURE 23: GROCERY DELIVERY MARKET SIZE, 2026-2034 (IN $ MILLION)
FIGURE 24: MEAL KIT DELIVERY MARKET SIZE, 2026-2034 (IN $ MILLION)
FIGURE 25: ALCOHOL DELIVERY MARKET SIZE, 2026-2034 (IN $ MILLION)
FIGURE 26: OTHER PRODUCT TYPES MARKET SIZE, 2026-2034 (IN $ MILLION)
FAQ’s
RELATED REPORTS
-

LATIN AMERICA FACIAL RECOGNITION MARKET FORECAST 2019-2028
-

UNITED STATES AI-DRIVEN CLOUD MIGRATION SERVICES MARKET FORECAST 2026-2034
-

UNITED KINGDOM AI-DRIVEN CLOUD MIGRATION SERVICES MARKET FORECAST 2026-2034
-

UNITED ARAB EMIRATES AI-DRIVEN CLOUD MIGRATION SERVICES MARKET FORECAST 2026-2034
-

SOUTH KOREA AI-DRIVEN CLOUD MIGRATION SERVICES MARKET FORECAST 2026-2034
-

SINGAPORE AI-DRIVEN CLOUD MIGRATION SERVICES MARKET FORECAST 2026-2034
-

SAUDI ARABIA AI-DRIVEN CLOUD MIGRATION SERVICES MARKET FORECAST 2026-2034
-

AUSTRALIA AI-DRIVEN CLOUD MIGRATION SERVICES MARKET FORECAST 2026-2034
-

JAPAN AI-DRIVEN CLOUD MIGRATION SERVICES MARKET FORECAST 2026-2034
-

INDIA AI-DRIVEN CLOUD MIGRATION SERVICES MARKET FORECAST 2026-2034