United States Biogas Market by Source Type (Agricultural, Industrial, Municipal) Market by Application (Electricity Generation, Biofuel Production, Heat Generation) Market by End-User (Power Utilities, Industrial, Commercial, Residential, Other End-Users) Market by Technology (Fixed Dome, Floating Drum, Balloon, Other Plant Concepts, Wet Vs Dry Digestion, Single Vs Multi-Stage), by Geography
UNITED STATES BIOGAS MARKET OVERVIEW
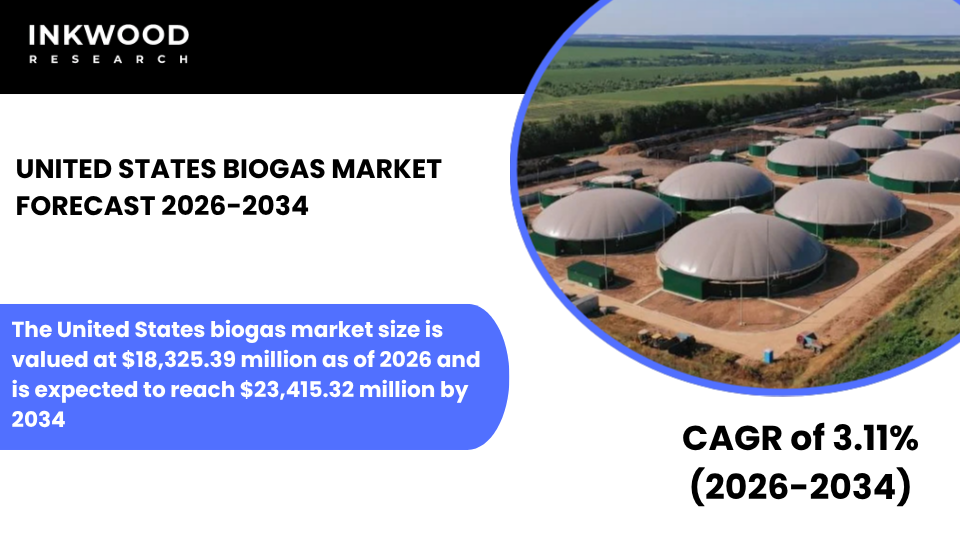
The United States biogas market size is valued at $18,325.39 million as of 2026 and is expected to reach $23,415.32 million by 2034, progressing with a CAGR of 3.11% during the forecast years, 2026-2034.
The United States biogas industry demonstrates robust momentum, driven primarily by landfill gas recovery and agricultural digester projects that convert organic waste into renewable energy. According to the American Biogas Council, the country operates approximately 2,500 biogas facilities as of early 2025, representing record growth with 125 new projects commissioned during 2024 alone.
Furthermore, investment capital surged by $3 billion in 2024, marking a 40% increase compared to the previous year and reflecting a strong financial commitment to decarbonization infrastructure. Total biogas production reached 1.4 million standard cubic feet per minute as of late 2024/early 2025, sufficient to power 2.4 million homes annually or displace fuel equivalent to removing 2.6 million gasoline vehicles from roadways.
Renewable natural gas production emerges as the primary value driver, fundamentally reshaping market economics and project development strategies. Over recent years, approximately two-thirds (around 66%) of global biogas production was used for electricity and heat generation, primarily through combined heat and power (CHP) units. However, biomethane upgrading now captures a smaller, but rapidly growing, share of total biogas output as projects pivot toward higher-value pipeline injection and transportation fuel markets.
Renewable natural gas (RNG), also known as biomethane, is increasingly recognized as a key value driver in the biogas sector, influencing market economics and project development strategies through higher revenue potential from pipeline injection and transportation fuel applications.
According to the International Energy Agency (IEA) analysis from its 2020 Outlook for Biogas and Biomethane, approximately two-thirds of global biogas production in 2018 was utilized for electricity and heat generation. This was primarily via combined heat and power (CHP) units, with the remainder largely directed toward direct heating (e.g., cooking) or limited upgrading to biomethane.
To Know More About This Report, Request a Free Sample Copy
More recent data indicate a gradual shift toward biomethane upgrading, driven by policies supporting renewable fuels and decarbonization in hard-to-electrify sectors. Globally, biomethane production remains a smaller fraction of total biogas output, estimated at around 10-15% in recent years based on regional trends and IEA projections.
Nevertheless, the pace of biogas upgrading to biomethane is accelerating in key markets, most notably in Europe, where biomethane production reached 4.9 billion cubic meters in 2023 and continues to represent a rising share of total biogas output. This growth is further supported in North America by robust policy incentives promoting renewable natural gas for transportation fuel and pipeline injection, driving significant expansions in production capacity.
Agricultural biogas sector expansion accelerated dramatically, growing 24% year-over-year as farm-based digesters surpassed landfill projects in new facility additions for the first time. The American Biogas Council data reveals 615 agricultural digesters now operate nationwide, with 93 new projects commissioned in 2024 compared to 24 landfill facilities.
Further, dairy operations account for 86% of farm-based systems, leveraging consistent manure production that generates 120-150 pounds daily per cow to create predictable biogas yields. Rural agricultural projects represented billions in capital investment, bringing economic development and renewable energy infrastructure to farming communities while addressing methane emissions from livestock operations.
The United States biogas market is segmented into source type, application, end-user, and technology. The technology segment is further categorized into fixed dome, floating drum, balloon, other plant concepts, wet vs dry digestion, and single vs multi-stage.
Other plant concepts encompass advanced anaerobic digestion configurations and gas upgrading technologies that optimize renewable natural gas production economics. This segment includes membrane separation, pressure swing adsorption, and water wash systems that remove carbon dioxide, nitrogen, and oxygen from raw biogas to achieve pipeline-quality biomethane specifications.
Technology selection depends on feedstock characteristics, particularly for landfill gas applications, where variable oxygen and nitrogen concentrations require sophisticated separation capabilities. Membrane-based upgrading systems offer modular designs with lower capital costs, making renewable natural gas projects more accessible for mid-scale developers.
Meanwhile, pressure swing adsorption delivers high methane recovery rates exceeding 99% purity, critical for transportation fuel applications and grid injection compliance. The segment benefits from continuous innovation around cost reduction and performance enhancement, as equipment suppliers develop next-generation systems that maximize methane recovery while minimizing upfront capital expenditure.
Advanced biogas desulfurization technologies address hydrogen sulfide removal challenges that affect equipment longevity and operational reliability across all biogas projects. Furthermore, modular plant designs enable phased capacity expansion, allowing project developers to scale production incrementally as feedstock availability increases and offtake agreements mature.
Some of the top players operating in the United States biogas market include Greenlane Renewables Inc, DVO Inc, etc.
Greenlane Renewables Inc operates as a specialized provider of biogas upgrading and desulfurization systems serving renewable natural gas developers worldwide. The company supplies three main biogas upgrading technologies, including water wash, pressure swing adsorption, and membrane separation systems, alongside proprietary biogas desulfurization equipment that removes hydrogen sulfide from raw biogas streams.
Headquartered in British Columbia, Canada, Greenlane maintains significant operations serving the United States market through system installations at landfills, wastewater treatment plants, dairy farms, and food waste facilities. Greenlane’s technology portfolio transforms biogas into pipeline-quality renewable natural gas suitable for grid injection or direct use as commercial vehicle fuel, supporting decarbonization objectives in natural gas distribution and heavy transportation sectors.
The firm recently filed patent applications for next-generation landfill gas upgrading technology architected to maximize methane recovery performance while reducing capital costs, making renewable natural gas projects more economically accessible for developers. Strategic focus areas include expanding aftermarket parts and service offerings that optimize existing facility performance, alongside developing licensing arrangements that generate recurring royalty revenues from international markets experiencing biomethane growth.
REPORT SYNOPSIS
| REPORT SCOPE | DETAILS |
|---|---|
| Market Forecast Years | 2026-2034 |
| Base Year | 2025 |
| Market Historical Years | 2022-2024 |
| Forecast Units | Revenue ($ Million) |
| Segments Analyzed | Source Type, Application, End-User, and Technology |
| Country Analyzed | The United States |
| Companies Analyzed | DMT International, DVO Inc, ENGIE SA, EnviTec Biogas AG, Evonik Industries AG, Greenlane Renewables Inc, PlanET Biogas |
TABLE OF CONTENTS
RESEARCH SCOPE & METHODOLOGY
- STUDY OBJECTIVES
- METHODOLOGY
- ASSUMPTIONS & LIMITATIONS
EXECUTIVE SUMMARY
- MARKET SIZE & FORECAST
- MARKET OVERVIEW
- SCOPE OF STUDY
- CRISIS SCENARIO ANALYSIS
- MAJOR MARKET FINDINGS
- THE UNITED STATES BIOGAS MARKET IS DRIVEN PRIMARILY BY LANDFILL AND AGRICULTURAL DIGESTER PROJECTS
- RENEWABLE NATURAL GAS PRODUCTION IS BECOMING THE PRIMARY VALUE DRIVER
- CORPORATE AND UTILITY OFFTAKE AGREEMENTS PLAY A KEY ROLE IN PROJECT BANKABILITY
- STATE LEVEL POLICIES CREATE A HIGHLY REGIONALIZED MARKET STRUCTURE
MARKET DYNAMICS
- KEY DRIVERS
- STRONG INCENTIVES UNDER LOW CARBON FUEL STANDARDS SUPPORT RNG PROJECT ECONOMICS
- INCREASING CORPORATE COMMITMENTS TO DECARBONIZATION DRIVE LONG-TERM GAS OFFTAKE
- ABUNDANT ORGANIC WASTE FROM AGRICULTURE AND LANDFILLS ENSURES FEEDSTOCK SECURITY
- ADVANCED PROJECT FINANCING MODELS ATTRACT PRIVATE EQUITY AND INFRASTRUCTURE INVESTORS
- KEY RESTRAINTS
- HIGH CAPITAL COSTS AND LONG DEVELOPMENT TIMELINES INCREASE PROJECT RISK
- DEPENDENCE ON POLICY INCENTIVES CREATES REVENUE VOLATILITY
- PERMITTING AND COMMUNITY APPROVAL PROCESSES CAN DELAY PROJECT EXECUTION
- OPERATIONAL COMPLEXITY REQUIRES SPECIALIZED TECHNICAL EXPERTISE
- KEY DRIVERS
KEY ANALYTICS
- KEY MARKET TRENDS
- RAPID EXPANSION OF RNG PROJECTS FOR TRANSPORT AND PIPELINE INJECTION IS OBSERVED
- PARTNERSHIPS BETWEEN WASTE OPERATORS AND ENERGY COMPANIES ARE INCREASING
- TECHNOLOGY FOCUS IS SHIFTING TOWARD HIGH-EFFICIENCY GAS UPGRADING SYSTEMS
- CONSOLIDATION ACTIVITY IS RISING AS LARGE PLAYERS SCALE PORTFOLIOS
- PORTER’S FIVE FORCES ANALYSIS
- BUYERS POWER
- SUPPLIERS POWER
- SUBSTITUTION
- NEW ENTRANTS
- INDUSTRY RIVALRY
- GROWTH PROSPECT MAPPING
- GROWTH PROSPECT MAPPING FOR THE UNITED STATES
- MARKET MATURITY ANALYSIS
- MARKET CONCENTRATION ANALYSIS
- VALUE CHAIN ANALYSIS
- FEEDSTOCK COLLECTION
- WASTE PRETREATMENT
- ANAEROBIC DIGESTION
- BIOGAS UPGRADING
- POWER GENERATION
- DISTRIBUTION SALES
- KEY BUYING CRITERIA
- FEEDSTOCK AVAILABILITY
- CAPEX PAYBACK
- TECHNOLOGY RELIABILITY
- POLICY INCENTIVES
- REGULATORY FRAMEWORK
- KEY MARKET TRENDS
BIOGAS MARKET BY SOURCE TYPE
- AGRICULTURAL
- MARKET FORECAST FIGURE
- SEGMENT ANALYSIS
- INDUSTRIAL
- MARKET FORECAST FIGURE
- SEGMENT ANALYSIS
- MUNICIPAL
- MARKET FORECAST FIGURE
- SEGMENT ANALYSIS
- AGRICULTURAL
BIOGAS MARKET BY APPLICATION
- ELECTRICITY GENERATION
- MARKET FORECAST FIGURE
- SEGMENT ANALYSIS
- BIOFUEL PRODUCTION
- MARKET FORECAST FIGURE
- SEGMENT ANALYSIS
- HEAT GENERATION
- MARKET FORECAST FIGURE
- SEGMENT ANALYSIS
- ELECTRICITY GENERATION
BIOGAS MARKET BY END-USER
- POWER UTILITIES
- MARKET FORECAST FIGURE
- SEGMENT ANALYSIS
- INDUSTRIAL
- MARKET FORECAST FIGURE
- SEGMENT ANALYSIS
- COMMERCIAL
- MARKET FORECAST FIGURE
- SEGMENT ANALYSIS
- RESIDENTIAL
- MARKET FORECAST FIGURE
- SEGMENT ANALYSIS
- OTHER END-USERS
- MARKET FORECAST FIGURE
- SEGMENT ANALYSIS
- POWER UTILITIES
BIOGAS MARKET BY TECHNOLOGY
- FIXED DOME
- MARKET FORECAST FIGURE
- SEGMENT ANALYSIS
- FLOATING DRUM
- MARKET FORECAST FIGURE
- SEGMENT ANALYSIS
- BALLOON
- MARKET FORECAST FIGURE
- SEGMENT ANALYSIS
- OTHER PLANT CONCEPTS
- MARKET FORECAST FIGURE
- SEGMENT ANALYSIS
- WET VS DRY DIGESTION
- MARKET FORECAST FIGURE
- SEGMENT ANALYSIS
- SINGLE VS MULTI‑STAGE
- MARKET FORECAST FIGURE
- SEGMENT ANALYSIS
- FIXED DOME
COMPETITIVE LANDSCAPE
- KEY STRATEGIC DEVELOPMENTS
- MERGERS & ACQUISITIONS
- PRODUCT LAUNCHES & DEVELOPMENTS
- PARTNERSHIPS & AGREEMENTS
- BUSINESS EXPANSIONS & DIVESTITURES
- COMPANY PROFILES
- DMT INTERNATIONAL
- COMPANY OVERVIEW
- PRODUCT LIST
- STRENGTHS & CHALLENGES
- DVO INC
- COMPANY OVERVIEW
- PRODUCT LIST
- STRENGTHS & CHALLENGES
- ENGIE SA
- COMPANY OVERVIEW
- PRODUCT LIST
- STRENGTHS & CHALLENGES
- ENVITEC BIOGAS AG
- COMPANY OVERVIEW
- PRODUCT LIST
- STRENGTHS & CHALLENGES
- EVONIK INDUSTRIES AG
- COMPANY OVERVIEW
- PRODUCT LIST
- STRENGTHS & CHALLENGES
- GREENLANE RENEWABLES INC
- COMPANY OVERVIEW
- PRODUCT LIST
- STRENGTHS & CHALLENGES
- PLANET BIOGAS
- COMPANY OVERVIEW
- PRODUCT LIST
- STRENGTHS & CHALLENGES
- DMT INTERNATIONAL
- KEY STRATEGIC DEVELOPMENTS
LIST OF TABLES
TABLE 1: MARKET SNAPSHOT – BIOGAS
TABLE 2: BIOGAS MARKET REGULATORY FRAMEWORK
TABLE 3: MARKET BY SOURCE TYPE, HISTORICAL YEARS, 2022-2024 (IN $ MILLION)
TABLE 4: MARKET BY SOURCE TYPE, FORECAST YEARS, 2026-2034 (IN $ MILLION)
TABLE 5: MARKET BY APPLICATION, HISTORICAL YEARS, 2022-2024 (IN $ MILLION)
TABLE 6: MARKET BY APPLICATION, FORECAST YEARS, 2026-2034 (IN $ MILLION)
TABLE 7: MARKET BY END-USER, HISTORICAL YEARS, 2022-2024 (IN $ MILLION)
TABLE 8: MARKET BY END-USER, FORECAST YEARS, 2026-2034 (IN $ MILLION)
TABLE 9: MARKET BY TECHNOLOGY, HISTORICAL YEARS, 2022-2024 (IN $ MILLION)
TABLE 10: MARKET BY TECHNOLOGY, FORECAST YEARS, 2026-2034 (IN $ MILLION)
TABLE 11: KEY PLAYERS OPERATING IN THE UNITED STATES MARKET
TABLE 12: LIST OF MERGERS & ACQUISITIONS
TABLE 13: LIST OF PRODUCT LAUNCHES & DEVELOPMENTS
TABLE 14: LIST OF PARTNERSHIPS & AGREEMENTS
TABLE 15: LIST OF BUSINESS EXPANSIONS & DIVESTITURES
LIST OF FIGURES
FIGURE 1: KEY MARKET TRENDS
FIGURE 2: PORTER’S FIVE FORCES ANALYSIS
FIGURE 3: GROWTH PROSPECT MAPPING FOR THE UNITED STATES
FIGURE 4: MARKET MATURITY ANALYSIS
FIGURE 5: MARKET CONCENTRATION ANALYSIS
FIGURE 6: VALUE CHAIN ANALYSIS
FIGURE 7: KEY BUYING CRITERIA
FIGURE 8: SEGMENT GROWTH POTENTIAL, BY SOURCE TYPE, IN 2025
FIGURE 9: AGRICULTURAL MARKET SIZE, 2026-2034 (IN $ MILLION)
FIGURE 10: INDUSTRIAL MARKET SIZE, 2026-2034 (IN $ MILLION)
FIGURE 11: MUNICIPAL MARKET SIZE, 2026-2034 (IN $ MILLION)
FIGURE 12: SEGMENT GROWTH POTENTIAL, BY APPLICATION, IN 2025
FIGURE 13: ELECTRICITY GENERATION MARKET SIZE, 2026-2034 (IN $ MILLION)
FIGURE 14: BIOFUEL PRODUCTION MARKET SIZE, 2026-2034 (IN $ MILLION)
FIGURE 15: HEAT GENERATION MARKET SIZE, 2026-2034 (IN $ MILLION)
FIGURE 16: SEGMENT GROWTH POTENTIAL, BY END-USER, IN 2025
FIGURE 17: POWER UTILITIES MARKET SIZE, 2026-2034 (IN $ MILLION)
FIGURE 18: INDUSTRIAL MARKET SIZE, 2026-2034 (IN $ MILLION)
FIGURE 19: COMMERCIAL MARKET SIZE, 2026-2034 (IN $ MILLION)
FIGURE 20: RESIDENTIAL MARKET SIZE, 2026-2034 (IN $ MILLION)
FIGURE 21: OTHER END-USERS MARKET SIZE, 2026-2034 (IN $ MILLION)
FIGURE 22: SEGMENT GROWTH POTENTIAL, BY TECHNOLOGY, IN 2025
FIGURE 23: FIXED DOME MARKET SIZE, 2026-2034 (IN $ MILLION)
FIGURE 24: FLOATING DRUM MARKET SIZE, 2026-2034 (IN $ MILLION)
FIGURE 25: BALLOON MARKET SIZE, 2026-2034 (IN $ MILLION)
FIGURE 26: OTHER PLANT CONCEPTS MARKET SIZE, 2026-2034 (IN $ MILLION)
FIGURE 27: WET VS DRY DIGESTION MARKET SIZE, 2026-2034 (IN $ MILLION)
FIGURE 28: SINGLE VS MULTI-STAGE MARKET SIZE, 2026-2034 (IN $ MILLION)
FAQ’s
RELATED REPORTS
-

UNITED STATES AI-DRIVEN CLOUD MIGRATION SERVICES MARKET FORECAST 2026-2034
-

UNITED KINGDOM AI-DRIVEN CLOUD MIGRATION SERVICES MARKET FORECAST 2026-2034
-

UNITED ARAB EMIRATES AI-DRIVEN CLOUD MIGRATION SERVICES MARKET FORECAST 2026-2034
-

SOUTH KOREA AI-DRIVEN CLOUD MIGRATION SERVICES MARKET FORECAST 2026-2034
-

SINGAPORE AI-DRIVEN CLOUD MIGRATION SERVICES MARKET FORECAST 2026-2034
-

SAUDI ARABIA AI-DRIVEN CLOUD MIGRATION SERVICES MARKET FORECAST 2026-2034
-

AUSTRALIA AI-DRIVEN CLOUD MIGRATION SERVICES MARKET FORECAST 2026-2034
-

JAPAN AI-DRIVEN CLOUD MIGRATION SERVICES MARKET FORECAST 2026-2034
-

INDIA AI-DRIVEN CLOUD MIGRATION SERVICES MARKET FORECAST 2026-2034
-

CHINA AI-DRIVEN CLOUD MIGRATION SERVICES MARKET FORECAST 2026-2034