The United Kingdom Liquefied Natural Gas (LNG) Market by LNG Infrastructure (LNG Liquefaction Plants, LNG Regasification Facilities, LNG Shipping & Transportation) Market by Application (Transportation, Industrial Feedstock, Power Generation, Other Applications) Market by Mode of Supply (Truck, Transshipment and Bunkering, Pipeline and Rail)
UNITED KINGDOM LIQUEFIED NATURAL GAS (LNG) MARKET OVERVIEW
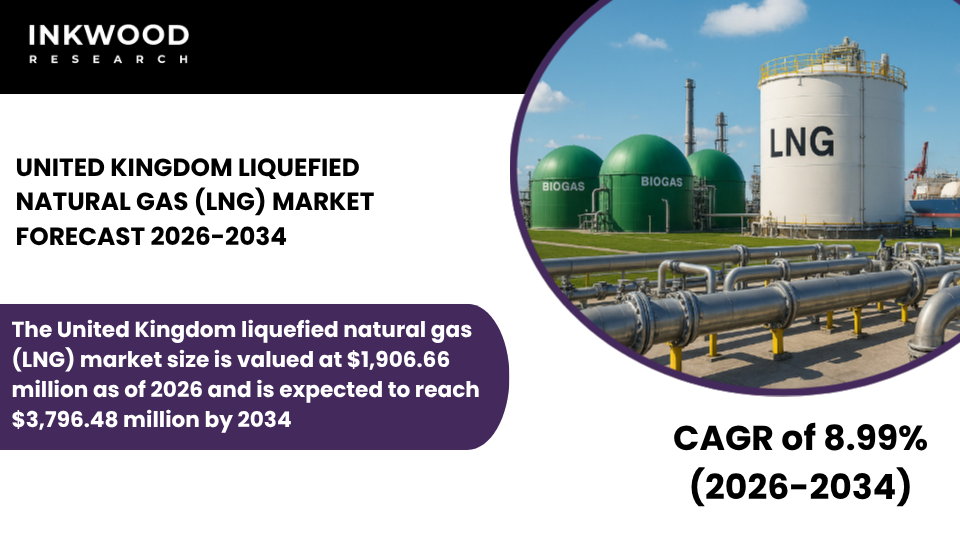
The United Kingdom liquefied natural gas (LNG) market size is valued at $1,906.66 million as of 2026 and is expected to reach $3,796.48 million by 2034, progressing with a CAGR of 8.99% during the forecast years, 2026-2034.
The United Kingdom’s liquefied natural gas landscape reflects the country’s evolving energy security challenges as declining North Sea production necessitates growing reliance on imported gas to meet domestic consumption requirements across residential, commercial, and industrial sectors. This fundamental shift transforms the UK from a historically self-sufficient gas producer into an increasingly import-dependent market that requires robust infrastructure and diversified supply relationships.
According to the Department for Energy Security and Net Zero, the government recognizes LNG imports as essential for maintaining energy security while the nation transitions toward renewable energy systems. Consequently, regasification terminals along the coast serve as critical entry points connecting the UK to global natural gas markets spanning the United States, Qatar, and other major producing regions.
Power generation represents the dominant application driving the United Kingdom’s liquefied natural gas consumption patterns, as gas-fired plants provide flexible capacity that balances intermittent renewable energy output from extensive wind and solar installations. These facilities deliver reliable electricity during periods when weather conditions reduce renewable generation, ensuring grid stability and preventing blackouts that would disrupt economic activity and daily life.
Furthermore, combined-cycle gas turbine technology achieves superior thermal efficiency compared to older coal plants, supporting the UK’s carbon reduction commitments while maintaining affordable electricity prices. The power sector’s sustained demand for natural gas creates predictable import requirements that underpin terminal operations and long-term supply agreements with international producers.
Residential and commercial heating applications constitute another significant consumption segment, particularly during winter months when space heating demands surge across the country’s housing stock and business facilities. The UK’s extensive gas distribution networks deliver imported LNG to millions of households that depend on natural gas for central heating, cooking, and hot water systems.
To Know More About This Report, Request a Free Sample Copy
Meanwhile, commercial establishments, including hospitals, schools, and office buildings, similarly rely on gas supplies to maintain comfortable environments and operational continuity. This widespread residential and commercial adoption creates seasonal demand patterns that influence import strategies and storage utilization throughout the year.
Industrial applications drive substantial liquefied natural gas consumption across the United Kingdom’s manufacturing and processing sectors, where companies utilize gas as both fuel power and essential process heat for production operations. Chemical plants, food processors, and materials manufacturers value natural gas for its clean combustion characteristics and precise temperature control capabilities.
Additionally, the petrochemical sector uses gas derivatives as feedstock for synthesizing plastics and specialty chemicals that serve domestic markets while supporting export activities. These industrial consumers typically secure gas supplies through wholesale contracts that provide price predictability and volume certainty essential for production planning.
The United Kingdom’s procurement strategy emphasizes supply diversification and contract flexibility to navigate volatile global liquefied natural gas markets effectively while managing price exposure and security risks. Energy companies increasingly participate in spot trading alongside traditional long-term agreements, enabling them to capitalize on favorable pricing opportunities when global supply conditions create temporary market advantages.
This balanced portfolio approach helps manage the price volatility that can significantly impact consumer energy bills and industrial competitiveness. Moreover, UK buyers actively engage with diverse suppliers across multiple continents to reduce dependence on any single source or transit route.
European energy security dynamics significantly influence the United Kingdom’s liquefied natural gas import patterns and infrastructure utilization, particularly following geopolitical events that disrupted traditional pipeline supplies to continental markets. Competition for cargoes intensifies during periods when European buyers simultaneously seek to rebuild storage inventories or respond to supply disruptions.
Consequently, UK importers must navigate competitive cargo markets where price premiums may emerge during peak demand seasons. Nevertheless, the country’s well-established regasification capacity and strategic location provide advantages for attracting cargoes when global supply conditions favor importers.
Transportation fuel applications remain relatively modest within the UK’s liquefied natural gas consumption landscape, though maritime bunkering opportunities are gradually developing at major port facilities serving international shipping routes. The maritime sector explores natural gas as a cleaner alternative to heavy fuel oil, driven by International Maritime Organization emission regulations and corporate sustainability commitments.
However, infrastructure availability and vessel conversion costs currently constrain broader adoption across the shipping industry. Similarly, heavy-duty trucking applications face challenges related to refueling network development and vehicle technology availability. These factors, in turn, are set to influence the liquefied natural gas market growth in the UK during the forecasted years.
The United Kingdom liquefied natural gas (LNG) market is segmented into LNG infrastructure, application, and mode of supply. The application segment is further categorized into transportation, industrial feedstock, power generation, and other applications.
Power generation thoroughly dominates the United Kingdom’s liquefied natural gas application landscape as the electricity sector depends fundamentally on flexible gas-fired capacity to maintain grid reliability during the nation’s aggressive renewable energy transition. Gas turbine plants provide essential backup generation when wind output declines during calm weather periods or when solar production falls short during winter months with limited daylight hours.
The sector’s operational strategy increasingly revolves around rapid response capabilities that enable plants to ramp production quickly when intermittent renewables cannot meet real-time electricity demand. Furthermore, gas-fired facilities offer superior efficiency compared to coal plants while producing substantially lower carbon emissions, positioning them as preferred transition assets until storage technologies and additional renewable capacity can provide equivalent reliability.
The electricity market’s dispatch mechanisms incentivize flexible generation that complements renewable output patterns, creating sustained economic value for gas-fired assets despite declining overall operating hours as renewable penetration increases.
Additionally, ongoing investments in plant efficiency upgrades and emission control technologies extend facility operating lives while improving environmental performance metrics that satisfy regulatory requirements and public expectations. Government energy policies explicitly recognize gas-fired generation as necessary for maintaining system security throughout the multi-decade transition toward net-zero emissions targets that guide national energy planning.
Some of the top players operating in the United Kingdom liquefied natural gas (LNG) market include National Grid, Shell, BP, and Centrica, etc.
National Grid operates as the UK’s primary electricity and gas transmission network operator, headquartered in London with responsibilities spanning high-voltage power lines, gas pipelines, and interconnector infrastructure linking the UK to continental Europe. The company manages critical natural gas transmission systems that transport regasified LNG from coastal terminals to distribution networks serving households, businesses, and power generators nationwide.
National Grid’s business model combines regulated network operations with system balancing services that ensure supply matches demand in real-time despite weather variations and consumption patterns. The company invests continuously in pipeline infrastructure, compression facilities, and storage assets that enhance network flexibility and resilience.
Furthermore, National Grid pursues hydrogen infrastructure development and carbon capture initiatives that position the gas network to support the UK’s energy transition beyond traditional natural gas applications, demonstrating a commitment to evolving alongside changing energy policy priorities.
REPORT SYNOPSIS
| REPORT SCOPE | DETAILS |
|---|---|
| Market Forecast Years | 2026-2034 |
| Base Year | 2025 |
| Market Historical Years | 2022-2024 |
| Forecast Units | Revenue ($ Million) |
| Segments Analyzed | LNG Infrastructure, Application, and Mode of Supply |
| Country Analyzed | The United Kingdom |
| Companies Analyzed | Shell, BP, Centrica, National Grid, Dragon LNG, South Hook LNG, Golar LNG |
TABLE OF CONTENTS
RESEARCH SCOPE & METHODOLOGY
- STUDY OBJECTIVES
- METHODOLOGY
- ASSUMPTIONS & LIMITATIONS
EXECUTIVE SUMMARY
- MARKET SIZE, SHARE & ESTIMATES
- MARKET OVERVIEW
- SCOPE OF STUDY
- CRISIS SCENARIO ANALYSIS
- MAJOR MARKET FINDINGS
- THE UNITED KINGDOM UTILIZES LNG IMPORTS TO BALANCE DECLINING NORTH SEA PRODUCTION
- LNG SUPPORTS ENERGY SECURITY AND DIVERSIFICATION IN THE NATIONAL GAS SUPPLY
- REGASIFICATION FACILITIES ENABLE ACCESS TO GLOBAL LNG MARKETS
- LNG SERVES AS A BRIDGE FUEL IN THE TRANSITION TO LOWER-CARBON ENERGY
MARKET DYNAMICS
- KEY DRIVERS
- REDUCED DOMESTIC PRODUCTION INCREASES RELIANCE ON IMPORTED LNG
- EUROPEAN MARKET DYNAMICS AND ENERGY SECURITY CONCERNS BOOST DEMAND
- FLEXIBLE INFRASTRUCTURE SUPPORTS RESPONSIVE IMPORT STRATEGIES
- POLICY EMPHASIS ON DIVERSIFIED SUPPLY ENHANCES LNG ROLE
- KEY RESTRAINTS
- ACCELERATED RENEWABLES AND ELECTRIFICATION MAY LIMIT LONG-TERM GROWTH
- COMPETITION FROM OTHER EUROPEAN IMPORTERS AFFECTS CARGO AVAILABILITY
- PRICE SENSITIVITY IMPACTS IMPORT VOLUMES DURING VOLATILE PERIODS
- INFRASTRUCTURE CONSTRAINTS CAP SOME POTENTIAL EXPANSION
- KEY DRIVERS
STRATEGIC MARKET ANALYTICS
- KEY MARKET TRENDS
- UNITED KINGDOM DIVERSIFIES LNG SUPPLY SOURCES FOR RESILIENCE
- INCREASING USE OF SPOT AND SHORT-TERM CONTRACTS FOR FLEXIBILITY
- INTEGRATION WITH HYDROGEN AND CARBON CAPTURE INITIATIVES EMERGES
- FOCUS ON ENERGY TRANSITION SUPPORTS SUSTAINABLE LNG UTILIZATION
- PORTER’S FIVE FORCES ANALYSIS
- BUYERS POWER
- SUPPLIERS POWER
- SUBSTITUTION
- NEW ENTRANTS
- INDUSTRY RIVALRY
- GROWTH PROSPECT MAPPING
- GROWTH PROSPECT MAPPING FOR THE UNITED KINGDOM
- MARKET MATURITY ANALYSIS
- MARKET CONCENTRATION ANALYSIS
- VALUE CHAIN ANALYSIS
- EXPLORATION AND EXTRACTION
- LIQUEFACTION AND PROCESSING
- STORAGE AND TRANSPORTATION
- EXPORT AND DISTRIBUTION
- MARKETING AND SALES
- AFTER-SALES SERVICES
- KEY BUYING CRITERIA
- PRICE COMPETITIVENESS
- SUPPLY RELIABILITY
- QUALITY STANDARDS
- CONTRACT FLEXIBILITY
- FUTURE PROSPECTS OF LNG IN THE UNITED KINGDOM
- TRADE
- EXPORTS
- IMPORTS
- LNG TERMINALS
- LIST OF LNG EXPORT TERMINALS
- REGULATORY FRAMEWORK AND COMPLIANCE BODIES
- KEY MARKET TRENDS
LIQUEFIED NATURAL GAS (LNG) MARKET BY LNG INFRASTRUCTURE
- LNG LIQUEFACTION PLANTS
- MARKET FORECAST FIGURE
- SEGMENT ANALYSIS
- LNG REGASIFICATION FACILITIES
- MARKET FORECAST FIGURE
- SEGMENT ANALYSIS
- LNG LIQUEFACTION PLANTS
LIQUEFIED NATURAL GAS (LNG) MARKET BY APPLICATION
- TRANSPORTATION
- MARKET FORECAST FIGURE
- SEGMENT ANALYSIS
- INDUSTRIAL FEEDSTOCK
- MARKET FORECAST FIGURE
- SEGMENT ANALYSIS
- POWER GENERATION
- MARKET FORECAST FIGURE
- SEGMENT ANALYSIS
- OTHER APPLICATIONS
- MARKET FORECAST FIGURE
- SEGMENT ANALYSIS
- TRANSPORTATION
LIQUEFIED NATURAL GAS (LNG) MARKET BY MODE OF SUPPLY
- TRUCK
- MARKET FORECAST FIGURE
- SEGMENT ANALYSIS
- TRANSSHIPMENT AND BUNKERING
- MARKET FORECAST FIGURE
- SEGMENT ANALYSIS
- PIPELINE AND RAIL
- MARKET FORECAST FIGURE
- SEGMENT ANALYSIS
- TRUCK
COMPETITIVE LANDSCAPE
- KEY STRATEGIC DEVELOPMENTS
- MERGERS & ACQUISITIONS
- PRODUCT LAUNCHES & DEVELOPMENTS
- PARTNERSHIPS & AGREEMENTS
- BUSINESS EXPANSIONS & DIVESTITURES
- COMPANY PROFILES
- SHELL
- COMPANY OVERVIEW
- PRODUCT LIST
- STRENGTHS & CHALLENGES
- BP
- COMPANY OVERVIEW
- PRODUCT LIST
- STRENGTHS & CHALLENGES
- CENTRICA
- COMPANY OVERVIEW
- PRODUCT LIST
- STRENGTHS & CHALLENGES
- NATIONAL GRID
- COMPANY OVERVIEW
- PRODUCT LIST
- STRENGTHS & CHALLENGES
- DRAGON LNG
- COMPANY OVERVIEW
- PRODUCT LIST
- STRENGTHS & CHALLENGES
- SOUTH HOOK LNG
- COMPANY OVERVIEW
- PRODUCT LIST
- STRENGTHS & CHALLENGES
- GOLAR LNG
- COMPANY OVERVIEW
- PRODUCT LIST
- STRENGTHS & CHALLENGES
- SHELL
- KEY STRATEGIC DEVELOPMENTS
LIST OF TABLES
TABLE 1: MARKET SNAPSHOT – LIQUEFIED NATURAL GAS (LNG)
TABLE 2: LIQUEFIED NATURAL GAS (LNG) MARKET REGULATORY FRAMEWORK
TABLE 3: UNITED KINGDOM NATURAL GAS PRODUCTION, 2022-2024 (IN EXAJOULES)
TABLE 4: UNITED KINGDOM NATURAL GAS CONSUMPTION, 2022-2024 (IN EXAJOULES)
TABLE 5: UNITED KINGDOM LNG EXPORTS, 2022-2024 (IN BILLION CUBIC METERS)
TABLE 6: UNITED KINGDOM LNG IMPORTS, 2022-2024 (IN BILLION CUBIC METERS)
TABLE 7: MARKET BY LNG INFRASTRUCTURE, HISTORICAL YEARS, 2022-2024 (IN $ MILLION)
TABLE 8: MARKET BY LNG INFRASTRUCTURE, FORECAST YEARS, 2026-2034 (IN $ MILLION)
TABLE 9: MARKET BY APPLICATION, HISTORICAL YEARS, 2022-2024 (IN $ MILLION)
TABLE 10: MARKET BY APPLICATION, FORECAST YEARS, 2026-2034 (IN $ MILLION)
TABLE 11: MARKET BY MODE OF SUPPLY, HISTORICAL YEARS, 2022-2024 (IN $ MILLION)
TABLE 12: MARKET BY MODE OF SUPPLY, FORECAST YEARS, 2026-2034 (IN $ MILLION)
TABLE 13: KEY PLAYERS OPERATING IN THE UNITED KINGDOM MARKET
TABLE 14: LIST OF MERGERS & ACQUISITIONS
TABLE 15: LIST OF PRODUCT LAUNCHES & DEVELOPMENTS
TABLE 16: LIST OF PARTNERSHIPS & AGREEMENTS
TABLE 17: LIST OF BUSINESS EXPANSIONS & DIVESTITURES
LIST OF FIGURES
FIGURE 1: KEY MARKET TRENDS
FIGURE 2: PORTER’S FIVE FORCES ANALYSIS
FIGURE 3: GROWTH PROSPECT MAPPING FOR THE UNITED KINGDOM
FIGURE 4: MARKET MATURITY ANALYSIS
FIGURE 5: MARKET CONCENTRATION ANALYSIS
FIGURE 6: VALUE CHAIN ANALYSIS
FIGURE 7: KEY BUYING CRITERIA
FIGURE 8: SEGMENT GROWTH POTENTIAL, BY LNG INFRASTRUCTURE, IN 2025
FIGURE 9: LNG LIQUEFACTION PLANTS MARKET SIZE, 2026-2034 (IN $ MILLION)
FIGURE 10: LNG REGASIFICATION FACILITIES MARKET SIZE, 2026-2034 (IN $ MILLION)
FIGURE 11: SEGMENT GROWTH POTENTIAL, BY APPLICATION, IN 2025
FIGURE 12: TRANSPORTATION MARKET SIZE, 2026-2034 (IN $ MILLION)
FIGURE 13: INDUSTRIAL FEEDSTOCK MARKET SIZE, 2026-2034 (IN $ MILLION)
FIGURE 14: POWER GENERATION MARKET SIZE, 2026-2034 (IN $ MILLION)
FIGURE 15: OTHER APPLICATIONS MARKET SIZE, 2026-2034 (IN $ MILLION)
FIGURE 16: SEGMENT GROWTH POTENTIAL, BY MODE OF SUPPLY, IN 2025
FIGURE 17: TRUCK MARKET SIZE, 2026-2034 (IN $ MILLION)
FIGURE 18: TRANSSHIPMENT AND BUNKERING MARKET SIZE, 2026-2034 (IN $ MILLION)
FIGURE 19: PIPELINE AND RAIL MARKET SIZE, 2026-2034 (IN $ MILLION)
FAQ’s
RELATED REPORTS
-

UNITED STATES AI-DRIVEN CLOUD MIGRATION SERVICES MARKET FORECAST 2026-2034
-

UNITED KINGDOM AI-DRIVEN CLOUD MIGRATION SERVICES MARKET FORECAST 2026-2034
-

UNITED ARAB EMIRATES AI-DRIVEN CLOUD MIGRATION SERVICES MARKET FORECAST 2026-2034
-

SOUTH KOREA AI-DRIVEN CLOUD MIGRATION SERVICES MARKET FORECAST 2026-2034
-

SINGAPORE AI-DRIVEN CLOUD MIGRATION SERVICES MARKET FORECAST 2026-2034
-

SAUDI ARABIA AI-DRIVEN CLOUD MIGRATION SERVICES MARKET FORECAST 2026-2034
-

AUSTRALIA AI-DRIVEN CLOUD MIGRATION SERVICES MARKET FORECAST 2026-2034
-

JAPAN AI-DRIVEN CLOUD MIGRATION SERVICES MARKET FORECAST 2026-2034
-

INDIA AI-DRIVEN CLOUD MIGRATION SERVICES MARKET FORECAST 2026-2034
-

CHINA AI-DRIVEN CLOUD MIGRATION SERVICES MARKET FORECAST 2026-2034