UNITED ARAB EMIRATES ETHNIC FOOD MARKET OVERVIEW
The United Arab Emirates ethnic food market size is valued at $877.96 million as of 2025 and is expected to reach $1647.42 million by 2032, progressing with a CAGR of 9.41% during the forecast years, 2025-2032.
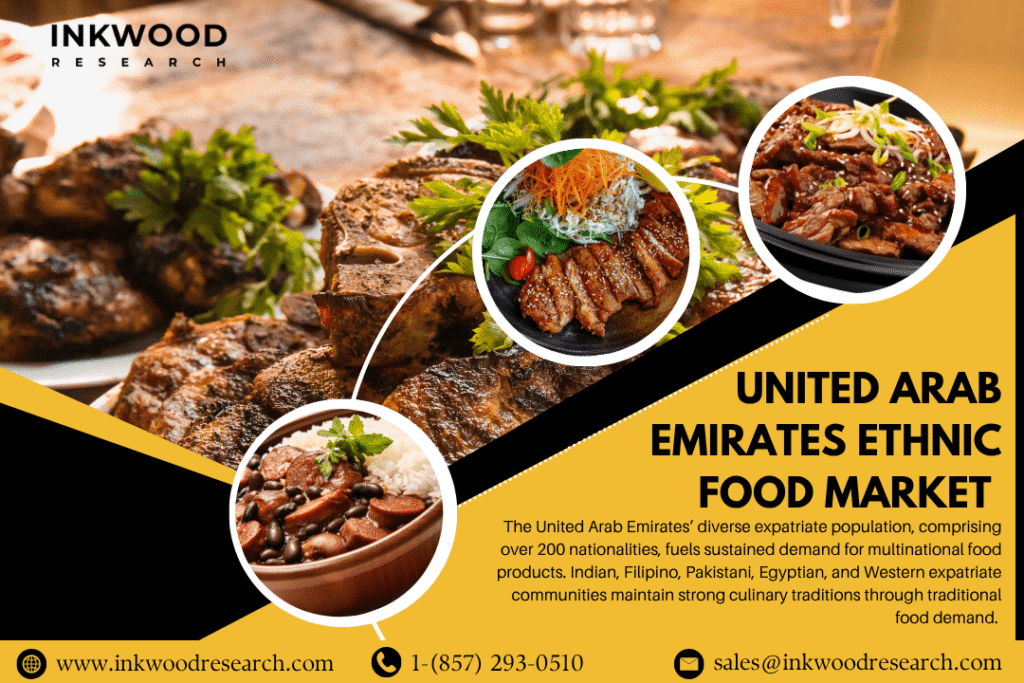
The United Arab Emirates’ diverse expatriate population, comprising over 200 nationalities, fuels sustained demand for multinational food products. Indian, Filipino, Pakistani, Egyptian, and Western expatriate communities maintain strong culinary traditions through traditional food demand. Moreover, the booming hospitality and tourism industry expands market opportunities as hotels and restaurants showcase international cuisine trends.
High disposable income among UAE residents encourages spending on premium gourmet ethnic meals and specialty food imports. Additionally, strong government support for food security and trade liberalization drives import growth through Dubai’s strategic port facilities. E-commerce platforms enable convenient access to authentic food recipes and ingredients from global suppliers. Furthermore, the UAE’s ethnic food market thrives on unparalleled cultural diversity and cosmopolitan consumer preferences across emirates.
Dubai, Abu Dhabi, and Sharjah feature concentrated expatriate neighborhoods maintaining distinct culinary identities through specialty food imports. Asian cuisines, particularly Indian, Filipino, Chinese, Thai, and Japanese, dominate ethnic food consumption, reflecting demographic composition. However, complete dependence on specialty food imports makes the market vulnerable to global supply chain disruptions. Geopolitical tensions, shipping delays, and port congestion significantly impact product availability and pricing stability. Hot climate conditions limit local agricultural production, increasing reliance on refrigerated storage and cold chain infrastructure. Consequently, storage costs for frozen ethnic meals and perishable products remain substantially higher than in temperate markets.
To Know More About This Report, Request a Free Sample Copy
Government regulations under the Emirates Authority for Standardization and Metrology (ESMA) ensure stringent quality and safety standards. All packaged ethnic foods must comply with comprehensive halal certification requirements verified by recognized Islamic authorities. The UAE’s halal food expansion mandates rigorous ingredient sourcing transparency and production process audits. Labeling requirements specify detailed nutritional information, halal certification logos, and Arabic language translations for imported products.
These regulations create entry barriers for international brands but simultaneously build consumer trust in certified packaged ethnic foods. High competition among international brands leads to market saturation, particularly in premium segments. Nevertheless, established retailers like Carrefour, Lulu Hypermarket, and Spinneys provide extensive distribution networks nationwide. Cultural dining habits also reflect cosmopolitan tastes with a strong preference for authentic food recipes from home countries.
Fusion food innovations blending Emirati, Arabic, and international flavors attract younger UAE nationals and long-term residents. Plant-based ethnic meals gain momentum as health-conscious consumers embrace wellness trends despite traditional meat-centric diets. Additionally, street food popularity from Asian and Middle Eastern countries influences quick-service restaurant concepts in malls and food courts.
Ramadan drives substantial festival food consumption peaks as households purchase traditional ingredients for iftar celebrations. Sustainable ethnic packaging appeals to environmentally conscious consumers, supporting the UAE’s sustainability initiatives. E-commerce platforms operated by Noon, Amazon.ae, and Instashop facilitate convenient delivery of specialty food imports. Moreover, international cuisine trends evolve rapidly as social media influencers showcase diverse restaurant ethnic menus and home cooking.
The United Arab Emirates ethnic food market is segmented into cuisine type, food type, product type, and distribution channel. The cuisine type segment is further categorized into Chinese, Japanese, Indian, Thai, Korean, Mexican, Brazilian, Lebanese, and other cuisine types.
Indian cuisine represents one of the largest ethnic food segments within the UAE, driven by the massive Indian expatriate population. Over three million Indian residents create sustained traditional food demand for authentic regional specialties from various Indian states. In this regard, North Indian curries, South Indian dosas and idlis, Punjabi breads, and Bengali sweets dominate retail and restaurant offerings. Specialty food imports include basmati rice, lentils, spices, chutneys, pickles, and ready-to-eat ethnic dishes. Further, major Indian food brands operate manufacturing facilities in Dubai’s food parks, supplying fresh products regionally.
Packaged ethnic foods featuring vegetarian options align perfectly with large Hindu and Jain communities, maintaining dietary restrictions. Accordingly, product variety spans from premium restaurant-quality gourmet ethnic meals to affordable everyday cooking ingredients and ready-to-eat ethnic dishes. Frozen ethnic meals include samosas, parathas, tandoori items, and complete curry sets requiring simple reheating. Health-conscious ethnic food variants featuring organic ingredients and reduced oil formulations attract wellness-focused consumers.
Plant-based ethnic meals using paneer, tofu, and legumes provide protein-rich alternatives to meat-based dishes. Moreover, festival food consumption spikes during Diwali, Holi, and other celebrations as families prepare traditional sweets and savories. Halal-certified Indian products accommodate Muslim consumers seeking authentic flavors meeting religious requirements. Regional specialization enables retailers to stock Bengali, Gujarati, Kerala, and Hyderabadi products, serving diverse Indian communities.
E-commerce platforms facilitate the delivery of fresh Indian groceries and ready-to-eat ethnic dishes across the Emirates efficiently. Subscription services provide weekly deliveries of authentic food recipe ingredients directly from Indian suppliers. Moreover, cloud kitchens specializing in regional Indian cuisines leverage packaged ethnic foods for consistent quality control. Consumer taste shifts toward premium, authentic experiences, driving demand for artisanal products from specific Indian regions. Consequently, the Indian cuisine segment offers substantial growth opportunities through demographic expansion, authentic product innovation, and omnichannel distribution strategies.
Some of the top players operating in the United Arab Emirates ethnic food market include Nestlé Middle East, Halwani Bros, Capital Foods Ltd, etc.
Halwani Bros operates as a leading Middle Eastern food and beverage company headquartered in Jeddah, Saudi Arabia, with significant operations throughout the GCC region. The company specializes in manufacturing and distributing Arabic sweets, tahini, halva, date products, honey, jams, and traditional Middle Eastern food products. Halwani Bros’ extensive product portfolio includes traditional tahini, premium halva varieties, date spreads, and authentic Arabic confectionery distributed across Gulf markets.
Within the UAE’s ethnic food market, Halwani Bros produces packaged ethnic foods, ready-to-eat ethnic dishes, traditional sweets, and specialty ingredients representing authentic Arabic culinary heritage. The company’s tahini and halva products capture substantial market share through widespread retail distribution in supermarkets and specialty stores. Moreover, Halwani Bros leverages decades of Middle Eastern culinary expertise to maintain authentic food recipes faithful to traditional preparation methods.
The firm operates modern production facilities throughout Saudi Arabia, enabling efficient regional distribution of packaged ethnic foods. Halwani Bros’ business model emphasizes halal certification, quality ingredients, and cultural authenticity aligned with GCC consumer values. Strategic partnerships with major UAE retailers, including Lulu, Carrefour, Union Coop, and Choithrams, ensure prominent shelf placement.
Furthermore, the company invests in sustainable ethnic packaging initiatives using recyclable materials, addressing regional environmental commitments. Halwani Bros’ commitment to traditional food demand resonates strongly with Emirati nationals and Arab expatriates seeking authentic heritage products. Also, the company actively develops organic ethnic food variants responding to growing health-conscious ethnic food preferences.
REPORT SYNOPSIS
| REPORT SCOPE | DETAILS |
|---|---|
| Market Forecast Years | 2025-2032 |
| Base Year | 2024 |
| Market Historical Years | 2018-2023 |
| Forecast Units | Revenue ($ Million) |
| Segments Analyzed | Cuisine Type, Food Type, Product Type, and Distribution Channel |
| Country Analyzed | United Arab emirates |
| Companies Analyzed | Nestlé SA, Halwani Bros, Tata Consumer Products, Capital Foods Ltd |
TABLE OF CONTENTS
RESEARCH SCOPE & METHODOLOGY
- STUDY OBJECTIVES
- METHODOLOGY
- ASSUMPTIONS & LIMITATIONS
EXECUTIVE SUMMARY
- MARKET SIZE & FORECAST
- MARKET OVERVIEW
- SCOPE OF STUDY
- CRISIS SCENARIO ANALYSIS
- MAJOR MARKET FINDINGS
- THE MARKET IS EXPERIENCING STRONG GROWTH DUE TO INCREASING CONSUMER INTEREST IN AUTHENTIC AND DIVERSE CUISINES
- RISING MIGRATION AND CULTURAL EXCHANGE ARE BROADENING THE CONSUMER BASE FOR MULTI-REGIONAL FOOD PRODUCTS
- PRE-PACKAGED AND READY-TO-EAT ETHNIC FOOD SEGMENTS ARE GAINING POPULARITY AMONG URBAN AND MILLENNIAL CONSUMERS
- LEADING BRANDS ARE INVESTING IN CLEAN LABEL INGREDIENTS AND HEALTHIER RECIPE VARIANTS TO APPEAL TO HEALTH-CONSCIOUS BUYERS
MARKET DYNAMICS
- KEY DRIVERS
- DIVERSE EXPATRIATE POPULATION FUELS DEMAND FOR MULTINATIONAL FOOD PRODUCTS
- BOOMING HOSPITALITY AND TOURISM INDUSTRY EXPANDS MARKET FOR ETHNIC CUISINES
- HIGH DISPOSABLE INCOME ENCOURAGES SPENDING ON PREMIUM IMPORTED FOODS
- STRONG GOVERNMENT SUPPORT FOR FOOD SECURITY AND TRADE LIBERALIZATION DRIVES IMPORT GROWTH
- KEY RESTRAINTS
- DEPENDENCE ON IMPORTS MAKES THE MARKET VULNERABLE TO GLOBAL SUPPLY CHAIN DISRUPTIONS
- HOT CLIMATE LIMITS LOCAL AGRICULTURAL PRODUCTION AND INCREASES STORAGE COSTS
- HIGH COMPETITION AMONG INTERNATIONAL BRANDS LEADS TO MARKET SATURATION
- STRINGENT HALAL AND FOOD SAFETY REGULATIONS REQUIRE ADDITIONAL CERTIFICATION AND COST
- KEY DRIVERS
KEY ANALYTICS
- KEY MARKET TRENDS
- INCREASING ADOPTION OF FUSION CUISINES BLENDING LOCAL AND GLOBAL FLAVORS
- GROWING DEMAND FOR PLANT-BASED AND VEGAN ETHNIC FOOD OPTIONS
- RISING POPULARITY OF ETHNIC STREET FOOD CONCEPTS IN QUICK-SERVICE RESTAURANTS
- INNOVATION IN PACKAGING AND PRESERVATION TO EXTEND SHELF LIFE AND QUALITY
- PORTER’S FIVE FORCES ANALYSIS
- BUYERS POWER
- SUPPLIERS POWER
- SUBSTITUTION
- NEW ENTRANTS
- INDUSTRY RIVALRY
- GROWTH PROSPECT MAPPING
- GROWTH PROSPECT MAPPING FOR NORTH AMERICA
- GROWTH PROSPECT MAPPING FOR EUROPE
- GROWTH PROSPECT MAPPING FOR ASIA-PACIFIC
- GROWTH PROSPECT MAPPING FOR REST OF WORLD
- MARKET MATURITY ANALYSIS
- MARKET CONCENTRATION ANALYSIS
- VALUE CHAIN ANALYSIS
- RAW MATERIAL SUPPLIERS
- INGREDIENT PROCESSORS
- FOOD MANUFACTURERS
- PACKAGING COMPANIES
- DISTRIBUTORS AND RETAILERS
- FOOD SERVICE OPERATORS
- END CONSUMER
- KEY BUYING CRITERIA
- TASTE AUTHENTICITY
- HEALTH AND NUTRITION
- PRICE AFFORDABILITY
- BRAND REPUTATION
- REGULATORY FRAMEWORK
- KEY MARKET TRENDS
ETHNIC FOOD MARKET BY CUISINE TYPE
- CHINESE
- MARKET FORECAST FIGURE
- SEGMENT ANALYSIS
- JAPANESE
- MARKET FORECAST FIGURE
- SEGMENT ANALYSIS
- INDIAN
- MARKET FORECAST FIGURE
- SEGMENT ANALYSIS
- THAI
- MARKET FORECAST FIGURE
- SEGMENT ANALYSIS
- KOREAN
- MARKET FORECAST FIGURE
- SEGMENT ANALYSIS
- MEXICAN
- MARKET FORECAST FIGURE
- SEGMENT ANALYSIS
- BRAZILIAN
- MARKET FORECAST FIGURE
- SEGMENT ANALYSIS
- LEBANESE
- MARKET FORECAST FIGURE
- SEGMENT ANALYSIS
- OTHER CUISINE TYPES
- MARKET FORECAST FIGURE
- SEGMENT ANALYSIS
- CHINESE
ETHNIC FOOD MARKET BY FOOD TYPE
- VEGETARIAN/VEGAN ETHNIC FOODS
- MARKET FORECAST FIGURE
- SEGMENT ANALYSIS
- NON-VEGETARIAN ETHNIC FOODS
- MARKET FORECAST FIGURE
- SEGMENT ANALYSIS
- VEGETARIAN/VEGAN ETHNIC FOODS
ETHNIC FOOD MARKET BY PRODUCT TYPE
- READY-TO-EAT MEALS
- MARKET FORECAST FIGURE
- SEGMENT ANALYSIS
- FROZEN FOOD
- MARKET FORECAST FIGURE
- SEGMENT ANALYSIS
- PACKAGED FOOD
- MARKET FORECAST FIGURE
- SEGMENT ANALYSIS
- CANNED FOOD
- MARKET FORECAST FIGURE
- SEGMENT ANALYSIS
- DRIED MEALS
- MARKET FORECAST FIGURE
- SEGMENT ANALYSIS
- OTHER PRODUCT TYPES
- MARKET FORECAST FIGURE
- SEGMENT ANALYSIS
- READY-TO-EAT MEALS
ETHNIC FOOD MARKET BY DISTRIBUTION CHANNEL
- SUPERMARKETS / HYPERMARKETS
- MARKET FORECAST FIGURE
- SEGMENT ANALYSIS
- CONVENIENCE / GROCERY STORES
- MARKET FORECAST FIGURE
- SEGMENT ANALYSIS
- SPECIALTY STORES
- MARKET FORECAST FIGURE
- SEGMENT ANALYSIS
- ONLINE RETAIL
- MARKET FORECAST FIGURE
- SEGMENT ANALYSIS
- OTHER DISTRIBUTION CHANNELS
- MARKET FORECAST FIGURE
- SEGMENT ANALYSIS
- SUPERMARKETS / HYPERMARKETS
COMPETITIVE LANDSCAPE
- KEY STRATEGIC DEVELOPMENTS
- MERGERS & ACQUISITIONS
- PRODUCT LAUNCHES & DEVELOPMENTS
- PARTNERSHIPS & AGREEMENTS
- BUSINESS EXPANSIONS & DIVESTITURES
- COMPANY PROFILES
- NESTLÉ SA
- COMPANY OVERVIEW
- PRODUCTS
- STRENGTHS & CHALLENGES
- HALWANI BROS
- COMPANY OVERVIEW
- PRODUCTS
- STRENGTHS & CHALLENGES
- TATA CONSUMER PRODUCTS
- COMPANY OVERVIEW
- PRODUCTS
- STRENGTHS & CHALLENGES
- CAPITAL FOODS LTD
- COMPANY OVERVIEW
- PRODUCTS
- STRENGTHS & CHALLENGES
- NESTLÉ SA
- KEY STRATEGIC DEVELOPMENTS
LIST OF TABLES
TABLE 1: MARKET SNAPSHOT – ETHNIC FOOD
TABLE 2: MARKET BY CUISINE TYPE, HISTORICAL YEARS, 2018-2023 (IN $ MILLION)
TABLE 3: MARKET BY CUISINE TYPE, FORECAST YEARS, 2025-2032 (IN $ MILLION)
TABLE 4: MARKET BY FOOD TYPE, HISTORICAL YEARS, 2018-2023 (IN $ MILLION)
TABLE 5: MARKET BY FOOD TYPE, FORECAST YEARS, 2025-2032 (IN $ MILLION)
TABLE 6: MARKET BY PRODUCT TYPE, HISTORICAL YEARS, 2018-2023 (IN $ MILLION)
TABLE 7: MARKET BY PRODUCT TYPE, FORECAST YEARS, 2025-2032 (IN $ MILLION)
TABLE 8: MARKET BY DISTRIBUTION CHANNEL, HISTORICAL YEARS, 2018-2023 (IN $ MILLION)
TABLE 9: MARKET BY DISTRIBUTION CHANNEL, FORECAST YEARS, 2025-2032 (IN $ MILLION)
TABLE 10: KEY PLAYERS OPERATING IN THE UNITED ARAB EMIRATES MARKET
TABLE 11: LIST OF MERGERS & ACQUISITIONS
TABLE 12: LIST OF PRODUCT LAUNCHES & DEVELOPMENTS
TABLE 13: LIST OF PARTNERSHIPS & AGREEMENTS
TABLE 14: LIST OF BUSINESS EXPANSIONS & DIVESTITURES
LIST OF FIGURES
TABLE 1: MARKET SNAPSHOT – ETHNIC FOOD
TABLE 2: MARKET BY CUISINE TYPE, HISTORICAL YEARS, 2018-2023 (IN $ MILLION)
TABLE 3: MARKET BY CUISINE TYPE, FORECAST YEARS, 2025-2032 (IN $ MILLION)
TABLE 4: MARKET BY FOOD TYPE, HISTORICAL YEARS, 2018-2023 (IN $ MILLION)
TABLE 5: MARKET BY FOOD TYPE, FORECAST YEARS, 2025-2032 (IN $ MILLION)
TABLE 6: MARKET BY PRODUCT TYPE, HISTORICAL YEARS, 2018-2023 (IN $ MILLION)
TABLE 7: MARKET BY PRODUCT TYPE, FORECAST YEARS, 2025-2032 (IN $ MILLION)
TABLE 8: MARKET BY DISTRIBUTION CHANNEL, HISTORICAL YEARS, 2018-2023 (IN $ MILLION)
TABLE 9: MARKET BY DISTRIBUTION CHANNEL, FORECAST YEARS, 2025-2032 (IN $ MILLION)
TABLE 10: KEY PLAYERS OPERATING IN THE UNITED ARAB EMIRATES MARKET
TABLE 11: LIST OF MERGERS & ACQUISITIONS
TABLE 12: LIST OF PRODUCT LAUNCHES & DEVELOPMENTS
TABLE 13: LIST OF PARTNERSHIPS & AGREEMENTS
TABLE 14: LIST OF BUSINESS EXPANSIONS & DIVESTITURES
FIGURE 21: SEGMENT GROWTH POTENTIAL, BY PRODUCT TYPE, IN 2024
FIGURE 22: READY-TO-EAT MEALS MARKET SIZE, 2025–2032 (IN $ MILLION)
FIGURE 23: FROZEN FOOD MARKET SIZE, 2025–2032 (IN $ MILLION)
FIGURE 24: PACKAGED FOOD MARKET SIZE, 2025–2032 (IN $ MILLION)
FIGURE 25: CANNED FOOD MARKET SIZE, 2025–2032 (IN $ MILLION)
FIGURE 26: DRIED MEALS MARKET SIZE, 2025–2032 (IN $ MILLION)
FIGURE 27: OTHER FOOD TYPES MARKET SIZE, 2025–2032 (IN $ MILLION)
FIGURE 28: SEGMENT GROWTH POTENTIAL, BY DISTRIBUTION CHANNEL, IN 2024
FIGURE 29: SUPERMARKETS / HYPERMARKETS MARKET SIZE, 2025–2032 (IN $ MILLION)
FIGURE 30: CONVENIENCE / GROCERY STORES MARKET SIZE, 2025–2032 (IN $ MILLION)
FIGURE 31: SPECIALTY STORES MARKET SIZE, 2025–2032 (IN $ MILLION)
FIGURE 32: ONLINE RETAIL MARKET SIZE, 2025–2032 (IN $ MILLION)
FIGURE 33: OTHER DISTRIBUTION CHANNELS MARKET SIZE, 2025–2032 (IN $ MILLION)
FAQ’s
RELATED REPORTS
-

UNITED STATES AI-DRIVEN CLOUD MIGRATION SERVICES MARKET FORECAST 2026-2034
-

UNITED KINGDOM AI-DRIVEN CLOUD MIGRATION SERVICES MARKET FORECAST 2026-2034
-

UNITED ARAB EMIRATES AI-DRIVEN CLOUD MIGRATION SERVICES MARKET FORECAST 2026-2034
-

SOUTH KOREA AI-DRIVEN CLOUD MIGRATION SERVICES MARKET FORECAST 2026-2034
-

SINGAPORE AI-DRIVEN CLOUD MIGRATION SERVICES MARKET FORECAST 2026-2034
-

SAUDI ARABIA AI-DRIVEN CLOUD MIGRATION SERVICES MARKET FORECAST 2026-2034
-

AUSTRALIA AI-DRIVEN CLOUD MIGRATION SERVICES MARKET FORECAST 2026-2034
-

JAPAN AI-DRIVEN CLOUD MIGRATION SERVICES MARKET FORECAST 2026-2034
-

INDIA AI-DRIVEN CLOUD MIGRATION SERVICES MARKET FORECAST 2026-2034
-

CHINA AI-DRIVEN CLOUD MIGRATION SERVICES MARKET FORECAST 2026-2034