Saudi Arabia Green Hydrogen Market by Technology (Alkaline Electrolyzer, Polymer Electrolyte Membrane (PEM) Electrolyzer, SOEC Electrolyzer), Market by Application (Power Generation, Transport, Other Applications), Market by Distribution Channel (Pipeline, Cargo), by Geography
SAUDI ARABIA GREEN HYDROGEN MARKET OVERVIEW
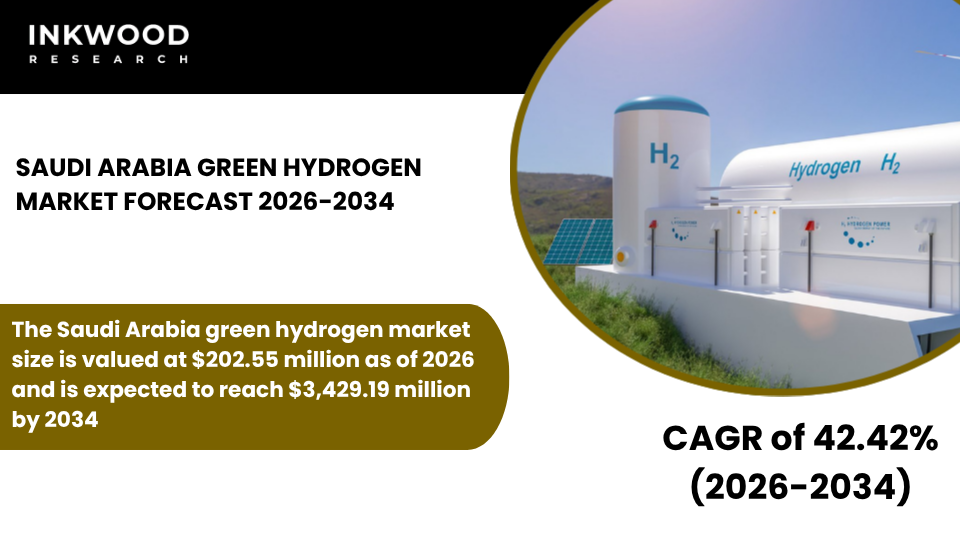
The Saudi Arabia green hydrogen market size is valued at $202.55 million as of 2026 and is expected to reach $3,429.19 million by 2034, progressing with a CAGR of 42.42% during the forecast years, 2026-2034.
Saudi Arabia’s green hydrogen market is fundamentally shaped by Vision 2030, the kingdom’s comprehensive economic diversification strategy that positions hydrogen as a central pillar of future energy exports. This national framework provides clear policy direction, substantial financial backing, and institutional coordination essential for large-scale project development.
Moreover, the government has established dedicated entities to oversee hydrogen strategy implementation and facilitate international partnerships. The Saudi Green Initiative targets achieving net-zero emissions by 2060 while maintaining the kingdom’s position as a global energy leader through clean fuel exports. Furthermore, regulatory frameworks are being developed to streamline project approvals, land allocation, and infrastructure development for hydrogen production facilities.
These coordinated efforts create an enabling environment that attracts significant foreign direct investment and technology partnerships. Consequently, Vision 2030’s strategic emphasis accelerates market maturation and positions Saudi Arabia as a potential global hydrogen powerhouse. Access to exceptionally low-cost renewable energy resources provides Saudi Arabia with fundamental competitive advantages for green hydrogen production economics. The kingdom benefits from world-class solar irradiation levels exceeding 2,500 kWh per square meter annually in optimal locations.
Additionally, coastal regions demonstrate strong wind energy potential that enables hybrid renewable installations, ensuring a consistent power supply for continuous electrolyzer operations. According to the King Abdullah City for Atomic and Renewable Energy (KACARE), renewable electricity costs in Saudi Arabia are among the lowest globally, with solar reaching below $0.015 per kWh in recent auctions. This remarkable cost structure directly translates into competitive levelized hydrogen production costs that challenge conventional fossil-based alternatives.
Moreover, abundant available land in remote desert regions eliminates spatial constraints that limit renewable development in densely populated countries. These natural resource endowments enable large-scale renewable installations supporting gigawatt-scale electrolysis facilities essential for export-oriented business models.
Strong demand from Asia and Europe for green ammonia exports creates a substantial market pull that justifies mega-project investments in Saudi Arabia. European nations, particularly Germany and the Netherlands, are actively seeking long-term import partnerships to meet domestic hydrogen requirements exceeding their renewable production capacity.
To Know More About This Report, Request a Free Sample Copy
Similarly, Asian markets, including Japan and South Korea, have established hydrogen strategies dependent on international supply chains. Furthermore, green ammonia serves as an efficient hydrogen carrier for maritime transport, enabling Saudi Arabia to leverage its established energy export infrastructure and expertise.
The kingdom’s strategic geographic position provides equitable access to both European and Asian demand centers through established shipping routes. Additionally, existing port infrastructure in Jeddah and Dammam can be adapted for ammonia export operations with incremental investment. Therefore, confirmed export demand provides revenue certainty that supports project bankability and accelerates development timelines.
Financial strength and sovereign backing significantly reduce project financing risks that otherwise constrain green hydrogen developments globally. Saudi Arabia’s substantial fiscal resources enable direct government investment in foundational infrastructure, including renewable generation capacity, transmission networks, and export facilities.
Moreover, sovereign wealth funds can provide patient capital with longer investment horizons than commercial financiers typically accept for emerging technology projects. This financial capacity allows the kingdom to absorb early-stage market risks and technology uncertainties that deter private sector investors in less capitalized markets.
Furthermore, government participation in joint ventures signals a commitment that attracts international technology providers and industrial partners. The Public Investment Fund has committed billions toward green hydrogen initiatives, demonstrating serious intent beyond policy statements. Subsequently, strong financial backing accelerates project execution while reducing capital costs through government guarantees and creditworthiness.
Mega projects such as NEOM are establishing unprecedented scale benchmarks that transform global perceptions of feasible green hydrogen production capacities. The NEOM Green Hydrogen Project, developed by ACWA Power in partnership with Air Products and NEOM, targets 650 tons daily production capacity when operational.
This facility will integrate 4 GW of renewable energy with advanced electrolysis systems to produce green ammonia for international export markets. Moreover, the project’s scale enables manufacturing cost reductions through economies of scale that improve overall competitiveness.
Such flagship developments demonstrate Saudi Arabia’s commitment to becoming a leading green hydrogen exporter while attracting additional investment in supporting industries. Furthermore, NEOM’s success will establish operational precedents, supply chain networks, and skilled workforce development that benefit subsequent projects. Therefore, these landmark initiatives accelerate overall market maturation and establish Saudi Arabia’s credibility as a reliable long-term hydrogen supplier.
The Saudi Arabia green hydrogen market is segmented into technology, application, and distribution channel. The distribution channel segment is further categorized into pipeline and cargo.
Cargo-based distribution dominates Saudi Arabia’s green hydrogen market due to the kingdom’s strategic focus on international export rather than domestic consumption. This segment encompasses hydrogen transportation via specialized shipping vessels, typically after conversion to green ammonia or other hydrogen carriers that facilitate maritime logistics.
Green ammonia enables economical long-distance transport because it liquefies at moderate pressures and ambient temperatures, eliminating the cryogenic requirements that complicate pure hydrogen shipping. Saudi Arabia’s extensive experience in energy product exports, particularly liquefied natural gas and petroleum products, provides established operational expertise and infrastructure that translates readily to ammonia handling.
Furthermore, major planned projects are being developed specifically with export operations in mind, incorporating ammonia synthesis facilities and marine terminals within integrated production complexes. The kingdom’s strategic location provides comparable shipping distances to both European and Asian demand centers, maximizing market optionality.
According to the Saudi Ports Authority, port infrastructure investments are specifically targeting ammonia handling capabilities to support projected export volumes. Moreover, cargo-based distribution eliminates the need for extensive domestic pipeline networks that would require decades and substantial capital to develop. This approach enables rapid market entry by leveraging existing maritime logistics networks and established trade relationships with importing nations.
Some of the top players operating in the Saudi Arabia green hydrogen market include ACWA Power, Air Products and Chemicals Inc, Siemens Energy, and TotalEnergies.
ACWA Power operates as a leading Saudi Arabian power generation and desalinated water production company with an expanding focus on green hydrogen development. The company specializes in developing, investing in, and operating power generation and desalination plants across multiple countries throughout the Middle East, Africa, and Asia.
ACWA Power’s product portfolio includes renewable energy projects featuring solar photovoltaic installations, concentrated solar power facilities, wind farms, and increasingly, green hydrogen production complexes. Moreover, the company is the lead developer for the NEOM Green Hydrogen Project, positioning it at the forefront of Saudi Arabia’s hydrogen ambitions. ACWA Power maintains its headquarters in Riyadh, Saudi Arabia, while operating approximately 80 assets across 13 countries with a combined capacity exceeding 45 GW.
The company’s business model emphasizes build-own-operate arrangements with long-term power purchase agreements that provide stable revenue streams. Furthermore, ACWA Power leverages strong relationships with Saudi sovereign entities, international technology partners, and multilateral development banks to structure complex project financing arrangements supporting large-scale developments.
REPORT SYNOPSIS
| REPORT SCOPE | DETAILS |
|---|---|
| Market Forecast Years | 2026-2034 |
| Base Year | 2025 |
| Market Historical Years | 2022-2024 |
| Forecast Units | Revenue ($ Million) |
| Segments Analyzed | Technology, Application, and Distribution Channel |
| Country Analyzed | Saudi Arabia |
| Companies Analyzed | ACWA Power, Air Liquide, Air Products and Chemicals Inc, ENGIE, Linde PLC, Siemens Energy, TotalEnergies |
TABLE OF CONTENTS
RESEARCH SCOPE & METHODOLOGY
- STUDY OBJECTIVES
- METHODOLOGY
- ASSUMPTIONS & LIMITATIONS
EXECUTIVE SUMMARY
- MARKET SIZE & FORECAST
- MARKET OVERVIEW
- SCOPE OF STUDY
- CRISIS SCENARIO ANALYSIS
- MAJOR MARKET FINDINGS
- SAUDI ARABIA IS FOCUSING ON EXPORT-ORIENTED GREEN HYDROGEN AND GREEN AMMONIA PRODUCTION
- MEGA PROJECTS SUCH AS NEOM ARE SETTING THE SCALE FOR GLOBAL BENCHMARK DEVELOPMENTS
- ABUNDANT SOLAR AND WIND RESOURCES ENABLE LOW-COST RENEWABLE POWER GENERATION
- THE MARKET IS STRONGLY STATE-LED WITH STRATEGIC INTERNATIONAL PARTNERSHIPS
MARKET DYNAMICS
- KEY DRIVERS
- VISION 2030 TARGETS SUPPORT ENERGY DIVERSIFICATION AND HYDROGEN INVESTMENTS
- ACCESS TO LOW-COST RENEWABLE ENERGY IMPROVES LONG-TERM COST COMPETITIVENESS
- STRONG DEMAND FROM ASIA AND EUROPE FOR GREEN AMMONIA EXPORTS
- FINANCIAL STRENGTH AND SOVEREIGN BACKING REDUCE PROJECT FINANCING RISKS
- KEY RESTRAINTS
- DOMESTIC HYDROGEN DEMAND IS STILL LIMITED COMPARED TO EXPORT ASPIRATIONS
- WATER DESALINATION REQUIREMENTS ADD TO PROJECT COSTS AND COMPLEXITY
- TECHNOLOGY AND SUPPLY CHAIN DEPENDENCE ON IMPORTS REMAINS HIGH
- GLOBAL MARKET PRICE UNCERTAINTY AFFECTS LONG-TERM EXPORT CONTRACTING
- KEY DRIVERS
KEY ANALYTICS
- KEY MARKET TRENDS
- GREEN AMMONIA IS EMERGING AS THE PRIMARY HYDROGEN CARRIER
- LARGE-SCALE INTEGRATED RENEWABLE TO HYDROGEN PROJECTS ARE DOMINANT
- INTERNATIONAL JOINT VENTURES WITH TECHNOLOGY PROVIDERS ARE INCREASING
- FOCUS ON LONG-TERM OFFTAKE AGREEMENTS WITH FOREIGN UTILITIES IS STRENGTHENING
- PORTER’S FIVE FORCES ANALYSIS
- BUYERS POWER
- SUPPLIERS POWER
- SUBSTITUTION
- NEW ENTRANTS
- INDUSTRY RIVALRY
- GROWTH PROSPECT MAPPING
- GROWTH PROSPECT MAPPING FOR SAUDI ARABIA
- MARKET MATURITY ANALYSIS
- MARKET CONCENTRATION ANALYSIS
- VALUE CHAIN ANALYSIS
- RENEWABLE POWER GENERATION
- ELECTROLYZER MANUFACTURING
- HYDROGEN PRODUCTION
- COMPRESSION AND STORAGE
- TRANSPORT AND LOGISTICS
- END USE APPLICATIONS
- KEY BUYING CRITERIA
- LEVELIZED HYDROGEN COST
- SUPPLY RELIABILITY
- TECHNOLOGY EFFICIENCY
- POLICY INCENTIVE ACCESS
- REGULATORY FRAMEWORK
- KEY MARKET TRENDS
GREEN HYDROGEN MARKET BY TECHNOLOGY
- ALKALINE ELECTROLYZER
- MARKET FORECAST FIGURE
- SEGMENT ANALYSIS
- POLYMER ELECTROLYTE MEMBRANE (PEM) ELECTROLYZER
- MARKET FORECAST FIGURE
- SEGMENT ANALYSIS
- SOEC ELECTROLYZER
- MARKET FORECAST FIGURE
- SEGMENT ANALYSIS
- ALKALINE ELECTROLYZER
GREEN HYDROGEN MARKET BY APPLICATION
- POWER GENERATION
- MARKET FORECAST FIGURE
- SEGMENT ANALYSIS
- TRANSPORT
- MARKET FORECAST FIGURE
- SEGMENT ANALYSIS
- OTHER APPLICATIONS
- MARKET FORECAST FIGURE
- SEGMENT ANALYSIS
- POWER GENERATION
GREEN HYDROGEN MARKET BY DISTRIBUTION CHANNEL
- PIPELINE
- MARKET FORECAST FIGURE
- SEGMENT ANALYSIS
- CARGO
- MARKET FORECAST FIGURE
- SEGMENT ANALYSIS
- PIPELINE
COUNTRY ANALYSIS
- SAUDI ARABIA
- SAUDI ARABIA ENERGY PROFILE
- IMPORTANT INSTITUTIONS & POLICIES FOR THE ENERGY SECTOR IN SAUDI ARABIA
- SAUDI ARABIA GREEN HYDROGEN INDUSTRY: OVERVIEW
- GREEN HYDROGEN PROJECTS IN SAUDI ARABIA
- SAUDI ARABIA
COMPETITIVE LANDSCAPE
- KEY STRATEGIC DEVELOPMENTS
- MERGERS & ACQUISITIONS
- PRODUCT LAUNCHES & DEVELOPMENTS
- PARTNERSHIPS & AGREEMENTS
- BUSINESS EXPANSIONS & DIVESTITURES
- COMPANY PROFILES
- ACWA POWER
- COMPANY OVERVIEW
- PRODUCT LIST
- STRENGTHS & CHALLENGES
- AIR LIQUIDE
- COMPANY OVERVIEW
- PRODUCT LIST
- STRENGTHS & CHALLENGES
- AIR PRODUCTS AND CHEMICALS INC
- COMPANY OVERVIEW
- PRODUCT LIST
- STRENGTHS & CHALLENGES
- ENGIE
- COMPANY OVERVIEW
- PRODUCT LIST
- STRENGTHS & CHALLENGES
- LINDE PLC
- COMPANY OVERVIEW
- PRODUCT LIST
- STRENGTHS & CHALLENGES
- SIEMENS ENERGY
- COMPANY OVERVIEW
- PRODUCT LIST
- STRENGTHS & CHALLENGES
- TOTAL
- COMPANY OVERVIEW
- PRODUCT LIST
- STRENGTHS & CHALLENGES
- ACWA POWER
- KEY STRATEGIC DEVELOPMENTS
LIST OF TABLES
TABLE 1: MARKET SNAPSHOT – GREEN HYDROGEN
TABLE 2: GREEN HYDROGEN MARKET REGULATORY FRAMEWORK
TABLE 3: MARKET BY TECHNOLOGY, HISTORICAL YEARS, 2022-2024 (IN $ MILLION)
TABLE 4: MARKET BY TECHNOLOGY, FORECAST YEARS, 2026-2034 (IN $ MILLION)
TABLE 5: MARKET BY TECHNOLOGY, HISTORICAL YEARS, 2022-2024 (IN KILOTONS)
TABLE 6: MARKET BY TECHNOLOGY, FORECAST YEARS, 2026-2034 (IN KILOTONS)
TABLE 7: ALKALINE ELECTROLYZER MARKET, HISTORICAL YEARS, 2022-2024 (IN $ MILLION)
TABLE 8: ALKALINE ELECTROLYZER MARKET, FORECAST YEARS, 2026-2034 (IN $ MILLION)
TABLE 9: ALKALINE ELECTROLYZER MARKET, HISTORICAL YEARS, 2022-2024 (IN KILOTONS)
TABLE 10: ALKALINE ELECTROLYZER MARKET, FORECAST YEARS, 2026-2034 (IN KILOTONS)
TABLE 11: POLYMER ELECTROLYTE MEMBRANE (PEM) ELECTROLYZER MARKET, HISTORICAL YEARS, 2022-2024 (IN $ MILLION)
TABLE 12: POLYMER ELECTROLYTE MEMBRANE (PEM) ELECTROLYZER MARKET, FORECAST YEARS, 2026-2034 (IN $ MILLION)
TABLE 13: POLYMER ELECTROLYTE MEMBRANE (PEM) ELECTROLYZER MARKET, HISTORICAL YEARS, 2022-2024 (IN KILOTONS)
TABLE 14: POLYMER ELECTROLYTE MEMBRANE (PEM) ELECTROLYZER MARKET, FORECAST YEARS, 2026-2034 (IN KILOTONS)
TABLE 15: SOEC ELECTROLYZER MARKET, HISTORICAL YEARS, 2022-2024 (IN $ MILLION)
TABLE 16: SOEC ELECTROLYZER MARKET, FORECAST YEARS, 2026-2034 (IN $ MILLION)
TABLE 17: SOEC ELECTROLYZER MARKET, HISTORICAL YEARS, 2022-2024 (IN KILOTONS)
TABLE 18: SOEC ELECTROLYZER MARKET, FORECAST YEARS, 2026-2034 (IN KILOTONS)
TABLE 19: MARKET BY APPLICATION, HISTORICAL YEARS, 2022-2024 (IN $ MILLION)
TABLE 20: MARKET BY APPLICATION, FORECAST YEARS, 2026-2034 (IN $ MILLION)
TABLE 21: MARKET BY APPLICATION, HISTORICAL YEARS, 2022-2024 (IN KILOTONS)
TABLE 22: MARKET BY APPLICATION, FORECAST YEARS, 2026-2034 (IN KILOTONS)
TABLE 23: POWER GENERATION MARKET, HISTORICAL YEARS, 2022-2024 (IN $ MILLION)
TABLE 24: POWER GENERATION MARKET, FORECAST YEARS, 2026-2034 (IN $ MILLION)
TABLE 25: POWER GENERATION MARKET, HISTORICAL YEARS, 2022-2024 (IN KILOTONS)
TABLE 26: POWER GENERATION MARKET, FORECAST YEARS, 2026-2034 (IN KILOTONS)
TABLE 27: TRANSPORT MARKET, HISTORICAL YEARS, 2022-2024 (IN $ MILLION)
TABLE 28: TRANSPORT MARKET, FORECAST YEARS, 2026-2034 (IN $ MILLION)
TABLE 29: TRANSPORT MARKET, HISTORICAL YEARS, 2022-2024 (IN KILOTONS)
TABLE 30: TRANSPORT MARKET, FORECAST YEARS, 2026-2034 (IN KILOTONS)
TABLE 31: OTHER APPLICATIONS MARKET, HISTORICAL YEARS, 2022-2024 (IN $ MILLION)
TABLE 32: OTHER APPLICATIONS MARKET, FORECAST YEARS, 2026-2034 (IN $ MILLION)
TABLE 33: OTHER APPLICATIONS MARKET, HISTORICAL YEARS, 2022-2024 (IN KILOTONS)
TABLE 34: OTHER APPLICATIONS MARKET, FORECAST YEARS, 2026-2034 (IN KILOTONS)
TABLE 35: MARKET BY DISTRIBUTION CHANNEL, HISTORICAL YEARS, 2022-2024 (IN $ MILLION)
TABLE 36: MARKET BY DISTRIBUTION CHANNEL, FORECAST YEARS, 2026-2034 (IN $ MILLION)
TABLE 37: MARKET BY DISTRIBUTION CHANNEL, HISTORICAL YEARS, 2022-2024 (IN KILOTONS)
TABLE 38: MARKET BY DISTRIBUTION CHANNEL, FORECAST YEARS, 2026-2034 (IN KILOTONS)
TABLE 39: PIPELINE MARKET, HISTORICAL YEARS, 2022-2024 (IN $ MILLION)
TABLE 40: PIPELINE MARKET, FORECAST YEARS, 2026-2034 (IN $ MILLION)
TABLE 41: PIPELINE MARKET, HISTORICAL YEARS, 2022-2024 (IN KILOTONS)
TABLE 42: PIPELINE MARKET, FORECAST YEARS, 2026-2034 (IN KILOTONS)
TABLE 43: CARGO MARKET, HISTORICAL YEARS, 2022-2024 (IN $ MILLION)
TABLE 44: CARGO MARKET, FORECAST YEARS, 2026-2034 (IN $ MILLION)
TABLE 45: CARGO MARKET, HISTORICAL YEARS, 2022-2024 (IN KILOTONS)
TABLE 46: CARGO MARKET, FORECAST YEARS, 2026-2034 (IN KILOTONS)
TABLE 47: KEY PLAYERS OPERATING IN THE SAUDI ARABIAN MARKET
TABLE 48: LIST OF MERGERS & ACQUISITIONS
TABLE 49: LIST OF PRODUCT LAUNCHES & DEVELOPMENTS
TABLE 50: LIST OF PARTNERSHIPS & AGREEMENTS
TABLE 51: LIST OF BUSINESS EXPANSIONS & DIVESTITURES
LIST OF FIGURES
FIGURE 1: KEY MARKET TRENDS
FIGURE 2: PORTER’S FIVE FORCES ANALYSIS
FIGURE 3: GROWTH PROSPECT MAPPING FOR SAUDI ARABIA
FIGURE 4: MARKET MATURITY ANALYSIS
FIGURE 5: MARKET CONCENTRATION ANALYSIS
FIGURE 6: VALUE CHAIN ANALYSIS
FIGURE 7: KEY BUYING CRITERIA
FIGURE 8: SEGMENT GROWTH POTENTIAL, BY TECHNOLOGY, IN 2025
FIGURE 9: ALKALINE ELECTROLYZER MARKET SIZE, 2026-2034 (IN $ MILLION)
FIGURE 10: POLYMER ELECTROLYTE MEMBRANE (PEM) ELECTROLYZER MARKET SIZE, 2026-2034 (IN $ MILLION)
FIGURE 11: SOEC ELECTROLYZER MARKET SIZE, 2026-2034 (IN $ MILLION)
FIGURE 12: SEGMENT GROWTH POTENTIAL, BY APPLICATION, IN 2025
FIGURE 13: POWER GENERATION MARKET SIZE, 2026-2034 (IN $ MILLION)
FIGURE 14: TRANSPORT MARKET SIZE, 2026-2034 (IN $ MILLION)
FIGURE 15: OTHER APPLICATIONS MARKET SIZE, 2026-2034 (IN $ MILLION)
FIGURE 16: SEGMENT GROWTH POTENTIAL, BY DISTRIBUTION CHANNEL, IN 2025
FIGURE 17: PIPELINE MARKET SIZE, 2026-2034 (IN $ MILLION)
FIGURE 18: CARGO MARKET SIZE, 2026-2034 (IN $ MILLION)
FIGURE 19: SAUDI ARABIA GREEN HYDROGEN MARKET, COUNTRY OUTLOOK, 2025 & 2034 (IN %)
FAQ’s
RELATED REPORTS
-
UNITED STATES AI-DRIVEN CLOUD MIGRATION SERVICES MARKET FORECAST 2026-2034
-
UNITED KINGDOM AI-DRIVEN CLOUD MIGRATION SERVICES MARKET FORECAST 2026-2034
-
UNITED ARAB EMIRATES AI-DRIVEN CLOUD MIGRATION SERVICES MARKET FORECAST 2026-2034
-
SOUTH KOREA AI-DRIVEN CLOUD MIGRATION SERVICES MARKET FORECAST 2026-2034
-

SINGAPORE AI-DRIVEN CLOUD MIGRATION SERVICES MARKET FORECAST 2026-2034
-
SAUDI ARABIA AI-DRIVEN CLOUD MIGRATION SERVICES MARKET FORECAST 2026-2034
-

AUSTRALIA AI-DRIVEN CLOUD MIGRATION SERVICES MARKET FORECAST 2026-2034
-
JAPAN AI-DRIVEN CLOUD MIGRATION SERVICES MARKET FORECAST 2026-2034
-
INDIA AI-DRIVEN CLOUD MIGRATION SERVICES MARKET FORECAST 2026-2034
-
CHINA AI-DRIVEN CLOUD MIGRATION SERVICES MARKET FORECAST 2026-2034