
CHINA LIQUEFIED NATURAL GAS (LNG) MARKET FORECAST 2026-2034
SCOPE OF THE REPORT
China Liquefied Natural Gas (LNG) Market by LNG Infrastructure (LNG Liquefaction Plants, LNG Regasification Facilities, LNG Shipping & Transportation) Market by Application (Transportation, Industrial Feedstock, Power Generation, Other Applications) Market by Mode of Supply (Truck, Transshipment and Bunkering, Pipeline and Rail)
REPORTS » REGIONAL REPORTS » COUNTRY » CHINA LIQUEFIED NATURAL GAS (LNG) MARKET FORECAST 2026-2034
CHINA LIQUEFIED NATURAL GAS (LNG) MARKET OVERVIEW
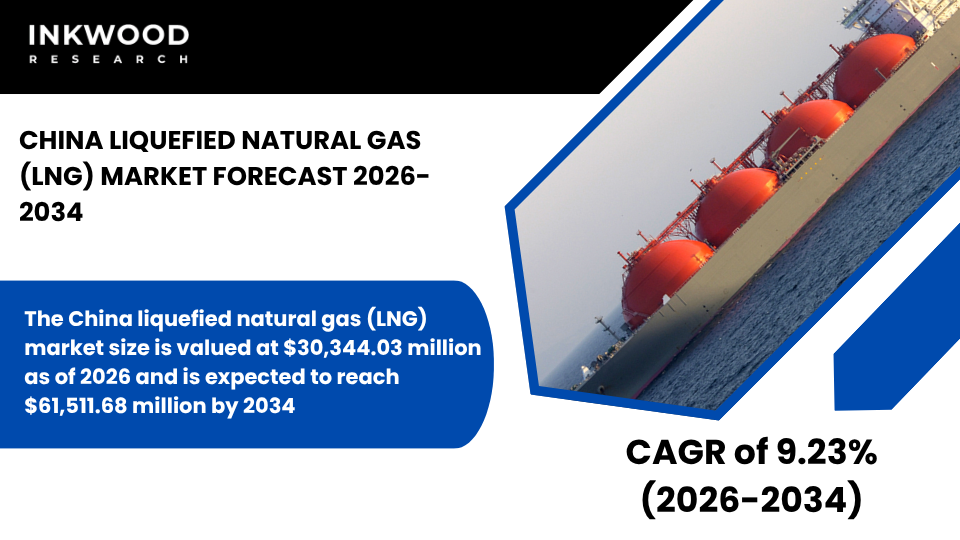
The China liquefied natural gas (LNG) market size is valued at $30,344.03 million as of 2026 and is expected to reach $61,511.68 million by 2034, progressing with a CAGR of 9.23% during the forecast years, 2026-2034.
Rapid industrialization drives substantial growth in China’s liquefied natural gas market. Manufacturing sectors are increasingly switching from coal to natural gas for cleaner energy operations. Moreover, government policies actively promote this transition through favorable regulations and financial incentives.
According to the research, industrial output continues to expand, creating sustained demand for reliable energy sources. Urban air quality improvement initiatives further accelerate adoption across major cities. Consequently, liquefied natural gas serves as a bridge fuel during the nation’s shift toward renewable energy. The country’s commitment to carbon neutrality targets reinforces this strategic positioning.
China maintains its position as the world’s largest liquefied natural gas importer through extensive infrastructure development. Coastal regasification terminals span from northern ports to southern facilities, enabling efficient distribution nationwide. The National Energy Administration oversees strategic planning for natural gas infrastructure expansion. These terminals connect to comprehensive pipeline networks that deliver gas to industrial zones and power generation plants.
Furthermore, storage facilities ensure supply stability during peak demand periods and price fluctuations. Domestic production from conventional and unconventional sources supplements imported volumes. However, growing consumption consistently outpaces local supply capabilities, necessitating continued imports.
Strategic diversification characterizes China’s approach to liquefied natural gas procurement. Long-term contracts with suppliers across Australia, Qatar, and the United States provide baseline security. Additionally, participation in spot markets offers flexibility to capitalize on favorable pricing opportunities. This dual strategy balances cost management with supply reliability for the natural gas market.
To Know More About This Report, Request a Free Sample Copy
Furthermore, energy companies actively negotiate contracts that include destination flexibility clauses. Such arrangements optimize cargo routing based on regional demand patterns and seasonal variations. Meanwhile, the development of domestic liquefaction capacity supports limited coastal redistribution requirements.
Industrial feedstock applications represent a significant consumption category within China’s energy landscape. Chemical manufacturers depend heavily on natural gas as both fuel and raw material for production processes. Fertilizer plants, in particular, utilize substantial volumes for ammonia synthesis operations.
Moreover, the steel and cement industries are gradually transitioning from coal to gas-fired systems. This shift reduces emissions while maintaining production efficiency and output quality. The glass manufacturing sector similarly adopts cleaner energy solutions for melting operations. Consequently, industrial demand patterns directly influence import volumes and infrastructure investment decisions.
Power generation facilities increasingly incorporate liquefied natural gas into their fuel mix strategies. Gas-fired plants provide flexible capacity that complements intermittent renewable sources like wind and solar. During peak electricity demand periods, these facilities quickly scale production to maintain grid stability. Furthermore, combined-cycle gas turbine technology achieves higher thermal efficiency compared to traditional coal plants.
Aligning with this, coastal provinces particularly benefit from proximity to regasification terminals and established pipeline connections. The retirement of aging coal capacity creates additional opportunities for natural gas in the electricity sector. However, competitive dynamics with coal prices influence operational dispatch decisions.
Transportation fuel applications emerge as a growing segment within the liquefied natural gas ecosystem. Heavy-duty trucks operating on long-haul routes increasingly adopt LNG as an alternative to diesel fuel. This transition reduces both operational costs and tailpipe emissions for fleet operators. Additionally, marine vessels serving domestic coastal routes explore LNG bunkering solutions.
Port authorities invest in fueling infrastructure to support this maritime sector transformation. The aviation industry evaluates sustainable aviation fuel pathways that may incorporate natural gas derivatives. Nevertheless, infrastructure availability and vehicle conversion costs currently limit widespread adoption across transportation modes.
Pipeline networks facilitate the majority of liquefied natural gas distribution from coastal terminals to inland consumption centers. These systems transport regasified product across vast distances to reach industrial clusters and urban areas. Compression stations maintain pressure throughout the network, ensuring consistent delivery to end users.
Additionally, interconnections between regional pipelines enhance system flexibility and redundancy. The mode of supply infrastructure continues expanding to serve previously underserved provinces and municipalities. Investments in smart monitoring systems improve operational efficiency and safety performance across the network.
The China liquefied natural gas (LNG) market is segmented into LNG infrastructure, application, and mode of supply. The application segment is further categorized into transportation, industrial feedstock, power generation, and other applications.
Industrial feedstock dominates consumption patterns due to China’s manufacturing-intensive economic structure. Chemical plants consume massive quantities to produce plastics, fertilizers, and various petrochemical products. The sector values natural gas for its dual role as an energy source and chemical feedstock. Process industries require consistent supply reliability to maintain continuous operations and production schedules.
Therefore, manufacturers often secure long-term contracts directly with importers and distributors. Price competitiveness against coal alternatives influences purchasing decisions, particularly for industries with lower profit margins. Government environmental regulations increasingly mandate cleaner fuel adoption, supporting sustained industrial demand growth. Technological advancements in gas utilization equipment improve conversion efficiencies, further enhancing economic attractiveness for industrial applications.
Some of the top players operating in the China liquefied natural gas (LNG) market include CNOOC, PetroChina, Sinopec, and CNPC, etc.
CNOOC (China National Offshore Oil Corporation) operates as a leading state-owned energy company specializing in offshore oil and gas exploration and production. The company manages multiple coastal LNG receiving terminals strategically positioned along China’s eastern seaboard. CNOOC’s regasification facilities process imported cargoes for distribution through extensive pipeline networks.
Additionally, the company participates in upstream LNG projects internationally, securing long-term supply agreements. Its business model integrates import terminal operations with domestic distribution capabilities and power generation investments. CNOOC emphasizes technological innovation in terminal efficiency and environmental performance standards. The company actively pursues partnerships with global suppliers to diversify its liquefied natural gas portfolio and strengthen energy security.
REPORT SYNOPSIS
| REPORT SCOPE | DETAILS |
|---|---|
| Market Forecast Years | 2026-2034 |
| Base Year | 2025 |
| Market Historical Years | 2022-2024 |
| Forecast Units | Revenue ($ Million) |
| Segments Analyzed | LNG Infrastructure, Application, and Mode of Supply |
| Country Analyzed | China |
| Companies Analyzed | Sinopec, PetroChina, CNOOC, CNPC, Suntien Green Energy, ConocoPhillips, TotalEnergies |
TABLE OF CONTENTS
RESEARCH SCOPE & METHODOLOGY
- STUDY OBJECTIVES
- METHODOLOGY
- ASSUMPTIONS & LIMITATIONS
EXECUTIVE SUMMARY
- MARKET SIZE, SHARE & ESTIMATES
- MARKET OVERVIEW
- SCOPE OF STUDY
- CRISIS SCENARIO ANALYSIS
- MAJOR MARKET FINDINGS
- CHINA REMAINS A MAJOR GLOBAL LNG IMPORTER SUPPORTING INDUSTRIAL AND POWER SECTOR GROWTH
- LNG IMPORTS COMPLEMENT DOMESTIC PRODUCTION TO MEET RISING ENERGY DEMAND
- DIVERSIFIED SUPPLY PORTFOLIO STRENGTHENS ENERGY SECURITY
- GROWING INFRASTRUCTURE SUPPORTS EXPANDED LNG RECEIVING AND DISTRIBUTION
MARKET DYNAMICS
- KEY DRIVERS
- RAPID ECONOMIC AND INDUSTRIAL EXPANSION INCREASES NATURAL GAS REQUIREMENTS
- GOVERNMENT POLICIES PROMOTE CLEANER ENERGY TRANSITION THROUGH LNG ADOPTION
- EXPANDING REGASIFICATION TERMINALS ENABLE HIGHER IMPORT CAPACITY
- URBANIZATION AND AIR QUALITY IMPROVEMENT INITIATIVES DRIVE GAS DEMAND
- KEY RESTRAINTS
- DOMESTIC PRODUCTION GROWTH REDUCES RELATIVE DEPENDENCE ON IMPORTS
- GLOBAL PRICE FLUCTUATIONS IMPACT IMPORT ECONOMICS AND VOLUME DECISIONS
- GEOPOLITICAL TENSIONS AFFECT SUPPLY ROUTES AND CONTRACT NEGOTIATIONS
- ACCELERATED RENEWABLES DEPLOYMENT MAY MODERATE FUTURE LNG GROWTH
- KEY DRIVERS
STRATEGIC MARKET ANALYTICS
- KEY MARKET TRENDS
- CHINA EMPHASIZES LONG-TERM CONTRACTS FOR SUPPLY STABILITY
- INCREASING PARTICIPATION IN SPOT AND SHORT-TERM LNG MARKETS
- FOCUS ON LOW-CARBON LNG AND METHANE EMISSION REDUCTION INITIATIVES
- EXPANSION OF DOMESTIC PIPELINE AND STORAGE INFRASTRUCTURE SUPPORTS DEMAND
- PORTER’S FIVE FORCES ANALYSIS
- BUYERS POWER
- SUPPLIERS POWER
- SUBSTITUTION
- NEW ENTRANTS
- INDUSTRY RIVALRY
- GROWTH PROSPECT MAPPING
- GROWTH PROSPECT MAPPING FOR CHINA
- MARKET MATURITY ANALYSIS
- MARKET CONCENTRATION ANALYSIS
- VALUE CHAIN ANALYSIS
- EXPLORATION AND EXTRACTION
- LIQUEFACTION AND PROCESSING
- STORAGE AND TRANSPORTATION
- EXPORT AND DISTRIBUTION
- MARKETING AND SALES
- AFTER-SALES SERVICES
- KEY BUYING CRITERIA
- PRICE COMPETITIVENESS
- SUPPLY RELIABILITY
- QUALITY STANDARDS
- CONTRACT FLEXIBILITY
- FUTURE PROSPECTS OF LNG IN CHINA
- TRADE
- EXPORTS
- IMPORTS
- LNG TERMINALS
- LIST OF LNG EXPORT TERMINALS
- REGULATORY FRAMEWORK AND COMPLIANCE BODIES
- KEY MARKET TRENDS
LIQUEFIED NATURAL GAS (LNG) MARKET BY LNG INFRASTRUCTURE
- LNG LIQUEFACTION PLANTS
- MARKET FORECAST FIGURE
- SEGMENT ANALYSIS
- LNG REGASIFICATION FACILITIES
- MARKET FORECAST FIGURE
- SEGMENT ANALYSIS
- LNG LIQUEFACTION PLANTS
LIQUEFIED NATURAL GAS (LNG) MARKET BY APPLICATION
- TRANSPORTATION
- MARKET FORECAST FIGURE
- SEGMENT ANALYSIS
- INDUSTRIAL FEEDSTOCK
- MARKET FORECAST FIGURE
- SEGMENT ANALYSIS
- POWER GENERATION
- MARKET FORECAST FIGURE
- SEGMENT ANALYSIS
- OTHER APPLICATIONS
- MARKET FORECAST FIGURE
- SEGMENT ANALYSIS
- TRANSPORTATION
LIQUEFIED NATURAL GAS (LNG) MARKET BY MODE OF SUPPLY
- TRUCK
- MARKET FORECAST FIGURE
- SEGMENT ANALYSIS
- TRANSSHIPMENT AND BUNKERING
- MARKET FORECAST FIGURE
- SEGMENT ANALYSIS
- PIPELINE AND RAIL
- MARKET FORECAST FIGURE
- SEGMENT ANALYSIS
- TRUCK
COMPETITIVE LANDSCAPE
- KEY STRATEGIC DEVELOPMENTS
- MERGERS & ACQUISITIONS
- PRODUCT LAUNCHES & DEVELOPMENTS
- PARTNERSHIPS & AGREEMENTS
- BUSINESS EXPANSIONS & DIVESTITURES
- COMPANY PROFILES
- SINOPEC
- COMPANY OVERVIEW
- PRODUCT LIST
- STRENGTHS & CHALLENGES
- PETROCHINA
- COMPANY OVERVIEW
- PRODUCT LIST
- STRENGTHS & CHALLENGES
- CNOOC
- COMPANY OVERVIEW
- PRODUCT LIST
- STRENGTHS & CHALLENGES
- CNPC
- COMPANY OVERVIEW
- PRODUCT LIST
- STRENGTHS & CHALLENGES
- SUNTIEN GREEN ENERGY
- COMPANY OVERVIEW
- PRODUCT LIST
- STRENGTHS & CHALLENGES
- CONOCOPHILLIPS
- COMPANY OVERVIEW
- PRODUCT LIST
- STRENGTHS & CHALLENGES
- TOTALENERGIES
- COMPANY OVERVIEW
- PRODUCT LIST
- STRENGTHS & CHALLENGES
- SINOPEC
- KEY STRATEGIC DEVELOPMENTS
LIST OF TABLES
TABLE 1: MARKET SNAPSHOT – LIQUEFIED NATURAL GAS (LNG)
TABLE 2: LIQUEFIED NATURAL GAS (LNG) MARKET REGULATORY FRAMEWORK
TABLE 3: CHINA NATURAL GAS PRODUCTION, 2022-2024 (IN EXAJOULES)
TABLE 4: CHINA NATURAL GAS CONSUMPTION, 2022-2024 (IN EXAJOULES)
TABLE 5: CHINA LNG EXPORTS, 2022-2024 (IN BILLION CUBIC METERS)
TABLE 6: CHINA LNG IMPORTS, 2022-2024 (IN BILLION CUBIC METERS)
TABLE 7: MARKET BY LNG INFRASTRUCTURE, HISTORICAL YEARS, 2022-2024 (IN $ MILLION)
TABLE 8: MARKET BY LNG INFRASTRUCTURE, FORECAST YEARS, 2026-2034 (IN $ MILLION)
TABLE 9: MARKET BY APPLICATION, HISTORICAL YEARS, 2022-2024 (IN $ MILLION)
TABLE 10: MARKET BY APPLICATION, FORECAST YEARS, 2026-2034 (IN $ MILLION)
TABLE 11: MARKET BY MODE OF SUPPLY, HISTORICAL YEARS, 2022-2024 (IN $ MILLION)
TABLE 12: MARKET BY MODE OF SUPPLY, FORECAST YEARS, 2026-2034 (IN $ MILLION)
TABLE 13: KEY PLAYERS OPERATING IN THE CHINESE MARKET
TABLE 14: LIST OF MERGERS & ACQUISITIONS
TABLE 15: LIST OF PRODUCT LAUNCHES & DEVELOPMENTS
TABLE 16: LIST OF PARTNERSHIPS & AGREEMENTS
TABLE 17: LIST OF BUSINESS EXPANSIONS & DIVESTITURES
LIST OF FIGURES
FIGURE 1: KEY MARKET TRENDS
FIGURE 2: PORTER’S FIVE FORCES ANALYSIS
FIGURE 3: GROWTH PROSPECT MAPPING FOR CHINA
FIGURE 4: MARKET MATURITY ANALYSIS
FIGURE 5: MARKET CONCENTRATION ANALYSIS
FIGURE 6: VALUE CHAIN ANALYSIS
FIGURE 7: KEY BUYING CRITERIA
FIGURE 8: SEGMENT GROWTH POTENTIAL, BY LNG INFRASTRUCTURE, IN 2025
FIGURE 9: LNG LIQUEFACTION PLANTS MARKET SIZE, 2026-2034 (IN $ MILLION)
FIGURE 10: LNG REGASIFICATION FACILITIES MARKET SIZE, 2026-2034 (IN $ MILLION)
FIGURE 11: SEGMENT GROWTH POTENTIAL, BY APPLICATION, IN 2025
FIGURE 12: TRANSPORTATION MARKET SIZE, 2026-2034 (IN $ MILLION)
FIGURE 13: INDUSTRIAL FEEDSTOCK MARKET SIZE, 2026-2034 (IN $ MILLION)
FIGURE 14: POWER GENERATION MARKET SIZE, 2026-2034 (IN $ MILLION)
FIGURE 15: OTHER APPLICATIONS MARKET SIZE, 2026-2034 (IN $ MILLION)
FIGURE 16: SEGMENT GROWTH POTENTIAL, BY MODE OF SUPPLY, IN 2025
FIGURE 17: TRUCK MARKET SIZE, 2026-2034 (IN $ MILLION)
FIGURE 18: TRANSSHIPMENT AND BUNKERING MARKET SIZE, 2026-2034 (IN $ MILLION)
FIGURE 19: PIPELINE AND RAIL MARKET SIZE, 2026-2034 (IN $ MILLION)
FAQ’s
RELATED REPORTS
-

UNITED STATES AI-DRIVEN CLOUD MIGRATION SERVICES MARKET FORECAST 2026-2034
-

UNITED KINGDOM AI-DRIVEN CLOUD MIGRATION SERVICES MARKET FORECAST 2026-2034
-

UNITED ARAB EMIRATES AI-DRIVEN CLOUD MIGRATION SERVICES MARKET FORECAST 2026-2034
-

SOUTH KOREA AI-DRIVEN CLOUD MIGRATION SERVICES MARKET FORECAST 2026-2034
-

SINGAPORE AI-DRIVEN CLOUD MIGRATION SERVICES MARKET FORECAST 2026-2034
-

SAUDI ARABIA AI-DRIVEN CLOUD MIGRATION SERVICES MARKET FORECAST 2026-2034
-

AUSTRALIA AI-DRIVEN CLOUD MIGRATION SERVICES MARKET FORECAST 2026-2034
-

JAPAN AI-DRIVEN CLOUD MIGRATION SERVICES MARKET FORECAST 2026-2034
-

INDIA AI-DRIVEN CLOUD MIGRATION SERVICES MARKET FORECAST 2026-2034
-

CHINA AI-DRIVEN CLOUD MIGRATION SERVICES MARKET FORECAST 2026-2034