
NORTH AMERICA REINFORCEMENT MATERIALS MARKET FORECAST 2019-2028
North America Reinforcement Materials Market by Application (Construction, Transportation, Consumer Goods, Industrial, Wind Energy, Aerospace & Defense, Other Applications) by Fiber Type (Glass Fiber (Rovings, Chopped Strand, Fabrics, Woven Roving, Csm/cfm, Other Glass Fiber Type), Aramid Fiber (Para-aramid Fiber, Meta-aramid Fiber & Others), Carbon Fiber (Pan, Pitch, Rayon & Others (Lignin)), Natural Fiber (Flax, Kenaf, Hemp, Jute, Others), Steel Rebar) and by Geography.
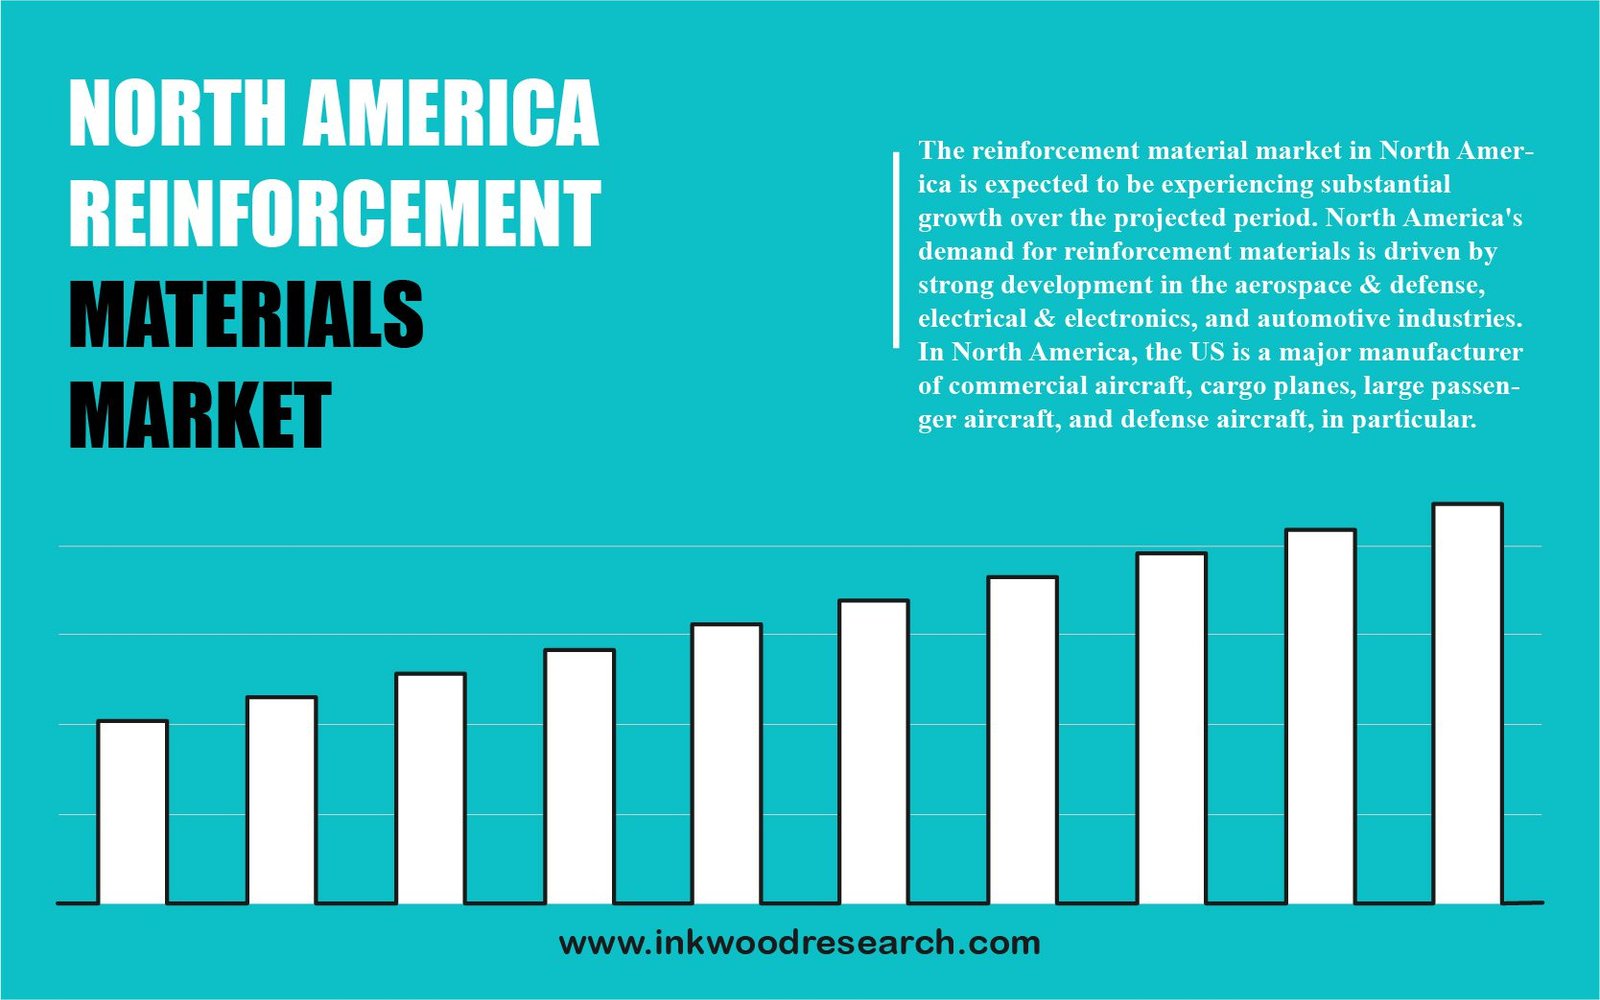
The North America reinforcement materials market is estimated to register a CAGR of 5.72% in terms of revenue, and 4.53% in terms of volume, during the forecast years of 2019 to 2028. Key factors propelling the region’s market growth include the robust developments observed across the electrical and electronics, aerospace and defense, and automotive industries, in addition to the growing demands from sectors like, health and medicine, building, manufacturing, and mining.
To learn more about this report, request a free sample copy
Canada and the United States are assessed for determining the North America reinforcement materials market growth. In the United States, the increasing need for personal protective equipment (PPE) is estimated to drive the aramid fiber market growth during the forecast years. Industries such as healthcare, mining, oil and gas, military, building, and construction need PPE to ensure workers’ protection and safety. Moreover, strict government guidelines and norms concerning employee safety in workplaces, and huge penalties for non-compliance are compelling employers to adopt PPE, and safeguard their work personnel against numerous hazards.
Growing offshore and onshore drilling endeavors, integrated with the rising shale oil and gas industry, are predicted to drive the United States’ product demand. Besides, the economic recovery, as well as, government investments in healthcare, infrastructure construction, affordable housing, manufacturing, healthcare, educational institutions, and facilities, are expected to fuel the demand for reinforcement materials. Thus, such factors are set to influence market growth, over the forecast years.
DuPoint, headquartered in the United States, primarily manufactures products like synthetic fiber, industrial chemicals, pharmaceuticals, petroleum-based fuels and lubricants, and building materials. Its operating segments include transportation and industrial, electronics and imaging, safety and construction, nutrition and biosciences, and noncore. Moreover, the company has its subsidiaries in 70 countries and manufacturing operations in nearly 40 countries, across the world.
To request a free sample copy of this report, please complete the form below :
We offer 10% free customization including country-level data, niche applications and competitive landscape with every report.
- RESEARCH SCOPE & METHODOLOGY
- STUDY OBJECTIVES
- SCOPE OF STUDY
- METHODOLOGY
- ASSUMPTIONS & LIMITATIONS
- EXECUTIVE SUMMARY
- MARKET SIZE & ESTIMATES
- MARKET OVERVIEW
- MARKET DYNAMICS
- PARENT MARKET ANALYSIS- COMPOSITE MATERIALS MARKET
- MARKET DEFINITION
- KEY DRIVERS
- INCREASING PREFERENCE FOR LIGHTWEIGHT MATERIALS
- ENHANCEMENT OF PROPERTIES OF THE PRODUCT DUE TO REINFORCEMENT
- GROWING END-USE APPLICATIONS
- GROWTH OF AEROSPACE & DEFENSE INDUSTRY
- KEY RESTRAINTS
- HIGH COST OF MANUFACTURING
- DIFFICULTY OF REPAIR AND RECYCLING
- ENVIRONMENTAL ISSUES
- KEY ANALYTICS
- KEY INVESTMENT INSIGHTS
- PORTER’S FIVE FORCE ANALYSIS
- BUYER POWER
- SUPPLIER POWER
- SUBSTITUTION
- NEW ENTRANTS
- INDUSTRY RIVALRY
- OPPORTUNITY MATRIX
- VENDOR LANDSCAPE
- IMPACT OF COVID-19 ON REINFORCEMENT MATERIALS MARKET
- MARKET BY APPLICATION
- CONSTRUCTION
- TRANSPORTATION
- CONSUMER GOODS
- INDUSTRIAL
- WIND ENERGY
- AEROSPACE & DEFENSE
- OTHER APPLICATIONS
- MARKET BY FIBER TYPE
- GLASS FIBER
- ROVINGS
- CHOPPED STRAND
- FABRICS
- WOVEN ROVING
- CSM/CFM
- OTHER GLASS FIBER TYPE
- ARAMID FIBER
- PARA-ARAMID FIBER
- META-ARAMID FIBER & OTHERS
- CARBON FIBER
- PAN
- PITCH, RAYON & OTHERS (LIGNIN)
- NATURAL FIBER
- FLAX
- KENAF
- HEMP
- JUTE
- OTHERS
- STEEL REBAR
- GLASS FIBER
- GEOGRAPHICAL ANALYSIS
- NORTH AMERICA
- UNITED STATES
- CANADA
- NORTH AMERICA
- COMPANY PROFILES
- BASF
- DUPONT
- HONEYWELL INTERNATIONAL INC
- NFC FIBERS GMBH
- TEIJIN LTD
- TORAY INDUSTRIES INC
- OWENS CORNING
- HYOSUNG CORPORATION
- BINANI INDUSTRIES
- BAST FIBERS LLC
LIST OF TABLES
TABLE 1: MARKET SNAPSHOT – REINFORCEMENT MATERIALS
TABLE 2: NORTH AMERICA REINFORCEMENT MATERIALS MARKET, BY APPLICATION, HISTORICAL YEARS, 2016-2019 (IN $ MILLION)
TABLE 3: NORTH AMERICA REINFORCEMENT MATERIALS MARKET, BY APPLICATION, FORECAST YEARS, 2019-2028 (IN $ MILLION)
TABLE 4: NORTH AMERICA REINFORCEMENT MATERIALS MARKET, BY APPLICATION, HISTORICAL YEARS, 2016-2019 (IN KILOTONS)
TABLE 5: NORTH AMERICA REINFORCEMENT MATERIALS MARKET, BY APPLICATION, FORECAST YEARS, 2019-2028 (IN KILOTONS)
TABLE 6: NORTH AMERICA REINFORCEMENT MATERIALS MARKET, BY FIBER TYPE, HISTORICAL YEARS, 2016-2019 (IN $ MILLION)
TABLE 7: NORTH AMERICA REINFORCEMENT MATERIALS MARKET, BY FIBER TYPE, FORECAST YEARS, 2019-2028 (IN $ MILLION)
TABLE 8: NORTH AMERICA REINFORCEMENT MATERIALS MARKET, BY FIBER TYPE, HISTORICAL YEARS, 2016-2019 (IN KILOTONS)
TABLE 9: NORTH AMERICA REINFORCEMENT MATERIALS MARKET, BY FIBER TYPE, FORECAST YEARS, 2019-2028 (IN KILOTONS)
TABLE 10: NORTH AMERICA GLASS FIBER MARKET, BY TYPE, HISTORICAL YEARS, 2016-2019 (IN $ MILLION)
TABLE 11: NORTH AMERICA GLASS FIBER MARKET, BY TYPE, FORECAST YEARS, 2019-2028 (IN $ MILLION)
TABLE 12: NORTH AMERICA GLASS FIBER MARKET, BY TYPE, HISTORICAL YEARS, 2016-2019 (IN KILOTONS)
TABLE 13: NORTH AMERICA GLASS FIBER MARKET, BY TYPE, FORECAST YEARS, 2019-2028 (IN KILOTONS)
TABLE 14: NORTH AMERICA ARAMID FIBER MARKET, BY TYPE, HISTORICAL YEARS, 2016-2019 (IN $ MILLION)
TABLE 15: NORTH AMERICA ARAMID FIBER MARKET, BY TYPE, FORECAST YEARS, 2019-2028 (IN $ MILLION)
TABLE 16: NORTH AMERICA ARAMID FIBER MARKET, BY TYPE, HISTORICAL YEARS, 2016-2019 (IN KILOTONS)
TABLE 17: NORTH AMERICA ARAMID FIBER MARKET, BY TYPE, FORECAST YEARS, 2019-2028 (IN KILOTONS)
TABLE 18: NORTH AMERICA CARBON FIBER MARKET, BY TYPE, HISTORICAL YEARS, 2016-2019 (IN $ MILLION)
TABLE 19: NORTH AMERICA CARBON FIBER MARKET, BY TYPE, FORECAST YEARS, 2019-2028 (IN $ MILLION)
TABLE 20: NORTH AMERICA CARBON FIBER MARKET, BY TYPE, HISTORICAL YEARS, 2016-2019 (IN KILOTONS)
TABLE 21: NORTH AMERICA CARBON FIBER MARKET, BY TYPE, FORECAST YEARS, 2019-2028 (IN KILOTONS)
TABLE 22: NORTH AMERICA NATURAL FIBER MARKET, BY TYPE, HISTORICAL YEARS, 2016-2019 (IN $ MILLION)
TABLE 23: NORTH AMERICA NATURAL FIBER MARKET, BY TYPE, FORECAST YEARS, 2019-2028 (IN $ MILLION)
TABLE 24: NORTH AMERICA NATURAL FIBER MARKET, BY TYPE, HISTORICAL YEARS, 2016-2019 (IN KILOTONS)
TABLE 25: NORTH AMERICA NATURAL FIBER MARKET, BY TYPE, FORECAST YEARS, 2019-2028 (IN KILOTONS)
TABLE 26: NORTH AMERICA REINFORCEMENT MATERIALS MARKET, BY COUNTRY, HISTORICAL YEARS, 2016-2019 (IN $ MILLION)
TABLE 27: NORTH AMERICA REINFORCEMENT MATERIALS MARKET, BY COUNTRY, FORECAST YEARS, 2019-2028 (IN $ MILLION)
TABLE 28: NORTH AMERICA REINFORCEMENT MATERIALS MARKET, BY COUNTRY, HISTORICAL YEARS, 2016-2019 (IN KILOTONS)
TABLE 29: NORTH AMERICA REINFORCEMENT MATERIALS MARKET, BY COUNTRY, FORECAST YEARS, 2019-2028 (IN KILOTONS)
LIST OF FIGURES
FIGURE 1: KEY INVESTMENT INSIGHTS
FIGURE 2: PORTER’S FIVE FORCE ANALYSIS
FIGURE 3: OPPORTUNITY MATRIX
FIGURE 4: VENDOR LANDSCAPE
FIGURE 5: NORTH AMERICA REINFORCEMENT MATERIALS MARKET, GROWTH POTENTIAL, BY APPLICATION, IN 2019
FIGURE 6: NORTH AMERICA REINFORCEMENT MATERIALS MARKET, BY CONSTRUCTION, 2019-2028 (IN $ MILLION)
FIGURE 7: NORTH AMERICA REINFORCEMENT MATERIALS MARKET, BY TRANSPORTATION, 2019-2028 (IN $ MILLION)
FIGURE 8: NORTH AMERICA REINFORCEMENT MATERIALS MARKET, BY CONSUMER GOODS, 2019-2028 (IN $ MILLION)
FIGURE 9: NORTH AMERICA REINFORCEMENT MATERIALS MARKET, BY INDUSTRIAL APPLICATION, 2019-2028 (IN $ MILLION)
FIGURE 10: NORTH AMERICA REINFORCEMENT MATERIALS MARKET, BY WIND ENERGY, 2019-2028 (IN $ MILLION)
FIGURE 11: NORTH AMERICA REINFORCEMENT MATERIALS MARKET, BY AEROSPACE & DEFENSE, 2019-2028 (IN $ MILLION)
FIGURE 12: NORTH AMERICA REINFORCEMENT MATERIALS MARKET, BY OTHER APPLICATIONS, 2019-2028 (IN $ MILLION)
FIGURE 13: NORTH AMERICA REINFORCEMENT MATERIALS MARKET, GROWTH POTENTIAL, BY FIBER TYPE, IN 2019
FIGURE 14: NORTH AMERICA REINFORCEMENT MATERIALS MARKET, BY GLASS FIBER, 2019-2028 (IN $ MILLION)
FIGURE 15: NORTH AMERICA REINFORCEMENT MATERIALS MARKET, BY ARAMID FIBER, 2019-2028 (IN $ MILLION)
FIGURE 16: NORTH AMERICA REINFORCEMENT MATERIALS MARKET, BY CARBON FIBER, 2019-2028 (IN $ MILLION)
FIGURE 17: NORTH AMERICA REINFORCEMENT MATERIALS MARKET, BY NATURAL FIBER, 2019-2028 (IN $ MILLION)
FIGURE 18: NORTH AMERICA REINFORCEMENT MATERIALS MARKET, BY STEEL REBAR, 2019-2028 (IN $ MILLION)
FIGURE 19: NORTH AMERICA REINFORCEMENT MATERIALS MARKET, REGIONAL OUTLOOK, 2019 & 2028 (IN %)
FIGURE 20: UNITED STATES REINFORCEMENT MATERIALS MARKET, 2019-2028 (IN $ MILLION)
FIGURE 21: CANADA REINFORCEMENT MATERIALS MARKET, 2019-2028 (IN $ MILLION)
- GEOGRAPHICAL ANALYSIS
- NORTH AMERICA
- UNITED STATES
- CANADA
- NORTH AMERICA
- MARKET BY APPLICATION
- CONSTRUCTION
- TRANSPORTATION
- CONSUMER GOODS
- INDUSTRIAL
- WIND ENERGY
- AEROSPACE & DEFENSE
- OTHER APPLICATIONS
- MARKET BY FIBER TYPE
- GLASS FIBER
- ROVINGS
- CHOPPED STRAND
- FABRICS
- WOVEN ROVING
- CSM/CFM
- OTHER GLASS FIBER TYPE
- ARAMID FIBER
- PARA-ARAMID FIBER
- META-ARAMID FIBER & OTHERS
- CARBON FIBER
- PAN
- PITCH, RAYON & OTHERS (LIGNIN)
- NATURAL FIBER
- FLAX
- KENAF
- HEMP
- JUTE
- OTHERS
- STEEL REBAR
- GLASS FIBER
To request a free sample copy of this report, please complete the form below :
We offer 10% free customization including country-level data, niche applications and competitive landscape with every report.