Malaysia Liquefied Natural Gas (LNG) Market by LNG Infrastructure (LNG Liquefaction Plants, LNG Regasification Facilities, LNG Shipping & Transportation) Market by Application (Transportation, Industrial Feedstock, Power Generation, Other Applications) Market by Mode of Supply (Truck, Transshipment and Bunkering, Pipeline and Rail)
MALAYSIA LIQUEFIED NATURAL GAS (LNG) MARKET OVERVIEW
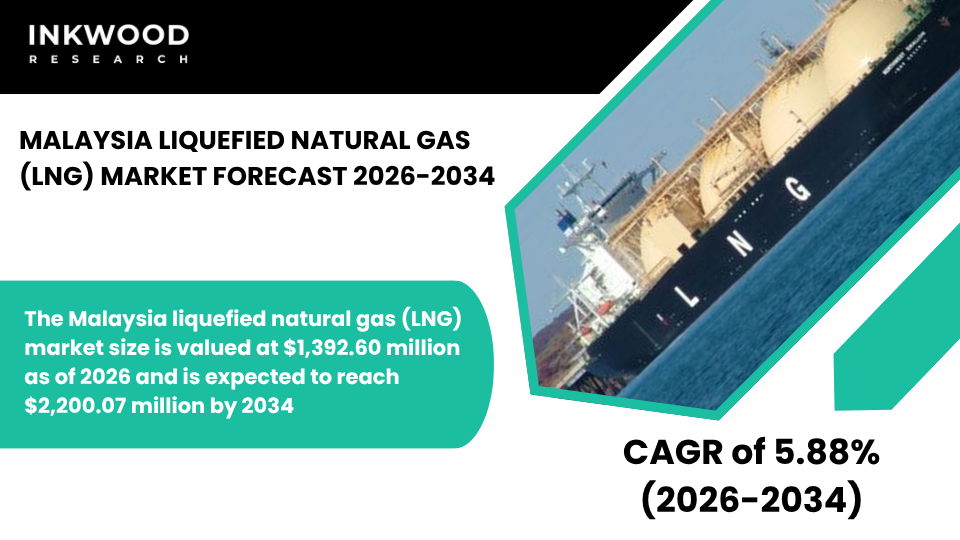
The Malaysia liquefied natural gas (LNG) market size is valued at $1,392.60 million as of 2026 and is expected to reach $2,200.07 million by 2034, progressing with a CAGR of 5.88% during the forecast years, 2026-2034.
Malaysia’s dual role as both a liquefied natural gas producer and consumer creates a unique market dynamic that balances domestic energy security with export revenue generation. The country leverages its strategic location in Southeast Asia to serve regional buyers while simultaneously ensuring adequate supplies for its own growing industrial base and power generation needs.
According to the Energy Commission of Malaysia, natural gas plays a central role in the national energy mix, supporting economic development while the country gradually increases renewable energy capacity. This balanced approach allows Malaysia to maintain export competitiveness while protecting domestic consumers from potential supply shortages during periods of peak demand or production disruptions.
Domestic consumption patterns reflect Malaysia’s expanding industrial sector and urbanization trends that drive sustained demand for reliable energy supplies. Manufacturing facilities, particularly those in electronics, chemicals, and petroleum refining, depend heavily on natural gas for both fuel power and process heat applications.
Meanwhile, residential and commercial sectors increasingly access gas through distribution networks that connect major urban centers to production and import facilities. Consequently, the natural gas market serves diverse customer segments with varying requirements for volume, reliability, and pricing structures. Government policies actively promote gas utilization as part of broader efforts to reduce carbon emissions from coal-based systems while maintaining affordable energy costs.
Malaysia’s established liquefaction infrastructure positions the country as a significant player in the regional liquefied natural gas trade despite competition from larger producers like Australia and Qatar. The facilities located in Sarawak have operated for decades, building long-term relationships with buyers across Japan, South Korea, Taiwan, and China.
To Know More About This Report, Request a Free Sample Copy
These export operations generate substantial foreign exchange earnings that support national economic development priorities. However, gradually declining production from mature offshore fields creates challenges for maintaining historical export volumes while meeting rising domestic requirements. Therefore, operators continuously evaluate field development opportunities and enhanced recovery techniques to optimize existing assets.
Power generation represents a cornerstone application for liquefied natural gas throughout Malaysia’s energy system, as gas-fired plants provide the majority of the country’s electricity supply. Combined-cycle facilities deliver efficient baseload generation while offering the flexibility needed to balance intermittent renewable output from expanding solar installations.
According to Suruhanjaya Tenaga, Malaysia’s energy regulator, natural gas contributes significantly to grid stability and electricity affordability for consumers. Furthermore, utilities continue investing in plant efficiency upgrades and emission control technologies to extend facility operating life while meeting environmental performance standards. The sector’s sustained appetite for gas creates predictable demand patterns that underpin infrastructure planning and supply agreements.
Industrial feedstock applications drive substantial consumption volumes across Malaysia’s petrochemical and manufacturing sectors, where natural gas serves dual purposes as an energy source and raw material input. Chemical plants synthesize ammonia, methanol, and various polymers using gas as a fundamental building block for production processes.
Additionally, the fertilizer industry depends on reliable supplies to maintain agricultural productivity and food security objectives. These industrial consumers typically secure long-term supply contracts directly with producers or through wholesale distributors to ensure consistent availability at predictable prices. Price competitiveness against alternative fuels significantly influences procurement decisions, particularly for industries facing intense international market competition.
Transportation fuel applications remain relatively limited in Malaysia compared to power generation and industrial uses, though maritime bunkering opportunities are gradually emerging at major port facilities. Shipping companies evaluate liquefied natural gas as a cleaner alternative to heavy fuel oil, driven by international emission regulations and corporate sustainability commitments.
However, infrastructure availability and vessel conversion costs currently constrain broader adoption across the maritime sector. Similarly, road transport applications face challenges related to refueling station networks and vehicle technology availability. Nevertheless, ongoing pilot projects and government incentive programs suggest potential for incremental growth as the transportation fuel segment matures.
Transshipment and bunkering activities leverage Malaysia’s strategic geographic position along major shipping routes connecting the Indian Ocean with East Asian markets. Port facilities develop capabilities to receive, store, and transfer liquefied natural gas between vessels, creating opportunities for value-added services beyond traditional export activities.
These operations support both domestic consumption requirements and regional trade flows, enhancing Malaysia’s role as a natural gas hub. Moreover, bunkering services position Malaysian ports competitively against regional alternatives as the maritime industry transitions toward cleaner energy sources. Infrastructure investments in specialized handling equipment and safety systems enable efficient cargo operations while meeting stringent international standards.
The Malaysia liquefied natural gas (LNG) market is segmented into LNG infrastructure, application, and mode of supply. The mode of supply segment is further categorized into truck, transshipment and bunkering, and pipeline and rail.
Transshipment and bunkering operations represent a growing segment within Malaysia’s liquefied natural gas infrastructure landscape as the country capitalizes on its advantageous location along critical maritime trading corridors. These activities involve transferring LNG between vessels at specialized port facilities equipped with cryogenic handling capabilities and safety systems designed for ultra-cold liquid operations.
Malaysia’s ports serve as convenient refueling points for vessels traversing routes between the Middle East, Australia, and Northeast Asian markets, creating opportunities to capture service revenues beyond traditional cargo exports. Furthermore, as the global shipping industry accelerates its transition toward cleaner fuels to comply with International Maritime Organization emission standards, demand for bunkering services continues to expand.
Port operators invest in floating storage units and dedicated bunkering vessels that can efficiently service ships at berth or anchorage positions. Additionally, these facilities support domestic coastal shipping operations that increasingly adopt liquefied natural gas as a transportation fuel alternative. The segment benefits from Malaysia’s existing LNG expertise and infrastructure while opening new revenue streams that diversify the country’s natural gas market participation.
Some of the top players operating in the Malaysia liquefied natural gas (LNG) market include Petronas, Gas Malaysia, and Shell Malaysia, etc.
Petronas operates as Malaysia’s national oil and gas company, headquartered in Kuala Lumpur with integrated operations spanning exploration, production, liquefaction, and downstream distribution. The company manages Malaysia’s major LNG export facilities while simultaneously developing domestic gas infrastructure to serve industrial and residential consumers nationwide. Petronas maintains diverse international partnerships that strengthen its technical capabilities and market access across the global liquefied natural gas trade.
The company’s business model combines upstream resource development with midstream infrastructure investments and downstream marketing activities, creating vertical integration that enhances operational efficiency and value capture. Additionally, Petronas pursues floating LNG technology to access stranded gas reserves that conventional facilities cannot economically develop, demonstrating its commitment to innovation and resource optimization.
REPORT SYNOPSIS
| REPORT SCOPE | DETAILS |
|---|---|
| Market Forecast Years | 2026-2034 |
| Base Year | 2025 |
| Market Historical Years | 2022-2024 |
| Forecast Units | Revenue ($ Million) |
| Segments Analyzed | LNG Infrastructure, Application, and Mode of Supply |
| Country Analyzed | Malaysia |
| Companies Analyzed | Petronas, Gas Malaysia, Petrolife Aero, Sabah Energy Corporation, Petronas Gas Berhad, Shell Malaysia |
TABLE OF CONTENTS
RESEARCH SCOPE & METHODOLOGY
- STUDY OBJECTIVES
- METHODOLOGY
- ASSUMPTIONS & LIMITATIONS
EXECUTIVE SUMMARY
- MARKET SIZE, SHARE & ESTIMATES
- MARKET OVERVIEW
- SCOPE OF STUDY
- CRISIS SCENARIO ANALYSIS
- MAJOR MARKET FINDINGS
- MALAYSIA BALANCES DOMESTIC LNG CONSUMPTION WITH EXPORT ACTIVITIES
- THE COUNTRY UTILIZES LNG FOR POWER GENERATION AND INDUSTRIAL NEEDS
- EXPORT PROJECTS SUPPORT ECONOMIC REVENUES FROM NATURAL GAS RESOURCES
- INFRASTRUCTURE DEVELOPMENTS ENHANCE BOTH IMPORT AND EXPORT CAPABILITIES
MARKET DYNAMICS
- KEY DRIVERS
- DOMESTIC ENERGY DEMAND FROM POWER AND INDUSTRY SUPPORTS LNG USE
- GOVERNMENT POLICIES PROMOTE GAS AS A CLEANER FUEL SOURCE
- EXISTING LIQUEFACTION FACILITIES FACILITATE EXPORT MARKET PARTICIPATION
- STRATEGIC LOCATION AIDS REGIONAL LNG TRADE DYNAMICS
- KEY RESTRAINTS
- COMPETITION FROM LARGER REGIONAL EXPORTERS PRESSURES MARKET SHARE
- DECLINING DOMESTIC PRODUCTION MAY INCREASE FUTURE IMPORT NEEDS
- GLOBAL MARKET VOLATILITY AFFECTS EXPORT ECONOMICS
- INFRASTRUCTURE EXPANSION REQUIRES SIGNIFICANT CAPITAL INVESTMENT
- KEY DRIVERS
STRATEGIC MARKET ANALYTICS
- KEY MARKET TRENDS
- MALAYSIA FOCUSES ON OPTIMIZING DOMESTIC GAS UTILIZATION FOR SECURITY
- EXPLORATION OF SMALL-SCALE AND FLOATING LNG SOLUTIONS CONTINUES
- INCREASING EMPHASIS ON SUSTAINABLE PRACTICES IN LNG OPERATIONS
- REGIONAL PARTNERSHIPS SUPPORT TRADE AND INFRASTRUCTURE DEVELOPMENT
- PORTER’S FIVE FORCES ANALYSIS
- BUYERS POWER
- SUPPLIERS POWER
- SUBSTITUTION
- NEW ENTRANTS
- INDUSTRY RIVALRY
- GROWTH PROSPECT MAPPING
- GROWTH PROSPECT MAPPING FOR MALAYSIA
- MARKET MATURITY ANALYSIS
- MARKET CONCENTRATION ANALYSIS
- VALUE CHAIN ANALYSIS
- EXPLORATION AND EXTRACTION
- LIQUEFACTION AND PROCESSING
- STORAGE AND TRANSPORTATION
- EXPORT AND DISTRIBUTION
- MARKETING AND SALES
- AFTER-SALES SERVICES
- KEY BUYING CRITERIA
- PRICE COMPETITIVENESS
- SUPPLY RELIABILITY
- QUALITY STANDARDS
- CONTRACT FLEXIBILITY
- FUTURE PROSPECTS OF LNG IN MALAYSIA
- TRADE
- EXPORTS
- IMPORTS
- LNG TERMINALS
- LIST OF LNG EXPORT TERMINALS
- REGULATORY FRAMEWORK AND COMPLIANCE BODIES
- KEY MARKET TRENDS
LIQUEFIED NATURAL GAS (LNG) MARKET BY LNG INFRASTRUCTURE
- LNG LIQUEFACTION PLANTS
- MARKET FORECAST FIGURE
- SEGMENT ANALYSIS
- LNG REGASIFICATION FACILITIES
- MARKET FORECAST FIGURE
- SEGMENT ANALYSIS
- LNG LIQUEFACTION PLANTS
LIQUEFIED NATURAL GAS (LNG) MARKET BY APPLICATION
- TRANSPORTATION
- MARKET FORECAST FIGURE
- SEGMENT ANALYSIS
- INDUSTRIAL FEEDSTOCK
- MARKET FORECAST FIGURE
- SEGMENT ANALYSIS
- POWER GENERATION
- MARKET FORECAST FIGURE
- SEGMENT ANALYSIS
- OTHER APPLICATIONS
- MARKET FORECAST FIGURE
- SEGMENT ANALYSIS
- TRANSPORTATION
LIQUEFIED NATURAL GAS (LNG) MARKET BY MODE OF SUPPLY
- TRUCK
- MARKET FORECAST FIGURE
- SEGMENT ANALYSIS
- TRANSSHIPMENT AND BUNKERING
- MARKET FORECAST FIGURE
- SEGMENT ANALYSIS
- PIPELINE AND RAIL
- MARKET FORECAST FIGURE
- SEGMENT ANALYSIS
- TRUCK
COMPETITIVE LANDSCAPE
- KEY STRATEGIC DEVELOPMENTS
- MERGERS & ACQUISITIONS
- PRODUCT LAUNCHES & DEVELOPMENTS
- PARTNERSHIPS & AGREEMENTS
- BUSINESS EXPANSIONS & DIVESTITURES
- COMPANY PROFILES
- PETRONAS
- COMPANY OVERVIEW
- PRODUCT LIST
- STRENGTHS & CHALLENGES
- GAS MALAYSIA
- COMPANY OVERVIEW
- PRODUCT LIST
- STRENGTHS & CHALLENGES
- PETROLIFE AERO
- COMPANY OVERVIEW
- PRODUCT LIST
- STRENGTHS & CHALLENGES
- SABAH ENERGY CORPORATION
- COMPANY OVERVIEW
- PRODUCT LIST
- STRENGTHS & CHALLENGES
- PETRONAS GAS BERHAD
- COMPANY OVERVIEW
- PRODUCT LIST
- STRENGTHS & CHALLENGES
- SHELL MALAYSIA
- COMPANY OVERVIEW
- PRODUCT LIST
- STRENGTHS & CHALLENGES
- PETRONAS
- KEY STRATEGIC DEVELOPMENTS
LIST OF TABLES
TABLE 1: MARKET SNAPSHOT – LIQUEFIED NATURAL GAS (LNG)
TABLE 2: LIQUEFIED NATURAL GAS (LNG) MARKET REGULATORY FRAMEWORK
TABLE 3: MALAYSIA NATURAL GAS PRODUCTION, 2022-2024 (IN EXAJOULES)
TABLE 4: MALAYSIA NATURAL GAS CONSUMPTION, 2022-2024 (IN EXAJOULES)
TABLE 5: MALAYSIA LNG EXPORTS, 2022-2024 (IN BILLION CUBIC METERS)
TABLE 6: MALAYSIA LNG IMPORTS, 2022-2024 (IN BILLION CUBIC METERS)
TABLE 7: MARKET BY LNG INFRASTRUCTURE, HISTORICAL YEARS, 2022-2024 (IN $ MILLION)
TABLE 8: MARKET BY LNG INFRASTRUCTURE, FORECAST YEARS, 2026-2034 (IN $ MILLION)
TABLE 9: MARKET BY APPLICATION, HISTORICAL YEARS, 2022-2024 (IN $ MILLION)
TABLE 10: MARKET BY APPLICATION, FORECAST YEARS, 2026-2034 (IN $ MILLION)
TABLE 11: MARKET BY MODE OF SUPPLY, HISTORICAL YEARS, 2022-2024 (IN $ MILLION)
TABLE 12: MARKET BY MODE OF SUPPLY, FORECAST YEARS, 2026-2034 (IN $ MILLION)
TABLE 13: KEY PLAYERS OPERATING IN THE MALAYSIAN MARKET
TABLE 14: LIST OF MERGERS & ACQUISITIONS
TABLE 15: LIST OF PRODUCT LAUNCHES & DEVELOPMENTS
TABLE 16: LIST OF PARTNERSHIPS & AGREEMENTS
TABLE 17: LIST OF BUSINESS EXPANSIONS & DIVESTITURES
LIST OF FIGURES
FIGURE 1: KEY MARKET TRENDS
FIGURE 2: PORTER’S FIVE FORCES ANALYSIS
FIGURE 3: GROWTH PROSPECT MAPPING FOR MALAYSIA
FIGURE 4: MARKET MATURITY ANALYSIS
FIGURE 5: MARKET CONCENTRATION ANALYSIS
FIGURE 6: VALUE CHAIN ANALYSIS
FIGURE 7: KEY BUYING CRITERIA
FIGURE 8: SEGMENT GROWTH POTENTIAL, BY LNG INFRASTRUCTURE, IN 2025
FIGURE 9: LNG LIQUEFACTION PLANTS MARKET SIZE, 2026-2034 (IN $ MILLION)
FIGURE 10: LNG REGASIFICATION FACILITIES MARKET SIZE, 2026-2034 (IN $ MILLION)
FIGURE 11: SEGMENT GROWTH POTENTIAL, BY APPLICATION, IN 2025
FIGURE 12: TRANSPORTATION MARKET SIZE, 2026-2034 (IN $ MILLION)
FIGURE 13: INDUSTRIAL FEEDSTOCK MARKET SIZE, 2026-2034 (IN $ MILLION)
FIGURE 14: POWER GENERATION MARKET SIZE, 2026-2034 (IN $ MILLION)
FIGURE 15: OTHER APPLICATIONS MARKET SIZE, 2026-2034 (IN $ MILLION)
FIGURE 16: SEGMENT GROWTH POTENTIAL, BY MODE OF SUPPLY, IN 2025
FIGURE 17: TRUCK MARKET SIZE, 2026-2034 (IN $ MILLION)
FIGURE 18: TRANSSHIPMENT AND BUNKERING MARKET SIZE, 2026-2034 (IN $ MILLION)
FIGURE 19: PIPELINE AND RAIL MARKET SIZE, 2026-2034 (IN $ MILLION)
FAQ’s
RELATED REPORTS
-

UNITED STATES AI-DRIVEN CLOUD MIGRATION SERVICES MARKET FORECAST 2026-2034
-

UNITED KINGDOM AI-DRIVEN CLOUD MIGRATION SERVICES MARKET FORECAST 2026-2034
-

UNITED ARAB EMIRATES AI-DRIVEN CLOUD MIGRATION SERVICES MARKET FORECAST 2026-2034
-

SOUTH KOREA AI-DRIVEN CLOUD MIGRATION SERVICES MARKET FORECAST 2026-2034
-

SINGAPORE AI-DRIVEN CLOUD MIGRATION SERVICES MARKET FORECAST 2026-2034
-

SAUDI ARABIA AI-DRIVEN CLOUD MIGRATION SERVICES MARKET FORECAST 2026-2034
-

AUSTRALIA AI-DRIVEN CLOUD MIGRATION SERVICES MARKET FORECAST 2026-2034
-

JAPAN AI-DRIVEN CLOUD MIGRATION SERVICES MARKET FORECAST 2026-2034
-

INDIA AI-DRIVEN CLOUD MIGRATION SERVICES MARKET FORECAST 2026-2034
-

CHINA AI-DRIVEN CLOUD MIGRATION SERVICES MARKET FORECAST 2026-2034