Japan Liquefied Natural Gas (LNG) Market by LNG Infrastructure (LNG Liquefaction Plants, LNG Regasification Facilities, LNG Shipping & Transportation) Market by Application (Transportation, Industrial Feedstock, Power Generation, Other Applications) Market by Mode of Supply (Truck, Transshipment and Bunkering, Pipeline and Rail)
JAPAN LIQUEFIED NATURAL GAS (LNG) MARKET OVERVIEW
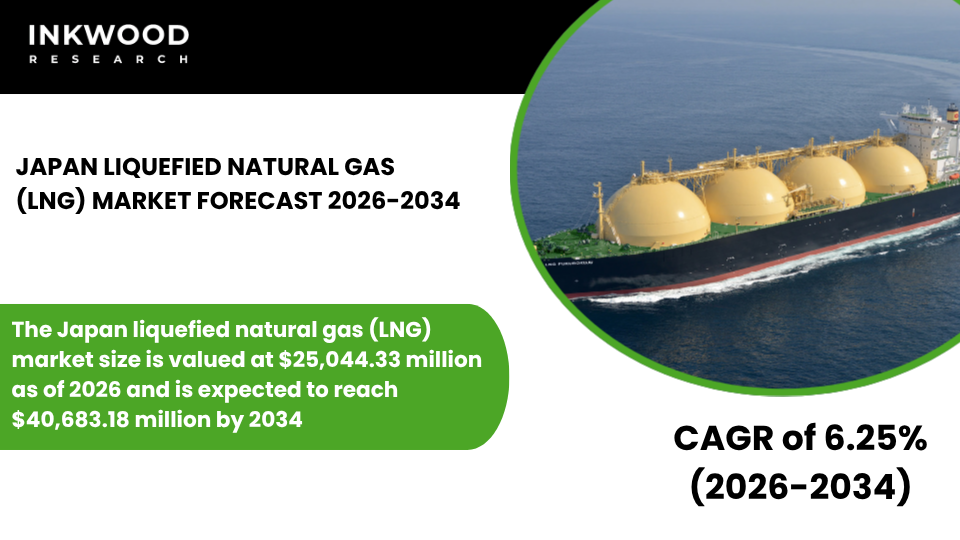
The Japan liquefied natural gas (LNG) market size is valued at $25,044.33 million as of 2026 and is expected to reach $40,683.18 million by 2034, progressing with a CAGR of 6.25% during the forecast years, 2026-2034.
Japan’s position as one of the world’s largest liquefied natural gas importers stems directly from its limited domestic energy resources and the critical role that natural gas plays in ensuring national energy security. Following the significant reduction in nuclear power generation capacity after the Fukushima incident, gas-fired plants became even more essential for maintaining a reliable electricity supply across the archipelago.
Consequently, Japan has developed extensive regasification infrastructure along its coastlines to receive cargoes from diverse international suppliers. According to the Ministry of Economy, Trade and Industry, the government continues prioritizing energy diversification strategies that balance cost, security, and environmental considerations while supporting economic growth and industrial competitiveness.
Power generation dominates Japan’s liquefied natural gas consumption patterns, accounting for the overwhelming majority of import volumes as utilities depend on gas-fired capacity to meet baseload and peak electricity demand. Combined-cycle gas turbine plants deliver superior thermal efficiency compared to older coal-fired units, thereby reducing fuel costs per megawatt-hour while simultaneously lowering carbon emissions.
Furthermore, these facilities provide the operational flexibility needed to balance intermittent renewable energy output from expanding solar and wind installations. The electricity sector’s sustained appetite for natural gas reinforces Japan’s commitment to maintaining robust import capabilities and diversified supply arrangements that protect against potential disruptions.
To Know More About This Report, Request a Free Sample Copy
Japan’s procurement strategy reflects decades of experience managing liquefied natural gas imports through a sophisticated portfolio approach that combines long-term contracts with flexible spot market participation. Major utilities and trading companies secure baseline volumes through multi-year agreements with established suppliers in Australia, Malaysia, Qatar, and the United States, ensuring predictable pricing and delivery schedules.
Additionally, buyers increasingly participate in short-term markets to capitalize on favorable pricing opportunities when global supply exceeds demand. This balanced approach provides both security and economic optimization, allowing Japanese importers to navigate the volatile natural gas market while maintaining the reliability that industrial and residential consumers require.
Industrial applications represent another significant consumption segment within Japan’s energy landscape, particularly among manufacturing sectors that require consistent fuel power for production processes. Chemical plants utilize natural gas as both an energy source and essential feedstock for synthesizing ammonia, methanol, and various petrochemical products.
Moreover, steel mills and automotive manufacturers increasingly adopt gas-based heating systems to meet stringent environmental regulations while maintaining product quality standards. The food processing industry similarly values natural gas for its clean combustion characteristics and precise temperature control capabilities. These industrial consumers benefit from Japan’s well-developed infrastructure that ensures reliable delivery even during periods of peak demand.
Transportation fuel applications have begun emerging as Japan explores alternative solutions to reduce greenhouse gas emissions from its extensive maritime shipping activities. Major ports develop LNG bunkering capabilities to serve vessels transitioning away from heavy fuel oil in compliance with International Maritime Organization emission standards.
Furthermore, coastal shipping operations serving domestic routes increasingly consider liquefied natural gas as a viable alternative that reduces both operational costs and environmental impact. However, the segment currently represents a modest share of total consumption compared to power generation and industrial uses. Nevertheless, ongoing infrastructure investments and regulatory support suggest potential for gradual expansion as the maritime sector accelerates its decarbonization efforts.
Japan’s commitment to cleaner energy extends beyond current applications as the country explores innovative pathways for integrating liquefied natural gas with emerging technologies like hydrogen production and carbon capture systems. Research initiatives investigate using natural gas as a feedstock for blue hydrogen generation, which could support Japan’s vision of becoming a hydrogen-based society.
Meanwhile, pilot projects examine the feasibility of retrofitting gas-fired power plants with carbon capture equipment to reduce emissions while maintaining reliable generation capacity. These forward-looking efforts demonstrate how liquefied natural gas serves not only as a transition fuel but also as an enabler of next-generation energy solutions.
Regasification infrastructure forms the backbone of Japan’s liquefied natural gas supply chain, with numerous terminals positioned strategically along both Pacific and Sea of Japan coastlines to serve regional demand centers. These facilities transform cryogenic LNG back into gaseous form for injection into local distribution networks that supply power plants, industrial facilities, and residential customers.
Storage tanks at terminal sites provide buffer capacity that enables operators to manage delivery schedules flexibly while maintaining supply security during unexpected events. Moreover, ongoing maintenance and modernization programs ensure these critical assets continue operating safely and efficiently despite many having decades of service history.
The Japan liquefied natural gas (LNG) market is segmented into LNG infrastructure, application, and mode of supply. The application segment is further categorized into transportation, industrial feedstock, power generation, and other applications.
Power generation thoroughly dominates Japan’s liquefied natural gas application landscape as the electricity sector depends fundamentally on imported gas to meet the nation’s substantial power requirements throughout all seasons. Gas-fired plants provide approximately one-third of Japan’s total electricity generation, making them indispensable for grid stability and economic activity.
Following the nuclear capacity reductions after 2011, utilities rapidly expanded their reliance on natural gas to fill the resulting supply gap while simultaneously working to integrate growing renewable energy resources. The sector’s sustained demand creates predictable import patterns that underpin Japan’s long-term supply contracts with international producers. Additionally, utilities continuously invest in upgrading existing gas turbine facilities to improve efficiency and reduce per-unit emissions, thereby extending the operational life of critical infrastructure assets.
These power plants benefit from Japan’s extensive terminal network, which ensures reliable fuel delivery even during extreme weather events or geopolitical disruptions affecting specific supply routes. Government energy policies explicitly recognize gas-fired generation as essential for maintaining electricity security during the ongoing energy transition toward lower-carbon systems.
Some of the top players operating in the Japan liquefied natural gas (LNG) market include JERA, Tokyo Gas, Osaka Gas, and Mitsubishi Corporation, etc.
JERA operates as Japan’s largest power generation company and liquefied natural gas importer, formed through a joint venture between Tokyo Electric Power Company and Chubu Electric Power Company. Headquartered in Tokyo, JERA manages an extensive portfolio of thermal power plants across Japan while coordinating global LNG procurement activities to supply these facilities. The company’s business model integrates upstream investments in international gas projects with midstream shipping capabilities and downstream power generation assets, creating vertical integration that enhances supply security and cost management.
JERA maintains diverse supply relationships with producers across Australia, Qatar, the United States, and Southeast Asia, ensuring portfolio resilience against regional disruptions. Furthermore, the company actively participates in developing cleaner energy technologies, including ammonia co-firing and hydrogen blending, to reduce emissions from its thermal generation fleet while maintaining operational reliability.
REPORT SYNOPSIS
| REPORT SCOPE | DETAILS |
|---|---|
| Market Forecast Years | 2026-2034 |
| Base Year | 2025 |
| Market Historical Years | 2022-2024 |
| Forecast Units | Revenue ($ Million) |
| Segments Analyzed | LNG Infrastructure, Application, and Mode of Supply |
| Country Analyzed | Japan |
| Companies Analyzed | JERA, Tokyo Gas, Osaka Gas, Kansai Electric, Mitsubishi Corporation, Mitsui & Co, INPEX |
TABLE OF CONTENTS
RESEARCH SCOPE & METHODOLOGY
- STUDY OBJECTIVES
- METHODOLOGY
- ASSUMPTIONS & LIMITATIONS
EXECUTIVE SUMMARY
- MARKET SIZE, SHARE & ESTIMATES
- MARKET OVERVIEW
- SCOPE OF STUDY
- CRISIS SCENARIO ANALYSIS
- MAJOR MARKET FINDINGS
- JAPAN REMAINS ONE OF THE WORLD’S LARGEST LNG IMPORTERS FOR POWER GENERATION
- LONG-TERM CONTRACTS FROM DIVERSE SUPPLIERS ENSURE SUPPLY RELIABILITY
- LNG SUPPORTS ENERGY SECURITY IN THE ABSENCE OF SIGNIFICANT DOMESTIC RESOURCES
- IMPORT INFRASTRUCTURE FACILITATES EFFICIENT RECEIVING AND DISTRIBUTION
MARKET DYNAMICS
- KEY DRIVERS
- CONSISTENT POWER SECTOR DEMAND SUSTAINS HIGH LNG IMPORT VOLUMES
- GOVERNMENT POLICIES EMPHASIZE DIVERSIFIED AND STABLE ENERGY SUPPLIES
- EXISTING TERMINAL CAPACITY SUPPORTS RELIABLE IMPORT OPERATIONS
- TRANSITION FROM COAL AND NUCLEAR REINFORCES LNG ROLE
- KEY RESTRAINTS
- ACCELERATED RENEWABLES AND EFFICIENCY MEASURES MAY MODERATE DEMAND
- GLOBAL PRICE VOLATILITY IMPACTS PROCUREMENT COSTS AND STRATEGIES
- COMPETITION FROM OTHER ASIAN BUYERS AFFECTS CARGO AVAILABILITY
- AGING INFRASTRUCTURE REQUIRES ONGOING MAINTENANCE AND UPGRADES
- KEY DRIVERS
STRATEGIC MARKET ANALYTICS
- KEY MARKET TRENDS
- JAPAN PURSUES DIVERSIFICATION OF SUPPLY SOURCES FOR RISK MANAGEMENT
- INCREASING INTEREST IN LOW-CARBON AND EMISSION-REDUCED LNG
- OPTIMIZATION OF CONTRACT PORTFOLIOS FOR FLEXIBILITY AND COST CONTROL
- INTEGRATION WITH HYDROGEN AND RENEWABLE ENERGY STRATEGIES EMERGES
- PORTER’S FIVE FORCES ANALYSIS
- BUYERS POWER
- SUPPLIERS POWER
- SUBSTITUTION
- NEW ENTRANTS
- INDUSTRY RIVALRY
- GROWTH PROSPECT MAPPING
- GROWTH PROSPECT MAPPING FOR JAPAN
- MARKET MATURITY ANALYSIS
- MARKET CONCENTRATION ANALYSIS
- VALUE CHAIN ANALYSIS
- EXPLORATION AND EXTRACTION
- LIQUEFACTION AND PROCESSING
- STORAGE AND TRANSPORTATION
- EXPORT AND DISTRIBUTION
- MARKETING AND SALES
- AFTER-SALES SERVICES
- KEY BUYING CRITERIA
- PRICE COMPETITIVENESS
- SUPPLY RELIABILITY
- QUALITY STANDARDS
- CONTRACT FLEXIBILITY
- FUTURE PROSPECTS OF LNG IN JAPAN
- TRADE
- EXPORTS
- IMPORTS
- LNG TERMINALS
- LIST OF LNG EXPORT TERMINALS
- REGULATORY FRAMEWORK AND COMPLIANCE BODIES
- KEY MARKET TRENDS
LIQUEFIED NATURAL GAS (LNG) MARKET BY LNG INFRASTRUCTURE
- LNG LIQUEFACTION PLANTS
- MARKET FORECAST FIGURE
- SEGMENT ANALYSIS
- LNG REGASIFICATION FACILITIES
- MARKET FORECAST FIGURE
- SEGMENT ANALYSIS
- LNG LIQUEFACTION PLANTS
LIQUEFIED NATURAL GAS (LNG) MARKET BY APPLICATION
- TRANSPORTATION
- MARKET FORECAST FIGURE
- SEGMENT ANALYSIS
- INDUSTRIAL FEEDSTOCK
- MARKET FORECAST FIGURE
- SEGMENT ANALYSIS
- POWER GENERATION
- MARKET FORECAST FIGURE
- SEGMENT ANALYSIS
- OTHER APPLICATIONS
- MARKET FORECAST FIGURE
- SEGMENT ANALYSIS
- TRANSPORTATION
LIQUEFIED NATURAL GAS (LNG) MARKET BY MODE OF SUPPLY
- TRUCK
- MARKET FORECAST FIGURE
- SEGMENT ANALYSIS
- TRANSSHIPMENT AND BUNKERING
- MARKET FORECAST FIGURE
- SEGMENT ANALYSIS
- PIPELINE AND RAIL
- MARKET FORECAST FIGURE
- SEGMENT ANALYSIS
- TRUCK
COMPETITIVE LANDSCAPE
- KEY STRATEGIC DEVELOPMENTS
- MERGERS & ACQUISITIONS
- PRODUCT LAUNCHES & DEVELOPMENTS
- PARTNERSHIPS & AGREEMENTS
- BUSINESS EXPANSIONS & DIVESTITURES
- COMPANY PROFILES
- JERA
- COMPANY OVERVIEW
- PRODUCT LIST
- STRENGTHS & CHALLENGES
- TOKYO GAS
- COMPANY OVERVIEW
- PRODUCT LIST
- STRENGTHS & CHALLENGES
- OSAKA GAS
- COMPANY OVERVIEW
- PRODUCT LIST
- STRENGTHS & CHALLENGES
- KANSAI ELECTRIC
- COMPANY OVERVIEW
- PRODUCT LIST
- STRENGTHS & CHALLENGES
- MITSUBISHI CORPORATION
- COMPANY OVERVIEW
- PRODUCT LIST
- STRENGTHS & CHALLENGES
- MITSUI & CO
- COMPANY OVERVIEW
- PRODUCT LIST
- STRENGTHS & CHALLENGES
- INPEX
- COMPANY OVERVIEW
- PRODUCT LIST
- STRENGTHS & CHALLENGES
- JERA
- KEY STRATEGIC DEVELOPMENTS
LIST OF TABLES
TABLE 1: MARKET SNAPSHOT – LIQUEFIED NATURAL GAS (LNG)
TABLE 2: LIQUEFIED NATURAL GAS (LNG) MARKET REGULATORY FRAMEWORK
TABLE 3: JAPAN NATURAL GAS PRODUCTION, 2022-2024 (IN EXAJOULES)
TABLE 4: JAPAN NATURAL GAS CONSUMPTION, 2022-2024 (IN EXAJOULES)
TABLE 5: JAPAN LNG EXPORTS, 2022-2024 (IN BILLION CUBIC METERS)
TABLE 6: JAPAN LNG IMPORTS, 2022-2024 (IN BILLION CUBIC METERS)
TABLE 7: MARKET BY LNG INFRASTRUCTURE, HISTORICAL YEARS, 2022-2024 (IN $ MILLION)
TABLE 8: MARKET BY LNG INFRASTRUCTURE, FORECAST YEARS, 2026-2034 (IN $ MILLION)
TABLE 9: MARKET BY APPLICATION, HISTORICAL YEARS, 2022-2024 (IN $ MILLION)
TABLE 10: MARKET BY APPLICATION, FORECAST YEARS, 2026-2034 (IN $ MILLION)
TABLE 11: MARKET BY MODE OF SUPPLY, HISTORICAL YEARS, 2022-2024 (IN $ MILLION)
TABLE 12: MARKET BY MODE OF SUPPLY, FORECAST YEARS, 2026-2034 (IN $ MILLION)
TABLE 13: KEY PLAYERS OPERATING IN THE JAPANESE MARKET
TABLE 14: LIST OF MERGERS & ACQUISITIONS
TABLE 15: LIST OF PRODUCT LAUNCHES & DEVELOPMENTS
TABLE 16: LIST OF PARTNERSHIPS & AGREEMENTS
TABLE 17: LIST OF BUSINESS EXPANSIONS & DIVESTITURES
LIST OF FIGURES
FIGURE 1: KEY MARKET TRENDS
FIGURE 2: PORTER’S FIVE FORCES ANALYSIS
FIGURE 3: GROWTH PROSPECT MAPPING FOR JAPAN
FIGURE 4: MARKET MATURITY ANALYSIS
FIGURE 5: MARKET CONCENTRATION ANALYSIS
FIGURE 6: VALUE CHAIN ANALYSIS
FIGURE 7: KEY BUYING CRITERIA
FIGURE 8: SEGMENT GROWTH POTENTIAL, BY LNG INFRASTRUCTURE, IN 2025
FIGURE 9: LNG LIQUEFACTION PLANTS MARKET SIZE, 2026-2034 (IN $ MILLION)
FIGURE 10: LNG REGASIFICATION FACILITIES MARKET SIZE, 2026-2034 (IN $ MILLION)
FIGURE 11: SEGMENT GROWTH POTENTIAL, BY APPLICATION, IN 2025
FIGURE 12: TRANSPORTATION MARKET SIZE, 2026-2034 (IN $ MILLION)
FIGURE 13: INDUSTRIAL FEEDSTOCK MARKET SIZE, 2026-2034 (IN $ MILLION)
FIGURE 14: POWER GENERATION MARKET SIZE, 2026-2034 (IN $ MILLION)
FIGURE 15: OTHER APPLICATIONS MARKET SIZE, 2026-2034 (IN $ MILLION)
FIGURE 16: SEGMENT GROWTH POTENTIAL, BY MODE OF SUPPLY, IN 2025
FIGURE 17: TRUCK MARKET SIZE, 2026-2034 (IN $ MILLION)
FIGURE 18: TRANSSHIPMENT AND BUNKERING MARKET SIZE, 2026-2034 (IN $ MILLION)
FIGURE 19: PIPELINE AND RAIL MARKET SIZE, 2026-2034 (IN $ MILLION)
FAQ’s
RELATED REPORTS
-

UNITED STATES AI-DRIVEN CLOUD MIGRATION SERVICES MARKET FORECAST 2026-2034
-

UNITED KINGDOM AI-DRIVEN CLOUD MIGRATION SERVICES MARKET FORECAST 2026-2034
-

UNITED ARAB EMIRATES AI-DRIVEN CLOUD MIGRATION SERVICES MARKET FORECAST 2026-2034
-

SOUTH KOREA AI-DRIVEN CLOUD MIGRATION SERVICES MARKET FORECAST 2026-2034
-

SINGAPORE AI-DRIVEN CLOUD MIGRATION SERVICES MARKET FORECAST 2026-2034
-

SAUDI ARABIA AI-DRIVEN CLOUD MIGRATION SERVICES MARKET FORECAST 2026-2034
-

AUSTRALIA AI-DRIVEN CLOUD MIGRATION SERVICES MARKET FORECAST 2026-2034
-

JAPAN AI-DRIVEN CLOUD MIGRATION SERVICES MARKET FORECAST 2026-2034
-

INDIA AI-DRIVEN CLOUD MIGRATION SERVICES MARKET FORECAST 2026-2034
-

CHINA AI-DRIVEN CLOUD MIGRATION SERVICES MARKET FORECAST 2026-2034