Indonesia Liquefied Natural Gas (LNG) Market by LNG Infrastructure (LNG Liquefaction Plants, LNG Regasification Facilities, LNG Shipping & Transportation) Market by Application (Transportation, Industrial Feedstock, Power Generation, Other Applications) Market by Mode of Supply (Truck, Transshipment and Bunkering, Pipeline and Rail)
INDONESIA LIQUEFIED NATURAL GAS (LNG) MARKET OVERVIEW
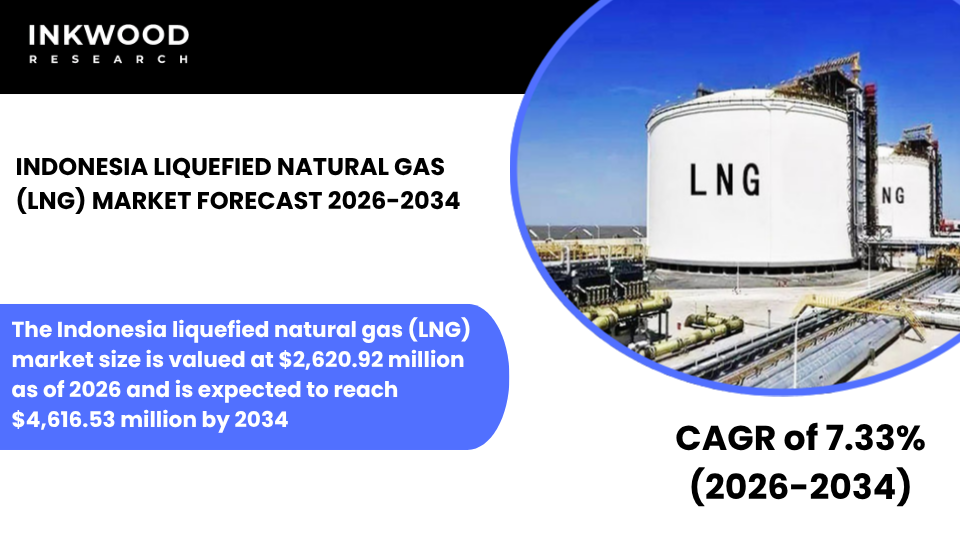
The Indonesia liquefied natural gas (LNG) market size is valued at $2,620.92 million as of 2026 and is expected to reach $4,616.53 million by 2034, progressing with a CAGR of 7.33% during the forecast years, 2026-2034.
Indonesia’s approach to liquefied natural gas has undergone a fundamental transformation as domestic energy needs increasingly take priority over export commitments. Historically recognized as a major LNG exporter, the country now redirects substantial volumes toward internal consumption to fuel its rapidly expanding economy. This strategic pivot reflects surging electricity demand across the archipelago, where millions of households and businesses require reliable power generation capacity.
According to the Ministry of Energy and Mineral Resources, the government actively implements policies that secure adequate domestic gas supplies while balancing international contractual obligations. Meanwhile, declining production from aging fields creates additional pressure to optimize available resources for national development priorities.
Power generation stands at the forefront of Indonesia’s domestic liquefied natural gas utilization strategy, particularly as the nation works to electrify remote island communities that lack grid connectivity. Gas-fired plants offer flexible generation that complements the intermittent output from growing renewable energy installations, thereby ensuring grid stability during demand peaks.
Furthermore, these facilities provide cleaner energy alternatives to coal-based systems, which align with the country’s environmental commitments and air quality improvement objectives. The electricity sector’s expanding appetite for natural gas directly influences how Indonesia allocates its production between domestic needs and export contracts, creating ongoing tension between revenue generation and energy security.
Infrastructure development emerges as both an enabler and constraint within Indonesia’s evolving natural gas market landscape. While the country possesses established liquefaction plants that have served export markets for decades, the regasification capacity needed to serve domestic consumption remains underdeveloped in many regions.
To Know More About This Report, Request a Free Sample Copy
Consequently, the government prioritizes investments in small-scale LNG facilities that can economically serve isolated communities and industrial zones beyond the reach of traditional pipeline networks. These distributed systems enable cost-effective delivery to areas where building extensive pipeline infrastructure would prove prohibitively expensive, thus expanding access while managing capital expenditure efficiently.
Industrial applications continue to drive significant demand for liquefied natural gas across Indonesia’s manufacturing and processing sectors. Chemical plants, particularly those producing fertilizers for the agricultural sector, depend on steady natural gas supplies as both fuel and power sources and essential feedstock for ammonia synthesis.
Similarly, manufacturers in the ceramics, glass, and metal processing industries increasingly adopt gas-based systems to reduce emissions while maintaining production efficiency. However, these industrial consumers face challenges when competing for supplies against the power generation sector, especially during periods when overall production cannot satisfy both domestic and export requirements simultaneously.
The transportation fuel segment presents emerging opportunities as Indonesia explores alternative solutions to reduce its dependence on imported petroleum products. Heavy-duty vehicles operating in the mining and logistics sectors have begun evaluating liquefied natural gas as a viable substitute for diesel, driven by potential cost savings and lower emissions.
Moreover, the maritime industry shows growing interest in LNG bunkering capabilities at major ports, particularly for vessels serving domestic inter-island routes. Nevertheless, the limited availability of refueling infrastructure currently restricts broader adoption across these transportation fuel applications, requiring coordinated investments from both public and private stakeholders to unlock the segment’s full potential.
Indonesia’s regulatory framework continues evolving to reflect the changing priorities around liquefied natural gas allocation and utilization. The government reviews existing long-term export contracts to determine how these agreements can be modified or renegotiated to better serve national interests without breaching international commitments.
Additionally, policymakers introduce domestic market obligations that require producers to dedicate specific volumes to local buyers before fulfilling export orders. These policy shifts aim to balance the country’s need for foreign exchange earnings from LNG exports against the imperative to provide affordable, reliable energy for economic development and social welfare improvements.
Truck-based distribution plays an increasingly vital role in delivering liquefied natural gas to consumers located beyond the reach of pipeline infrastructure. This mode of supply proves particularly valuable for serving industrial parks, remote power plants, and small-scale users across Indonesia’s vast island geography.
Specialized cryogenic tankers transport LNG from liquefaction facilities or regasification terminals to end-users, offering flexibility that fixed pipeline systems cannot match. However, this distribution approach entails higher per-unit costs compared to pipeline delivery, which influences pricing dynamics and market accessibility for smaller consumers.
The Indonesia liquefied natural gas (LNG) market is segmented into LNG infrastructure, application, and mode of supply. The application segment is further categorized into transportation, industrial feedstock, power generation, and other applications.
Power generation dominates Indonesia’s liquefied natural gas consumption landscape as the country accelerates its electrification efforts and works to reduce reliance on coal-fired capacity. Gas turbine plants provide the operational flexibility needed to balance Indonesia’s expanding renewable energy portfolio, ramping production up or down based on real-time grid requirements.
This capability becomes especially critical during dry seasons when hydroelectric output declines, requiring backup capacity to maintain system reliability. State-owned utility companies increasingly favor combined-cycle gas turbine technology for new installations, recognizing its superior fuel efficiency and lower emissions profile compared to conventional thermal plants.
Meanwhile, the government’s push to achieve universal electricity access by 2030 drives investment in small-scale gas-fired generation for off-grid communities, where diesel generators previously served as the primary power source. These distributed generation systems leverage locally available LNG supplies delivered by truck or small-scale vessels, creating new market opportunities while advancing social development objectives.
Some of the top players operating in the Indonesia liquefied natural gas (LNG) market include Pertamina, PT Badak LNG, Shell Plc, and BP, etc.
Pertamina operates as Indonesia’s state-owned energy company, managing diverse operations that span upstream oil and gas production, refining, petrochemicals, and downstream distribution networks. The company plays a central role in Indonesia’s transition toward greater domestic LNG utilization, operating regasification terminals and distribution infrastructure that serve power plants and industrial customers nationwide.
Pertamina’s business model integrates production assets with midstream and downstream capabilities, enabling end-to-end supply chain management from wellhead to consumer. Additionally, the company participates in international LNG trading activities while prioritizing domestic energy security objectives aligned with government policy directives. Through strategic partnerships with global energy firms, Pertamina continues expanding its technical capabilities and operational efficiency across the entire liquefied natural gas value chain.
REPORT SYNOPSIS
| REPORT SCOPE | DETAILS |
|---|---|
| Market Forecast Years | 2026-2034 |
| Base Year | 2025 |
| Market Historical Years | 2022-2024 |
| Forecast Units | Revenue ($ Million) |
| Segments Analyzed | LNG Infrastructure, Application, and Mode of Supply |
| Country Analyzed | Indonesia |
| Companies Analyzed | Baker Hughes, Engie SA, Eni SpA, Linde Plc, Shell Plc, TotalEnergies SE, Pertamina, PT Badak LNG, BP, Inpex, PT Donggi-Senoro LNG (DSLNG), MedcoEnergi, Mitsubishi Corporation, Kogas, CNOOC (CNOOC International), Petronas |
TABLE OF CONTENTS
RESEARCH SCOPE & METHODOLOGY
- STUDY OBJECTIVES
- METHODOLOGY
- ASSUMPTIONS & LIMITATIONS
EXECUTIVE SUMMARY
- MARKET SIZE, SHARE & ESTIMATES
- MARKET OVERVIEW
- SCOPE OF STUDY
- CRISIS SCENARIO ANALYSIS
- MAJOR MARKET FINDINGS
- INDONESIA PRIORITIZES DOMESTIC LNG CONSUMPTION OVER EXPORTS TO ADDRESS SURGING INTERNAL ENERGY NEEDS
- THE COUNTRY SHIFTS FROM NET EXPORTER TOWARD INCREASING RELIANCE ON DOMESTIC LNG UTILIZATION
- POWER SECTOR DEMAND DRIVES SIGNIFICANT GROWTH IN LOCAL LNG REQUIREMENTS
- GOVERNMENT POLICIES EMPHASIZE ENERGY SECURITY THROUGH REDIRECTED GAS SUPPLIES
MARKET DYNAMICS
- KEY DRIVERS
- RAPIDLY INCREASING DOMESTIC POWER AND INDUSTRIAL DEMAND BOOSTS LNG CONSUMPTION
- DECLINING PIPELINE GAS PRODUCTION INCREASES DEPENDENCE ON LNG FOR ENERGY SUPPLY
- EXPANSION OF SMALL-SCALE LNG INFRASTRUCTURE IMPROVES ACCESS TO REMOTE AREAS
- GOVERNMENT INITIATIVES PROMOTE DOMESTIC UTILIZATION TO SUPPORT ECONOMIC DEVELOPMENT
- KEY RESTRAINTS
- REDUCED EXPORT QUOTAS LIMIT INTERNATIONAL MARKET PRESENCE AND REVENUES
- INFRASTRUCTURE DEVELOPMENT TIMELINES CONSTRAIN EFFICIENT DOMESTIC DISTRIBUTION
- VOLATILE GLOBAL LNG PRICES IMPACT ECONOMIC VIABILITY OF IMPORTS WHEN NEEDED
- PRODUCTION DECLINES CREATE CHALLENGES IN MEETING BOTH DOMESTIC AND CONTRACTUAL OBLIGATIONS
- KEY DRIVERS
STRATEGIC MARKET ANALYTICS
- KEY MARKET TRENDS
- INDONESIA REDIRECTS LNG VOLUMES FROM EXPORTS TO DOMESTIC POWER GENERATION
- GOVERNMENT REVIEWS LONG-TERM CONTRACTS TO ALIGN WITH NATIONAL ENERGY PRIORITIES
- EXPANSION OF REGASIFICATION AND DISTRIBUTION INFRASTRUCTURE SUPPORTS LOCAL DEMAND GROWTH
- SHIFT TOWARD RESOURCE NATIONALISM STRENGTHENS DOMESTIC ENERGY SECURITY FOCUS
- PORTER’S FIVE FORCES ANALYSIS
- BUYERS POWER
- SUPPLIERS POWER
- SUBSTITUTION
- NEW ENTRANTS
- INDUSTRY RIVALRY
- GROWTH PROSPECT MAPPING
- GROWTH PROSPECT MAPPING FOR THE INDONESIA
- MARKET MATURITY ANALYSIS
- MARKET CONCENTRATION ANALYSIS
- VALUE CHAIN ANALYSIS
- EXPLORATION AND EXTRACTION
- LIQUEFACTION AND PROCESSING
- STORAGE AND TRANSPORTATION
- EXPORT AND DISTRIBUTION
- MARKETING AND SALES
- AFTER-SALES SERVICES
- KEY BUYING CRITERIA
- PRICE COMPETITIVENESS
- SUPPLY RELIABILITY
- QUALITY STANDARDS
- CONTRACT FLEXIBILITY
- FUTURE PROSPECTS OF LNG IN THE INDONESIA
- TRADE
- EXPORTS
- IMPORTS
- LNG TERMINALS
- LIST OF LNG EXPORT TERMINALS
- REGULATORY FRAMEWORK AND COMPLIANCE BODIES
- KEY MARKET TRENDS
LIQUEFIED NATURAL GAS (LNG) MARKET BY LNG INFRASTRUCTURE
- LNG LIQUEFACTION PLANTS
- MARKET FORECAST FIGURE
- SEGMENT ANALYSIS
- LNG REGASIFICATION FACILITIES
- MARKET FORECAST FIGURE
- SEGMENT ANALYSIS
- LNG LIQUEFACTION PLANTS
LIQUEFIED NATURAL GAS (LNG) MARKET BY APPLICATION
- TRANSPORTATION
- MARKET FORECAST FIGURE
- SEGMENT ANALYSIS
- INDUSTRIAL FEEDSTOCK
- MARKET FORECAST FIGURE
- SEGMENT ANALYSIS
- POWER GENERATION
- MARKET FORECAST FIGURE
- SEGMENT ANALYSIS
- OTHER APPLICATIONS
- MARKET FORECAST FIGURE
- SEGMENT ANALYSIS
- TRANSPORTATION
LIQUEFIED NATURAL GAS (LNG) MARKET BY MODE OF SUPPLY
- TRUCK
- MARKET FORECAST FIGURE
- SEGMENT ANALYSIS
- TRANSSHIPMENT AND BUNKERING
- MARKET FORECAST FIGURE
- SEGMENT ANALYSIS
- PIPELINE AND RAIL
- MARKET FORECAST FIGURE
- SEGMENT ANALYSIS
- TRUCK
COMPETITIVE LANDSCAPE
- KEY STRATEGIC DEVELOPMENTS
- MERGERS & ACQUISITIONS
- PRODUCT LAUNCHES & DEVELOPMENTS
- PARTNERSHIPS & AGREEMENTS
- BUSINESS EXPANSIONS & DIVESTITURES
- COMPANY PROFILES
- BAKER HUGHES
- COMPANY OVERVIEW
- PRODUCT LIST
- STRENGTHS & CHALLENGES
- ENGIE SA
- COMPANY OVERVIEW
- PRODUCT LIST
- STRENGTHS & CHALLENGES
- ENI SPA
- COMPANY OVERVIEW
- PRODUCT LIST
- STRENGTHS & CHALLENGES
- LINDE PLC
- COMPANY OVERVIEW
- PRODUCT LIST
- STRENGTHS & CHALLENGES
- SHELL PLC
- COMPANY OVERVIEW
- PRODUCT LIST
- STRENGTHS & CHALLENGES
- TOTALENERGIES SE
- COMPANY OVERVIEW
- PRODUCT LIST
- STRENGTHS & CHALLENGES
- PERTAMINA
- COMPANY OVERVIEW
- PRODUCT LIST
- STRENGTHS & CHALLENGES
- PT BADAK LNG
- COMPANY OVERVIEW
- PRODUCT LIST
- STRENGTHS & CHALLENGES
- BP
- COMPANY OVERVIEW
- PRODUCT LIST
- STRENGTHS & CHALLENGES
- INPEX
- COMPANY OVERVIEW
- PRODUCT LIST
- STRENGTHS & CHALLENGES
- PT DONGGI-SENORO LNG (DSLNG)
- COMPANY OVERVIEW
- PRODUCT LIST
- STRENGTHS & CHALLENGES
- MEDCOENERGI
- COMPANY OVERVIEW
- PRODUCT LIST
- STRENGTHS & CHALLENGES
- MITSUBISHI CORPORATION
- COMPANY OVERVIEW
- PRODUCT LIST
- STRENGTHS & CHALLENGES
- KOGAS
- COMPANY OVERVIEW
- PRODUCT LIST
- STRENGTHS & CHALLENGES
- CNOOC (CNOOC INTERNATIONAL)
- COMPANY OVERVIEW
- PRODUCT LIST
- STRENGTHS & CHALLENGES
- PETRONAS
- COMPANY OVERVIEW
- PRODUCT LIST
- STRENGTHS & CHALLENGES
- BAKER HUGHES
- KEY STRATEGIC DEVELOPMENTS
LIST OF TABLES
TABLE 1: MARKET SNAPSHOT – LIQUEFIED NATURAL GAS (LNG)
TABLE 2: LIQUEFIED NATURAL GAS (LNG) MARKET REGULATORY FRAMEWORK
TABLE 3: INDONESIA NATURAL GAS PRODUCTION, 2022-2024 (IN EXAJOULES)
TABLE 4: INDONESIA NATURAL GAS CONSUMPTION, 2022-2024 (IN EXAJOULES)
TABLE 5: INDONESIA LNG EXPORTS, 2022-2024 (IN BILLION CUBIC METERS)
TABLE 6: INDONESIA LNG IMPORTS, 2022-2024 (IN BILLION CUBIC METERS)
TABLE 7: MARKET BY LNG INFRASTRUCTURE, HISTORICAL YEARS, 2022-2024 (IN $ MILLION)
TABLE 8: MARKET BY LNG INFRASTRUCTURE, FORECAST YEARS, 2026-2034 (IN $ MILLION)
TABLE 9: MARKET BY APPLICATION, HISTORICAL YEARS, 2022-2024 (IN $ MILLION)
TABLE 10: MARKET BY APPLICATION, FORECAST YEARS, 2026-2034 (IN $ MILLION)
TABLE 11: MARKET BY MODE OF SUPPLY, HISTORICAL YEARS, 2022-2024 (IN $ MILLION)
TABLE 12: MARKET BY MODE OF SUPPLY, FORECAST YEARS, 2026-2034 (IN $ MILLION)
TABLE 13: KEY PLAYERS OPERATING IN THE INDONESIAN MARKET
TABLE 14: LIST OF MERGERS & ACQUISITIONS
TABLE 15: LIST OF PRODUCT LAUNCHES & DEVELOPMENTS
TABLE 16: LIST OF PARTNERSHIPS & AGREEMENTS
TABLE 17: LIST OF BUSINESS EXPANSIONS & DIVESTITURES
LIST OF FIGURES
FIGURE 1: KEY MARKET TRENDS
FIGURE 2: PORTER’S FIVE FORCES ANALYSIS
FIGURE 3: GROWTH PROSPECT MAPPING FOR INDONESIA
FIGURE 4: MARKET MATURITY ANALYSIS
FIGURE 5: MARKET CONCENTRATION ANALYSIS
FIGURE 6: VALUE CHAIN ANALYSIS
FIGURE 7: KEY BUYING CRITERIA
FIGURE 8: SEGMENT GROWTH POTENTIAL, BY LNG INFRASTRUCTURE, IN 2025
FIGURE 9: LNG LIQUEFACTION PLANTS MARKET SIZE, 2026-2034 (IN $ MILLION)
FIGURE 10: LNG REGASIFICATION FACILITIES MARKET SIZE, 2026-2034 (IN $ MILLION)
FIGURE 11: SEGMENT GROWTH POTENTIAL, BY APPLICATION, IN 2025
FIGURE 12: TRANSPORTATION MARKET SIZE, 2026-2034 (IN $ MILLION)
FIGURE 13: INDUSTRIAL FEEDSTOCK MARKET SIZE, 2026-2034 (IN $ MILLION)
FIGURE 14: POWER GENERATION MARKET SIZE, 2026-2034 (IN $ MILLION)
FIGURE 15: OTHER APPLICATIONS MARKET SIZE, 2026-2034 (IN $ MILLION)
FIGURE 16: SEGMENT GROWTH POTENTIAL, BY MODE OF SUPPLY, IN 2025
FIGURE 17: TRUCK MARKET SIZE, 2026-2034 (IN $ MILLION)
FIGURE 18: TRANSSHIPMENT AND BUNKERING MARKET SIZE, 2026-2034 (IN $ MILLION)
FIGURE 19: PIPELINE AND RAIL MARKET SIZE, 2026-2034 (IN $ MILLION)
FAQ’s
RELATED REPORTS
-

UNITED STATES AI-DRIVEN CLOUD MIGRATION SERVICES MARKET FORECAST 2026-2034
-

UNITED KINGDOM AI-DRIVEN CLOUD MIGRATION SERVICES MARKET FORECAST 2026-2034
-

UNITED ARAB EMIRATES AI-DRIVEN CLOUD MIGRATION SERVICES MARKET FORECAST 2026-2034
-

SOUTH KOREA AI-DRIVEN CLOUD MIGRATION SERVICES MARKET FORECAST 2026-2034
-

SINGAPORE AI-DRIVEN CLOUD MIGRATION SERVICES MARKET FORECAST 2026-2034
-

SAUDI ARABIA AI-DRIVEN CLOUD MIGRATION SERVICES MARKET FORECAST 2026-2034
-

AUSTRALIA AI-DRIVEN CLOUD MIGRATION SERVICES MARKET FORECAST 2026-2034
-

JAPAN AI-DRIVEN CLOUD MIGRATION SERVICES MARKET FORECAST 2026-2034
-

INDIA AI-DRIVEN CLOUD MIGRATION SERVICES MARKET FORECAST 2026-2034
-

CHINA AI-DRIVEN CLOUD MIGRATION SERVICES MARKET FORECAST 2026-2034