India Liquefied Natural Gas (LNG) Market by LNG Infrastructure (LNG Liquefaction Plants, LNG Regasification Facilities, LNG Shipping & Transportation) Market by Application (Transportation, Industrial Feedstock, Power Generation, Other Applications) Market by Mode of Supply (Truck, Transshipment and Bunkering, Pipeline and Rail)
INDIA LIQUEFIED NATURAL GAS (LNG) MARKET OVERVIEW
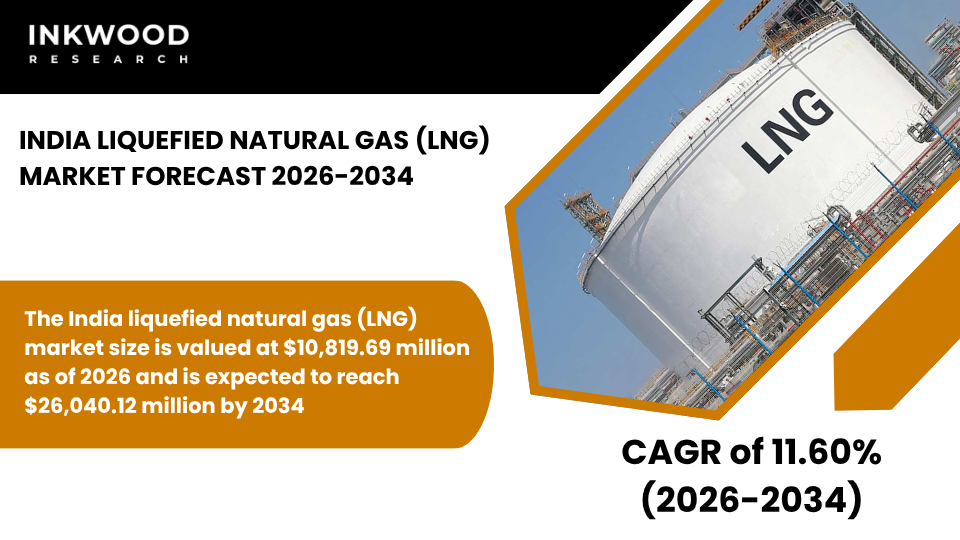
The India liquefied natural gas (LNG) market size is valued at $10,819.69 million as of 2026 and is expected to reach $26,040.12 million by 2034, progressing with a CAGR of 11.60% during the forecast years, 2026-2034.
Accelerating economic growth fuels India’s expanding demand for liquefied natural gas across multiple sectors. Industrial activity intensifies as manufacturing capacity scales to meet domestic and export requirements. Moreover, power generation facilities increasingly rely on natural gas to complement coal-based systems and renewable sources.
According to the Ministry of Petroleum and Natural Gas, the government actively promotes gas infrastructure development through policy initiatives and investment incentives. Fertilizer manufacturers particularly depend on steady supplies to maintain agricultural productivity and food security. Consequently, liquefied natural gas serves as a critical bridge fuel supporting the nation’s transition toward cleaner energy solutions.
India’s regasification infrastructure continues expanding along both eastern and western coastlines to accommodate rising import volumes. Major terminals operate in Gujarat, Maharashtra, Kerala, and Tamil Nadu, processing international cargoes for domestic distribution. Accordingly, the Petroleum and Natural Gas Regulatory Board oversees terminal operations and ensures compliance with safety and environmental standards.
Pipeline networks extending from coastal facilities deliver gas to industrial clusters, city gas distribution networks, and power plants. Additionally, floating storage regasification units provide flexible capacity during the construction of permanent terminal facilities. Storage capabilities at these installations enable operators to manage seasonal demand fluctuations and price volatility effectively.
Strategic sourcing arrangements characterize India’s approach to securing reliable liquefied natural gas supplies for the natural gas market. Long-term contracts with Middle Eastern producers provide foundational volumes at predetermined prices and delivery schedules. Furthermore, agreements with suppliers in the United States, Australia, and Africa diversify the supply portfolio and reduce geopolitical risks.
To Know More About This Report, Request a Free Sample Copy
Spot market purchases supplement contracted volumes when domestic demand spikes or pricing becomes favorable. This balanced procurement strategy enhances energy security while maintaining cost competitiveness across applications. Importers continuously evaluate emerging supply sources to optimize their portfolio composition and contract terms.
Power generation represents a substantial application segment within India’s energy infrastructure landscape. Gas-fired plants deliver flexible generation capacity that balances intermittent renewable output from solar and wind installations. During peak electricity demand periods, these facilities quickly ramp production to prevent grid instability and blackouts. Combined-cycle gas turbine technology achieves superior thermal efficiency compared to conventional coal-fired units.
On the other hand, coastal states benefit from proximity to regasification terminals, reducing transportation costs and delivery timeframes. Electricity distribution companies increasingly incorporate natural gas into their fuel mix to meet environmental compliance requirements. However, competitive pricing against coal and hydroelectric power influences operational dispatch decisions and capacity utilization rates.
Industrial feedstock consumption drives significant volumes across India’s manufacturing and chemical sectors. Fertilizer plants utilize natural gas as both fuel and feedstock for ammonia and urea production processes. This application directly supports agricultural productivity by ensuring adequate fertilizer availability during critical planting seasons.
Additionally, petrochemical manufacturers depend on gas supplies for producing plastics, polymers, and various chemical intermediates. Steel mills gradually adopt gas-based direct reduced iron processes to lower carbon emissions and improve product quality. The ceramic and glass industries similarly transition toward cleaner energy alternatives for high-temperature operations. Consequently, industrial demand patterns directly influence import planning and terminal capacity expansion decisions.
Transportation fuel applications emerge as a promising growth segment within the liquefied natural gas ecosystem. Commercial vehicle operators explore LNG as a cost-effective alternative to diesel for long-haul trucking operations. This shift reduces fuel expenses while simultaneously lowering particulate emissions and air pollution in urban areas.
Further, marine vessels serving coastal shipping routes increasingly consider LNG bunkering to comply with international emission regulations. However, limited fueling infrastructure currently constrains widespread adoption across the transportation sector. Investments in highway refueling stations and port bunkering facilities will determine future penetration rates. Aligning with this, fleet operators carefully evaluate the total cost of ownership, including vehicle conversion expenses and fuel availability considerations.
Pipeline distribution systems transport the majority of regasified liquefied natural gas from coastal terminals to consumption centers nationwide. These networks span thousands of kilometers, connecting industrial zones, power plants, and city gas distribution networks. Compression stations maintain adequate pressure throughout the system, ensuring consistent delivery to diverse end users.
The mode of supply infrastructure continues expanding to reach previously underserved states and regions. Trunk pipeline projects under development will enhance connectivity between eastern and western supply corridors. Smart monitoring systems improve operational efficiency, detect leaks promptly, and optimize flow management across the integrated network.
The India liquefied natural gas (LNG) market is segmented into LNG infrastructure, application, and mode of supply. The mode of supply segment is further categorized into truck, transshipment and bunkering, and pipeline and rail.
Pipeline and rail systems dominate the distribution landscape due to their cost-effectiveness for large-volume, long-distance transportation. Trunk pipelines carry regasified product from coastal terminals deep into the interior regions where major consumption centers operate. These dedicated networks ensure a continuous supply to anchor customers like power plants and fertilizer factories. Grid interconnections between regional pipeline systems enhance flexibility and enable efficient resource allocation during demand variations.
Railway tank car transport serves locations beyond pipeline reach, particularly in remote industrial areas. However, this mode requires specialized loading and unloading facilities at both origin and destination points. Regulatory frameworks govern safety standards, operational protocols, and emergency response procedures for both transportation modes. Investments in pipeline expansion and railway infrastructure upgrades continue to strengthen the distribution backbone supporting market growth.
Some of the top players operating in the India liquefied natural gas (LNG) market include Petronet LNG, GAIL India, Indian Oil Corporation, and Reliance Industries, etc.
Petronet LNG operates as India’s largest liquefied natural gas importer and regasification company, headquartered in New Delhi. The company manages major coastal terminals, including the Dahej facility in Gujarat and the Kochi terminal in Kerala. These installations process imported cargoes and deliver regasified product through extensive pipeline connections to industrial and commercial customers. Petronet LNG maintains long-term supply agreements with international producers across Qatar, the United States, and Australia.
The company’s business model integrates terminal operations with strategic sourcing and wholesale distribution capabilities. The company emphasizes operational excellence, safety performance, and capacity optimization to serve India’s growing energy requirements. Additionally, Petronet LNG explores opportunities in small-scale liquefaction, virtual pipelines, and downstream city gas distribution to expand its market presence and service offerings.
REPORT SYNOPSIS
| REPORT SCOPE | DETAILS |
|---|---|
| Market Forecast Years | 2026-2034 |
| Base Year | 2025 |
| Market Historical Years | 2022-2024 |
| Forecast Units | Revenue ($ Million) |
| Segments Analyzed | LNG Infrastructure, Application, and Mode of Supply |
| Country Analyzed | India |
| Companies Analyzed | Petronet LNG, GAIL India, Indian Oil Corporation, Shell India, Reliance Industries, Adani Total Gas, Bharat Petroleum |
TABLE OF CONTENTS
RESEARCH SCOPE & METHODOLOGY
- STUDY OBJECTIVES
- METHODOLOGY
- ASSUMPTIONS & LIMITATIONS
EXECUTIVE SUMMARY
- MARKET SIZE, SHARE & ESTIMATES
- MARKET OVERVIEW
- SCOPE OF STUDY
- CRISIS SCENARIO ANALYSIS
- MAJOR MARKET FINDINGS
- INDIA EXPANDS LNG IMPORTS TO SUPPORT RAPID ECONOMIC GROWTH AND CLEAN ENERGY GOALS
- GROWING REGASIFICATION INFRASTRUCTURE ENHANCES ACCESS TO GLOBAL SUPPLIES
- LNG PLAYS A KEY ROLE IN POWER GENERATION AND INDUSTRIAL APPLICATIONS
- DIVERSIFIED SOURCING STRENGTHENS ENERGY SECURITY
MARKET DYNAMICS
- KEY DRIVERS
- RISING NATURAL GAS DEMAND FROM POWER AND FERTILIZER SECTORS BOOSTS IMPORTS
- GOVERNMENT INITIATIVES PROMOTE GAS INFRASTRUCTURE EXPANSION AND ADOPTION
- ECONOMIC DEVELOPMENT AND URBANIZATION DRIVE HIGHER CONSUMPTION
- POLICY SUPPORT FOR CLEANER FUELS ENCOURAGES LNG UTILIZATION
- KEY RESTRAINTS
- PRICE SENSITIVITY LIMITS VOLUME GROWTH DURING HIGH MARKET PERIODS
- INFRASTRUCTURE DEVELOPMENT TIMELINES CONSTRAIN RAPID EXPANSION
- COMPETITION FROM OTHER ASIAN IMPORTERS AFFECTS PROCUREMENT
- DOMESTIC PRODUCTION EFFORTS MAY MODERATE IMPORT DEPENDENCE
- KEY DRIVERS
STRATEGIC MARKET ANALYTICS
- KEY MARKET TRENDS
- INDIA SEEKS LONG-TERM CONTRACTS FOR SUPPLY STABILITY AND AFFORDABILITY
- EXPANSION OF COASTAL AND INLAND REGASIFICATION TERMINALS CONTINUES
- FOCUS ON DIVERSIFYING SUPPLY SOURCES TO MITIGATE RISKS
- INCREASING EMPHASIS ON SUSTAINABLE AND LOW-EMISSION LNG OPTIONS
- PORTER’S FIVE FORCES ANALYSIS
- BUYERS POWER
- SUPPLIERS POWER
- SUBSTITUTION
- NEW ENTRANTS
- INDUSTRY RIVALRY
- GROWTH PROSPECT MAPPING
- GROWTH PROSPECT MAPPING FOR INDIA
- MARKET MATURITY ANALYSIS
- MARKET CONCENTRATION ANALYSIS
- VALUE CHAIN ANALYSIS
- EXPLORATION AND EXTRACTION
- LIQUEFACTION AND PROCESSING
- STORAGE AND TRANSPORTATION
- EXPORT AND DISTRIBUTION
- MARKETING AND SALES
- AFTER-SALES SERVICES
- KEY BUYING CRITERIA
- PRICE COMPETITIVENESS
- SUPPLY RELIABILITY
- QUALITY STANDARDS
- CONTRACT FLEXIBILITY
- FUTURE PROSPECTS OF LNG IN INDIA
- TRADE
- EXPORTS
- IMPORTS
- LNG TERMINALS
- LIST OF LNG EXPORT TERMINALS
- REGULATORY FRAMEWORK AND COMPLIANCE BODIES
- KEY MARKET TRENDS
LIQUEFIED NATURAL GAS (LNG) MARKET BY LNG INFRASTRUCTURE
- LNG LIQUEFACTION PLANTS
- MARKET FORECAST FIGURE
- SEGMENT ANALYSIS
- LNG REGASIFICATION FACILITIES
- MARKET FORECAST FIGURE
- SEGMENT ANALYSIS
- LNG LIQUEFACTION PLANTS
LIQUEFIED NATURAL GAS (LNG) MARKET BY APPLICATION
- TRANSPORTATION
- MARKET FORECAST FIGURE
- SEGMENT ANALYSIS
- INDUSTRIAL FEEDSTOCK
- MARKET FORECAST FIGURE
- SEGMENT ANALYSIS
- POWER GENERATION
- MARKET FORECAST FIGURE
- SEGMENT ANALYSIS
- OTHER APPLICATIONS
- MARKET FORECAST FIGURE
- SEGMENT ANALYSIS
- TRANSPORTATION
LIQUEFIED NATURAL GAS (LNG) MARKET BY MODE OF SUPPLY
- TRUCK
- MARKET FORECAST FIGURE
- SEGMENT ANALYSIS
- TRANSSHIPMENT AND BUNKERING
- MARKET FORECAST FIGURE
- SEGMENT ANALYSIS
- PIPELINE AND RAIL
- MARKET FORECAST FIGURE
- SEGMENT ANALYSIS
- TRUCK
COMPETITIVE LANDSCAPE
- KEY STRATEGIC DEVELOPMENTS
- MERGERS & ACQUISITIONS
- PRODUCT LAUNCHES & DEVELOPMENTS
- PARTNERSHIPS & AGREEMENTS
- BUSINESS EXPANSIONS & DIVESTITURES
- COMPANY PROFILES
- PETRONET LNG
- COMPANY OVERVIEW
- PRODUCT LIST
- STRENGTHS & CHALLENGES
- GAIL INDIA
- COMPANY OVERVIEW
- PRODUCT LIST
- STRENGTHS & CHALLENGES
- INDIAN OIL CORPORATION
- COMPANY OVERVIEW
- PRODUCT LIST
- STRENGTHS & CHALLENGES
- SHELL INDIA
- COMPANY OVERVIEW
- PRODUCT LIST
- STRENGTHS & CHALLENGES
- RELIANCE INDUSTRIES
- COMPANY OVERVIEW
- PRODUCT LIST
- STRENGTHS & CHALLENGES
- ADANI TOTAL GAS
- COMPANY OVERVIEW
- PRODUCT LIST
- STRENGTHS & CHALLENGES
- BHARAT PETROLEUM
- COMPANY OVERVIEW
- PRODUCT LIST
- STRENGTHS & CHALLENGES
- PETRONET LNG
- KEY STRATEGIC DEVELOPMENTS
LIST OF TABLES
TABLE 1: MARKET SNAPSHOT – LIQUEFIED NATURAL GAS (LNG)
TABLE 2: LIQUEFIED NATURAL GAS (LNG) MARKET REGULATORY FRAMEWORK
TABLE 3: INDIA NATURAL GAS PRODUCTION, 2022-2024 (IN EXAJOULES)
TABLE 4: INDIA NATURAL GAS CONSUMPTION, 2022-2024 (IN EXAJOULES)
TABLE 5: INDIA LNG EXPORTS, 2022-2024 (IN BILLION CUBIC METERS)
TABLE 6: INDIA LNG IMPORTS, 2022-2024 (IN BILLION CUBIC METERS)
TABLE 7: MARKET BY LNG INFRASTRUCTURE, HISTORICAL YEARS, 2022-2024 (IN $ MILLION)
TABLE 8: MARKET BY LNG INFRASTRUCTURE, FORECAST YEARS, 2026-2034 (IN $ MILLION)
TABLE 9: MARKET BY APPLICATION, HISTORICAL YEARS, 2022-2024 (IN $ MILLION)
TABLE 10: MARKET BY APPLICATION, FORECAST YEARS, 2026-2034 (IN $ MILLION)
TABLE 11: MARKET BY MODE OF SUPPLY, HISTORICAL YEARS, 2022-2024 (IN $ MILLION)
TABLE 12: MARKET BY MODE OF SUPPLY, FORECAST YEARS, 2026-2034 (IN $ MILLION)
TABLE 13: KEY PLAYERS OPERATING IN THE INDIAN MARKET
TABLE 14: LIST OF MERGERS & ACQUISITIONS
TABLE 15: LIST OF PRODUCT LAUNCHES & DEVELOPMENTS
TABLE 16: LIST OF PARTNERSHIPS & AGREEMENTS
TABLE 17: LIST OF BUSINESS EXPANSIONS & DIVESTITURES
LIST OF FIGURES
FIGURE 1: KEY MARKET TRENDS
FIGURE 2: PORTER’S FIVE FORCES ANALYSIS
FIGURE 3: GROWTH PROSPECT MAPPING FOR INDIA
FIGURE 4: MARKET MATURITY ANALYSIS
FIGURE 5: MARKET CONCENTRATION ANALYSIS
FIGURE 6: VALUE CHAIN ANALYSIS
FIGURE 7: KEY BUYING CRITERIA
FIGURE 8: SEGMENT GROWTH POTENTIAL, BY LNG INFRASTRUCTURE, IN 2025
FIGURE 9: LNG LIQUEFACTION PLANTS MARKET SIZE, 2026-2034 (IN $ MILLION)
FIGURE 10: LNG REGASIFICATION FACILITIES MARKET SIZE, 2026-2034 (IN $ MILLION)
FIGURE 11: SEGMENT GROWTH POTENTIAL, BY APPLICATION, IN 2025
FIGURE 12: TRANSPORTATION MARKET SIZE, 2026-2034 (IN $ MILLION)
FIGURE 13: INDUSTRIAL FEEDSTOCK MARKET SIZE, 2026-2034 (IN $ MILLION)
FIGURE 14: POWER GENERATION MARKET SIZE, 2026-2034 (IN $ MILLION)
FIGURE 15: OTHER APPLICATIONS MARKET SIZE, 2026-2034 (IN $ MILLION)
FIGURE 16: SEGMENT GROWTH POTENTIAL, BY MODE OF SUPPLY, IN 2025
FIGURE 17: TRUCK MARKET SIZE, 2026-2034 (IN $ MILLION)
FIGURE 18: TRANSSHIPMENT AND BUNKERING MARKET SIZE, 2026-2034 (IN $ MILLION)
FIGURE 19: PIPELINE AND RAIL MARKET SIZE, 2026-2034 (IN $ MILLION)
FAQ’s
RELATED REPORTS
-

UNITED STATES AI-DRIVEN CLOUD MIGRATION SERVICES MARKET FORECAST 2026-2034
-

UNITED KINGDOM AI-DRIVEN CLOUD MIGRATION SERVICES MARKET FORECAST 2026-2034
-

UNITED ARAB EMIRATES AI-DRIVEN CLOUD MIGRATION SERVICES MARKET FORECAST 2026-2034
-

SOUTH KOREA AI-DRIVEN CLOUD MIGRATION SERVICES MARKET FORECAST 2026-2034
-

SINGAPORE AI-DRIVEN CLOUD MIGRATION SERVICES MARKET FORECAST 2026-2034
-

SAUDI ARABIA AI-DRIVEN CLOUD MIGRATION SERVICES MARKET FORECAST 2026-2034
-

AUSTRALIA AI-DRIVEN CLOUD MIGRATION SERVICES MARKET FORECAST 2026-2034
-

JAPAN AI-DRIVEN CLOUD MIGRATION SERVICES MARKET FORECAST 2026-2034
-

INDIA AI-DRIVEN CLOUD MIGRATION SERVICES MARKET FORECAST 2026-2034
-

CHINA AI-DRIVEN CLOUD MIGRATION SERVICES MARKET FORECAST 2026-2034