Global Solar Encapsulation Market by Material Type (Ethylene Vinyl Acetate (EVA), Polyolefin Elastomers (POE), Polyvinyl Butyral (PVB), Silicone & Ionomer, Other Material Types) Market by Technology (Module Construction) (Glass-Backsheet, Glass-Glass (Double Glass), Building-Integrated Photovoltaics (BIPV)) Market by Application (Photovoltaics (PV) (Utility-Scale, Commercial & Industrial (C&I), Residential), Transportation & Mobility, Consumer Electronics)
GLOBAL SOLAR ENCAPSULATION MARKET OVERVIEW
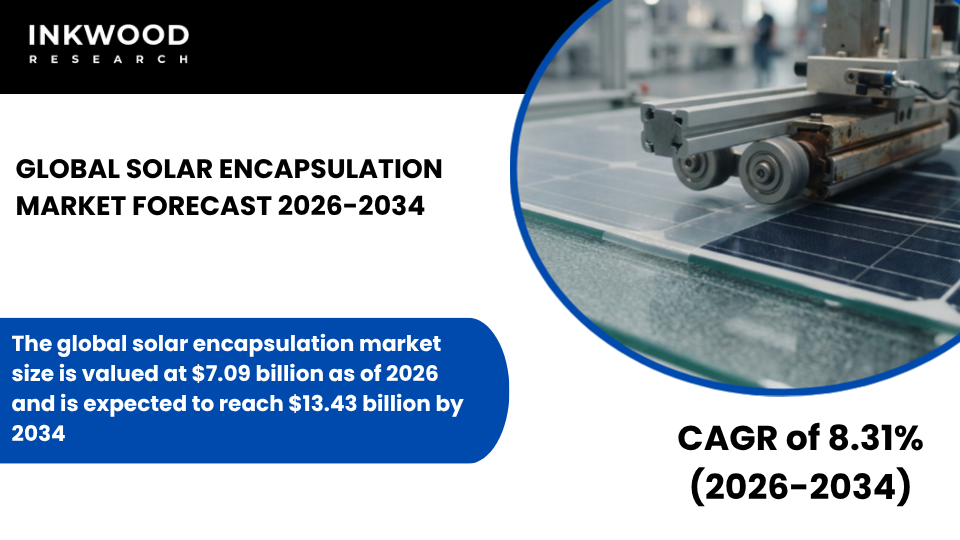
The global solar encapsulation market size is valued at $7.09 billion as of 2026 and is expected to reach $13.43 billion by 2034, growing at a CAGR of 8.31% during the forecast period 2026-2034. The base year considered for the study is 2025, and the forecast period is between 2026 and 2034. The market study has also analyzed the crisis impact on the solar encapsulation market qualitatively as well as quantitatively.
Solar encapsulation refers to the protective material layer that surrounds photovoltaic cells within solar modules. These encapsulants serve critical functions in preserving module integrity and performance. They shield sensitive crystalline silicon solar cells from environmental factors like moisture, UV radiation, and mechanical stress.
Moreover, encapsulation materials must maintain optical clarity to maximize light transmission while providing electrical insulation. Ethylene-vinyl acetate remains the dominant material choice, though alternatives like polyolefin elastomers and thermoplastic polyurethane are gaining traction.
The encapsulation process involves laminating these materials between the solar cells and protective glass or backsheet layers. This creates a durable, weather-resistant structure capable of withstanding decades of outdoor exposure. Advanced encapsulants also address specific challenges like potential-induced degradation, which can significantly reduce module efficiency over time.
The solar encapsulation market is experiencing robust growth driven by the global transition toward renewable energy sources. Rising deployment of utility-scale, commercial, and residential photovoltaic installations directly increases demand for encapsulation materials.
Furthermore, technological advancements in thin-film solar and bifacial module designs require specialized encapsulant formulations. Government mandates supporting carbon neutrality goals are accelerating solar adoption across developed and emerging economies.
Additionally, declining module costs make solar projects increasingly competitive with conventional energy sources, thereby boosting production volumes. The shift toward building-integrated photovoltaic systems and floating photovoltaic installations creates new application segments. Manufacturers are also responding to demand for higher-efficiency modules by developing encapsulants with superior moisture resistance and lower degradation rates.
To Know More About This Report, Request a Free Sample Copy
GROWTH ENABLERS
Key enablers of the global solar encapsulation market growth:
- Rapid expansion of solar PV installations is directly increasing demand for encapsulation materials
- Declining solar module prices are accelerating project economics and boosting module production volumes
- Government policies and incentives promoting renewable energy are supporting long-term market growth
- Rising focus on module lifetime and efficiency is driving use of advanced encapsulant formulations
- Module lifetime and efficiency have become paramount concerns for solar project developers and investors. Consequently, advanced encapsulant formulations are gaining market share. Traditional ethylene-vinyl acetate materials, while cost-effective, face limitations in moisture resistance and potential-induced degradation protection. Newer materials like polyolefin elastomers offer superior performance characteristics that extend module lifespans beyond 30 years.
- According to data from the National Renewable Energy Laboratory, modules using advanced encapsulants demonstrate degradation rates below 0.5% annually compared to 0.7-1.0% for conventional materials. This performance difference translates to significant revenue impacts over multi-decade project timelines.
- Additionally, premium encapsulants enable manufacturers to offer extended warranties, enhancing product competitiveness. The technology crystalline silicon solar sector particularly benefits from these innovations, as higher-efficiency cells require more robust protection. Investment in R&D by major chemical companies reflects industry recognition that encapsulant quality directly influences overall system economics and bankability.
Key growth restraining factors of the global solar panel recycling market:
- Higher upfront system costs continue to limit microinverter penetration in price-sensitive markets
- Complexity in after-sales service can increase maintenance costs for large-scale installations
- Dependence on imported electronic components exposes supply chains to price and availability risks
- Limited suitability for utility-scale projects constrains the addressable market size
- Limited suitability for utility-scale projects represents a structural constraint on total addressable market expansion. While solar microinverters excel in residential rooftop and small commercial applications, utility-scale solar farms spanning hundreds of megawatts typically favor central or string inverters due to installation complexity and cost considerations.
- Large ground-mounted arrays benefit from economies of scale that make per-watt costs significantly lower with centralized power electronics architecture. Additionally, the sheer volume of devices required for gigawatt-scale projects creates logistical challenges in deployment, commissioning, and long-term maintenance management.
- Although some distributed utility projects are beginning to explore microinverter applications for specific use cases, the bulk of utility-scale capacity additions will continue relying on traditional inverter technologies. This limitation channels solar microinverter growth primarily into distributed generation segments, which represent a smaller portion of total global solar capacity additions compared to large-scale solar farms.
KEY MARKET TRENDS
Key growth restraining factors of the global solar encapsulation market:
- Volatility in raw material prices, such as polymers, impacts encapsulant manufacturing cost structures
- Technical compatibility issues with new cell technologies can limit rapid adoption of certain encapsulants
- Intense price competition among suppliers compresses margins across the value chain
- High-performance materials often face slow qualification cycles with conservative module manufacturers
- High-performance encapsulants confront lengthy qualification processes that delay market penetration. Module manufacturers typically maintain conservative approaches to material changes due to reliability concerns and warranty obligations. New encapsulant formulations must undergo extensive testing protocols, including accelerated aging tests, damp heat exposure, and UV stress assessments. These qualification cycles can extend 18-24 months before commercial adoption occurs.
- Meanwhile, established materials like ethylene-vinyl acetate benefit from decades of field performance data and proven reliability records. Module makers face significant financial risks if encapsulant failures occur post-deployment, given 25-30 year performance warranties.
- Therefore, even superior materials struggle to displace incumbents without comprehensive validation. This conservative procurement behavior particularly affects innovative solutions like polydimethylsiloxane and ionomer-based encapsulants. However, leading tier-one manufacturers increasingly recognize that early adoption of advanced materials provides competitive differentiation in efficiency and durability metrics.
Global Solar Encapsulation Industry | Top Trends
- Polyolefin elastomers are revolutionizing the solar encapsulation market landscape. Unlike traditional ethylene-vinyl acetate, POE materials demonstrate exceptional resistance to moisture ingress and potential-induced degradation. According to research from the Fraunhofer Institute for Solar Energy Systems, modules using POE encapsulants maintain 99% of initial performance after 2,000 hours of damp heat testing. This represents a substantial improvement over EVA alternatives. Module manufacturers deploying bifacial and high-efficiency cell technologies increasingly specify POE materials to maximize long-term energy yields. The premium pricing of POE is offset by extended module lifetimes and reduced degradation rates, improving overall project economics.
- The transition toward bifacial module designs creates unique encapsulation challenges and opportunities. Bifacial modules capture light from both front and rear surfaces, requiring transparent or reflective rear-side materials. Consequently, glass-glass module configurations using specialized encapsulants are proliferating. These designs demand materials with exceptional UV stability and optical transmission characteristics. Additionally, high-efficiency cells operating at elevated temperatures require encapsulants with superior thermal stability. Manufacturers like JinkoSolar and Trina Solar have introduced bifacial modules, achieving efficiency gains of 10-30% over monofacial alternatives. This performance advantage is driving rapid adoption in utility-scale projects where land costs are significant.
- Material thickness reduction represents a key cost optimization strategy across the solar encapsulation market. Thinner encapsulant layers decrease raw material consumption while maintaining protective performance. Industry leaders are developing formulations that perform reliably at 300-400 micron thicknesses compared to traditional 450-500 micron specifications. This material savings, though seemingly modest, delivers significant cost reductions at gigawatt production scales. Furthermore, thinner encapsulation contributes to lighter overall module weights, reducing transportation expenses and installation labor requirements. However, achieving adequate protection with reduced thickness demands superior material properties and precise manufacturing control.
- Environmental concerns are reshaping encapsulant development priorities throughout the photovoltaic industry. Module end-of-life management is emerging as a critical issue as early solar installations reach retirement age. Traditional encapsulants complicate recycling processes because separating laminated components requires energy-intensive thermal or chemical treatments. Consequently, material suppliers are developing formulations that facilitate easier delamination and component recovery. According to the International Renewable Energy Agency, global solar panel waste could reach 78 million tonnes by 2050 without improved recycling infrastructure. This projection is accelerating innovation in recyclable encapsulant technologies. Some manufacturers are exploring bio-based polymers and materials compatible with mechanical separation processes. Additionally, regulatory frameworks in Europe and other regions increasingly mandate recycling provisions for solar modules.
MARKET SEGMENTATION
Market Segmentation – Material Type, Technology (Module Construction), and Application –
Market by Material Type:
- Ethylene Vinyl Acetate (EVA)
- Ethylene-vinyl acetate represents the most widely adopted encapsulation material in the global solar industry. This copolymer combines excellent optical clarity with strong adhesion properties and cost-effectiveness. EVA’s dominance stems from decades of proven field performance and extensive manufacturing infrastructure.
- The material bonds effectively to both crystalline silicon cells and protective glass layers during the lamination process. Moreover, EVA maintains flexibility across wide temperature ranges, accommodating thermal expansion without delamination. However, traditional EVA formulations face limitations in moisture resistance and potential-induced degradation protection.
- Advanced cross-linked EVA variants with improved additive packages address these weaknesses while preserving cost advantages. Demand for EVA remains robust in price-sensitive markets and standard efficiency module segments. Module manufacturers value EVA’s processing compatibility with existing lamination equipment and established supply chains.
- Polyolefin Elastomers (POE)
- Polyvinyl Butyral (PVB)
- Silicone & Ionomer
- Other Material Types
Market by Technology (Module Construction):
- Glass-Backsheet
- Glass-Glass (Double Glass)
- Building-Integrated Photovoltaics (BIPV)
Market by Application:
- Photovoltaics (PV)
- Utility-Scale
- Commercial & Industrial (C&I)
- Residential
- Transportation & Mobility
- Consumer Electronics
Geographical Study based on Four Major Regions:
- North America: The United States and Canada
- Europe: The United Kingdom, Germany, France, Italy, Spain, Poland, Belgium, and Rest of Europe
- Asia-Pacific: China, India, Japan, Australia & New Zealand, South Korea, Thailand, Indonesia, Vietnam, and Rest of Asia-Pacific
- China dominates the solar encapsulation market within Asia-Pacific, driven by massive manufacturing capacity and aggressive renewable energy deployment targets. The nation accounts for over 80% of global solar module production, creating enormous demand for encapsulation materials. Chinese manufacturers have established vertically integrated supply chains, controlling everything from polysilicon production to module assembly.
- Government initiatives like the 14th Five-Year Plan mandate substantial renewable energy capacity additions, with solar installations targeted to exceed 1,200 GW by 2030, according to the National Energy Administration. This policy environment ensures sustained growth in domestic encapsulant consumption. Furthermore, Chinese companies are pioneering innovations in POE formulations and developing cost-competitive alternatives to imported materials. Leading firms like Hangzhou First Applied Material Co Ltd and Cybrid Technologies are expanding production capabilities.
- The market also benefits from proximity to downstream module manufacturers, enabling rapid feedback loops for product development. Export-oriented production adds another growth dimension, as Chinese-made encapsulants serve global supply chains. However, quality concerns and intellectual property considerations create opportunities for premium imported materials in high-efficiency module segments.
- Rest of World: Latin America, the Middle East & Africa
Our market research reports offer an in-depth analysis of individual country-level market size and growth statistics. We cover the segmentation analysis, key growth factors, and macro-economic trends within the solar encapsulation market, providing detailed insights into –
- Japan Solar Encapsulation Market
- Turkey Solar Encapsulation Market
- The United States Solar Encapsulation Market
MAJOR PLAYERS
The major players in the global solar encapsulation market are:
- DuPont de Nemours Inc
- 3M Company
- Dow Inc
- STR Holdings Inc
- Mitsui Chemicals Inc
Key strategies adopted by some of these companies:
- DuPont introduced next-generation POE-based encapsulants specifically engineered for bifacial and high-efficiency modules. This innovation addresses the growing demand for materials that withstand potential-induced degradation while maintaining superior optical properties. The Fortasun 3000 Series enables module manufacturers to offer extended 30-year warranties.
- DuPont partnered with Desun Energy to introduce flexible solar panels featuring DuPont Tedlar frontsheet technology at Intersolar Europe 2024. This collaboration targets consumer applications, including balcony solar systems and recreational vehicles. The innovation combines mechanical toughness with high light transmittance, expanding the solar encapsulation market into portable and attached applications.
- Mitsui Chemicals commissioned a new 120,000-tonnes-per-year Tafmer production line in Singapore during fiscal 2024. This expansion strengthens the company’s polyolefin elastomer capacity to serve growing demand for advanced solar encapsulation materials. The investment supports module manufacturers requiring superior moisture resistance and PID-free performance in high-efficiency photovoltaic installations.
REPORT SYNOPSIS
| REPORT SCOPE | DETAILS |
|---|---|
| Market Forecast Years | 2026-2034 |
| Base Year | 2025 |
| Market Historical Years | 2022-2024 |
| Forecast Units | Revenue ($ Million) |
| Segments Analyzed | Material Type, Technology (Module Construction), and Application |
| Geographies Analyzed | North America, Europe, Asia-Pacific, Rest of World |
| Companies Analyzed | DuPont de Nemours Inc, 3M Company, Dow Inc, STR Holdings Inc, Mitsui Chemicals Inc, Bridgestone Corporation, Coveme SpA, Arkema SA, RenewSys India Pvt Ltd, Hangzhou First Applied Material Co Ltd, Kuraray Co Ltd, Eastman Chemical Company |
TABLE OF CONTENTS
RESEARCH SCOPE & METHODOLOGY
- STUDY OBJECTIVES
- METHODOLOGY
- ASSUMPTIONS & LIMITATIONS
EXECUTIVE SUMMARY & KEY INSIGHTS
- MARKET SIZE, SHARE & ESTIMATES
- MARKET OVERVIEW
- SCOPE OF STUDY
- CRISIS SCENARIO ANALYSIS
- MAJOR MARKET FINDINGS
- HIGH ADOPTION OF EVA AND POE ENCAPSULANTS IS DRIVEN BY COST EFFICIENCY AND RELIABLE MODULE PERFORMANCE ACROSS GLOBAL SOLAR INSTALLATIONS
- UTILITY SCALE SOLAR PROJECTS ACCOUNT FOR A SIGNIFICANT SHARE OF ENCAPSULANT DEMAND DUE TO LARGE MODULE VOLUMES AND LONG-TERM DEPLOYMENTS
- ASIA-PACIFIC DOMINATES THE MARKET SUPPORTED BY STRONG SOLAR MANUFACTURING BASES AND AGGRESSIVE RENEWABLE ENERGY TARGETS
- TECHNOLOGICAL DIFFERENTIATION AMONG ENCAPSULANT SUPPLIERS IS INCREASING AS MODULE MAKERS DEMAND HIGHER DURABILITY AND LOWER DEGRADATION
MARKET DYNAMICS
- KEY DRIVERS
- RAPID EXPANSION OF SOLAR PV INSTALLATIONS IS DIRECTLY INCREASING DEMAND FOR ENCAPSULATION MATERIALS
- DECLINING SOLAR MODULE PRICES ARE ACCELERATING PROJECT ECONOMICS AND BOOSTING MODULE PRODUCTION VOLUMES
- GOVERNMENT POLICIES AND INCENTIVES PROMOTING RENEWABLE ENERGY ARE SUPPORTING LONG-TERM MARKET GROWTH
- RISING FOCUS ON MODULE LIFETIME AND EFFICIENCY IS DRIVING USE OF ADVANCED ENCAPSULANT FORMULATIONS
- KEY RESTRAINTS
- VOLATILITY IN RAW MATERIAL PRICES SUCH AS POLYMERS, IMPACTS ENCAPSULANT MANUFACTURING COST STRUCTURES
- TECHNICAL COMPATIBILITY ISSUES WITH NEW CELL TECHNOLOGIES CAN LIMIT RAPID ADOPTION OF CERTAIN ENCAPSULANTS
- INTENSE PRICE COMPETITION AMONG SUPPLIERS COMPRESSES MARGINS ACROSS THE VALUE CHAIN
- HIGH-PERFORMANCE MATERIALS OFTEN FACE SLOW QUALIFICATION CYCLES WITH CONSERVATIVE MODULE MANUFACTURERS
- KEY DRIVERS
STRATEGIC MARKET ANALYTICS
- KEY MARKET TRENDS
- SHIFT TOWARD POE ENCAPSULANTS IS GAINING MOMENTUM DUE TO SUPERIOR MOISTURE AND PID RESISTANCE
- DEMAND FOR ENCAPSULANTS SUITABLE FOR BIFACIAL AND HIGH EFFICIENCY MODULES IS INCREASING
- MANUFACTURERS ARE INVESTING IN THINNER AND LIGHTWEIGHT ENCAPSULATION SOLUTIONS TO REDUCE MODULE COSTS
- SUSTAINABILITY AND RECYCLABILITY CONSIDERATIONS ARE INFLUENCING MATERIAL SELECTION AND PRODUCT DEVELOPMENT
- PORTER’S FIVE FORCES ANALYSIS
- BUYERS POWER
- SUPPLIERS POWER
- SUBSTITUTION
- NEW ENTRANTS
- INDUSTRY RIVALRY
- GROWTH PROSPECT MAPPING
- GROWTH PROSPECT MAPPING FOR NORTH AMERICA
- GROWTH PROSPECT MAPPING FOR EUROPE
- GROWTH PROSPECT MAPPING FOR ASIA-PACIFIC
- GROWTH PROSPECT MAPPING FOR REST OF WORLD
- MARKET MATURITY ANALYSIS
- MARKET CONCENTRATION ANALYSIS
- VALUE CHAIN ANALYSIS
- RAW MATERIAL SUPPLIERS
- POLYMER COMPOUNDING
- ENCAPSULANT MANUFACTURING
- FILM EXTRUSION
- MODULE ASSEMBLY
- SOLAR PROJECT DEPLOYMENT
- KEY BUYING CRITERIA
- LONG-TERM DURABILITY
- CELL COMPATIBILITY
- COST EFFICIENCY
- SUPPLIER RELIABILITY
- REGULATORY FRAMEWORK
- KEY MARKET TRENDS
SOLAR ENCAPSULATION MARKET BY MATERIAL TYPE
- ETHYLENE VINYL ACETATE (EVA)
- POLYOLEFIN ELASTOMERS (POE)
- POLYVINYL BUTYRAL (PVB)
- SILICONE & IONOMER
- OTHER MATERIAL TYPES
SOLAR ENCAPSULATION MARKET BY TECHNOLOGY (MODULE CONSTRUCTION)
- GLASS-BACKSHEET
- GLASS-GLASS (DOUBLE GLASS)
- BUILDING-INTEGRATED PHOTOVOLTAICS (BIPV)
SOLAR ENCAPSULATION MARKET BY APPLICATION
- PHOTOVOLTAICS (PV)
- UTILITY-SCALE
- COMMERCIAL & INDUSTRIAL (C&I)
- RESIDENTIAL
- TRANSPORTATION & MOBILITY
- CONSUMER ELECTRONICS
- PHOTOVOLTAICS (PV)
GEOGRAPHICAL ANALYSIS
- NORTH AMERICA
- MARKET SIZE & ESTIMATES
- NORTH AMERICA MARKET DRIVERS
- NORTH AMERICA MARKET CHALLENGES
- KEY PLAYERS IN NORTH AMERICA SOLAR ENCAPSULATION MARKET
- COUNTRY ANALYSIS
- UNITED STATES
- UNITED STATES MARKET SIZE & OPPORTUNITIES
- CANADA
- CANADA MARKET SIZE & OPPORTUNITIES
- UNITED STATES
- EUROPE
- MARKET SIZE & ESTIMATES
- EUROPE MARKET DRIVERS
- EUROPE MARKET CHALLENGES
- KEY PLAYERS IN EUROPE SOLAR ENCAPSULATION MARKET
- COUNTRY ANALYSIS
- GERMANY
- GERMANY MARKET SIZE & OPPORTUNITIES
- UNITED KINGDOM
- UNITED KINGDOM MARKET SIZE & OPPORTUNITIES
- FRANCE
- FRANCE MARKET SIZE & OPPORTUNITIES
- ITALY
- ITALY MARKET SIZE & OPPORTUNITIES
- SPAIN
- SPAIN MARKET SIZE & OPPORTUNITIES
- BELGIUM
- BELGIUM MARKET SIZE & OPPORTUNITIES
- POLAND
- POLAND MARKET SIZE & OPPORTUNITIES
- REST OF EUROPE
- REST OF EUROPE MARKET SIZE & OPPORTUNITIES
- GERMANY
- ASIA-PACIFIC
- MARKET SIZE & ESTIMATES
- ASIA-PACIFIC MARKET DRIVERS
- ASIA-PACIFIC MARKET CHALLENGES
- KEY PLAYERS IN ASIA-PACIFIC SOLAR ENCAPSULATION MARKET
- COUNTRY ANALYSIS
- CHINA
- CHINA MARKET SIZE & OPPORTUNITIES
- INDIA
- INDIA MARKET SIZE & OPPORTUNITIES
- JAPAN
- JAPAN MARKET SIZE & OPPORTUNITIES
- AUSTRALIA & NEW ZEALAND
- AUSTRALIA & NEW ZEALAND MARKET SIZE & OPPORTUNITIES
- SOUTH KOREA
- SOUTH KOREA MARKET SIZE & OPPORTUNITIES
- THAILAND
- THAILAND MARKET SIZE & OPPORTUNITIES
- INDONESIA
- INDONESIA MARKET SIZE & OPPORTUNITIES
- VIETNAM
- VIETNAM MARKET SIZE & OPPORTUNITIES
- REST OF ASIA-PACIFIC
- REST OF ASIA-PACIFIC MARKET SIZE & OPPORTUNITIES
- CHINA
- REST OF WORLD
- MARKET SIZE & ESTIMATES
- REST OF WORLD MARKET DRIVERS
- REST OF WORLD MARKET CHALLENGES
- KEY PLAYERS IN REST OF WORLD SOLAR ENCAPSULATION MARKET
- REGIONAL ANALYSIS
- LATIN AMERICA
- LATIN AMERICA MARKET SIZE & OPPORTUNITIES
- MIDDLE EAST & AFRICA
- MIDDLE EAST & AFRICA MARKET SIZE & OPPORTUNITIES
- LATIN AMERICA
- NORTH AMERICA
COMPETITIVE LANDSCAPE
- KEY STRATEGIC DEVELOPMENTS
- MERGERS & ACQUISITIONS
- PRODUCT LAUNCHES & DEVELOPMENTS
- PARTNERSHIPS & AGREEMENTS
- BUSINESS EXPANSIONS & DIVESTITURES
- COMPETITOR POSITIONING & DIFFERENTIATION MAP
- COMPANY PROFILES
- DUPONT DE NEMOURS INC
- COMPANY OVERVIEW
- PRODUCT LIST
- STRENGTHS & CHALLENGES
- 3M COMPANY
- COMPANY OVERVIEW
- PRODUCT LIST
- STRENGTHS & CHALLENGES
- DOW INC
- COMPANY OVERVIEW
- PRODUCT LIST
- STRENGTHS & CHALLENGES
- STR HOLDINGS INC
- COMPANY OVERVIEW
- PRODUCT LIST
- STRENGTHS & CHALLENGES
- MITSUI CHEMICALS INC
- COMPANY OVERVIEW
- PRODUCT LIST
- STRENGTHS & CHALLENGES
- BRIDGESTONE CORPORATION
- COMPANY OVERVIEW
- PRODUCT LIST
- STRENGTHS & CHALLENGES
- COVEME SPA
- COMPANY OVERVIEW
- PRODUCT LIST
- STRENGTHS & CHALLENGES
- ARKEMA SA
- COMPANY OVERVIEW
- PRODUCT LIST
- STRENGTHS & CHALLENGES
- RENEWSYS INDIA PVT LTD
- COMPANY OVERVIEW
- PRODUCT LIST
- STRENGTHS & CHALLENGES
- HANGZHOU FIRST APPLIED MATERIAL CO LTD
- COMPANY OVERVIEW
- PRODUCT LIST
- STRENGTHS & CHALLENGES
- KURARAY CO LTD
- COMPANY OVERVIEW
- PRODUCT LIST
- STRENGTHS & CHALLENGES
- EASTMAN CHEMICAL COMPANY
- COMPANY OVERVIEW
- PRODUCT LIST
- STRENGTHS & CHALLENGES
- DUPONT DE NEMOURS INC
- KEY STRATEGIC DEVELOPMENTS
LIST OF TABLES
TABLE 1: MARKET SNAPSHOT – SOLAR ENCAPSULATION
TABLE 2: SOLAR ENCAPSULATION MARKET REGULATORY FRAMEWORK
TABLE 3: MARKET BY MATERIAL TYPE, BY REGION, HISTORICAL YEARS, 2022-2024 (IN $ MILLION)
TABLE 4: MARKET BY MATERIAL TYPE, BY REGION, FORECAST YEARS, 2026-2034 (IN $ MILLION)
TABLE 5: ETHYLENE VINYL ACETATE (EVA) MARKET, BY REGION, HISTORICAL YEARS, 2022-2024 (IN $ MILLION)
TABLE 6: ETHYLENE VINYL ACETATE (EVA) MARKET, BY REGION, FORECAST YEARS, 2026-2034 (IN $ MILLION)
TABLE 7: POLYOLEFIN ELASTOMERS (POE) MARKET, BY REGION, HISTORICAL YEARS, 2022-2024 (IN $ MILLION)
TABLE 8: POLYOLEFIN ELASTOMERS (POE) MARKET, BY REGION, FORECAST YEARS, 2026-2034 (IN $ MILLION)
TABLE 9: POLYVINYL BUTYRAL (PVB) MARKET, BY REGION, HISTORICAL YEARS, 2022-2024 (IN $ MILLION)
TABLE 10: POLYVINYL BUTYRAL (PVB) MARKET, BY REGION, FORECAST YEARS, 2026-2034 (IN $ MILLION)
TABLE 11: SILICONE & IONOMER MARKET, BY REGION, HISTORICAL YEARS, 2022-2024 (IN $ MILLION)
TABLE 12: SILICONE & IONOMER MARKET, BY REGION, FORECAST YEARS, 2026-2034 (IN $ MILLION)
TABLE 13: OTHER MATERIAL TYPES MARKET, BY REGION, HISTORICAL YEARS, 2022-2024 (IN $ MILLION)
TABLE 14: OTHER MATERIAL TYPES MARKET, BY REGION, FORECAST YEARS, 2026-2034 (IN $ MILLION)
TABLE 15: MARKET BY TECHNOLOGY (MODULE CONSTRUCTION), BY REGION, HISTORICAL YEARS, 2022-2024 (IN $ MILLION)
TABLE 16: MARKET BY TECHNOLOGY (MODULE CONSTRUCTION), BY REGION, FORECAST YEARS, 2026-2034 (IN $ MILLION)
TABLE 17: GLASS-BACKSHEET MARKET, BY REGION, HISTORICAL YEARS, 2022-2024 (IN $ MILLION)
TABLE 18: GLASS-BACKSHEET MARKET, BY REGION, FORECAST YEARS, 2026-2034 (IN $ MILLION)
TABLE 19: GLASS-GLASS (DOUBLE GLASS) MARKET, BY REGION, HISTORICAL YEARS, 2022-2024 (IN $ MILLION)
TABLE 20: GLASS-GLASS (DOUBLE GLASS) MARKET, BY REGION, FORECAST YEARS, 2026-2034 (IN $ MILLION)
TABLE 21: BUILDING-INTEGRATED PHOTOVOLTAICS (BIPV) MARKET, BY REGION, HISTORICAL YEARS, 2022-2024 (IN $ MILLION)
TABLE 22: BUILDING-INTEGRATED PHOTOVOLTAICS (BIPV) MARKET, BY REGION, FORECAST YEARS, 2026-2034 (IN $ MILLION)
TABLE 23: MARKET BY APPLICATION, BY REGION, HISTORICAL YEARS, 2022-2024 (IN $ MILLION)
TABLE 24: MARKET BY APPLICATION, BY REGION, FORECAST YEARS, 2026-2034 (IN $ MILLION)
TABLE 25: PHOTOVOLTAICS (PV) MARKET, BY REGION, HISTORICAL YEARS, 2022-2024 (IN $ MILLION)
TABLE 26: PHOTOVOLTAICS (PV) MARKET, BY REGION, FORECAST YEARS, 2026-2034 (IN $ MILLION)
TABLE 27: MARKET BY PHOTOVOLTAICS (PV), BY REGION, HISTORICAL YEARS, 2022-2024 (IN $ MILLION)
TABLE 28: MARKET BY PHOTOVOLTAICS (PV), BY REGION, FORECAST YEARS, 2026-2034 (IN $ MILLION)
TABLE 29: UTILITY-SCALE MARKET, BY REGION, HISTORICAL YEARS, 2022-2024 (IN $ MILLION)
TABLE 30: UTILITY-SCALE MARKET, BY REGION, FORECAST YEARS, 2026-2034 (IN $ MILLION)
TABLE 31: COMMERCIAL & INDUSTRIAL (C&I) MARKET, BY REGION, HISTORICAL YEARS, 2022-2024 (IN $ MILLION)
TABLE 32: COMMERCIAL & INDUSTRIAL (C&I) MARKET, BY REGION, FORECAST YEARS, 2026-2034 (IN $ MILLION)
TABLE 33: RESIDENTIAL MARKET, BY REGION, HISTORICAL YEARS, 2022-2024 (IN $ MILLION)
TABLE 34: RESIDENTIAL MARKET, BY REGION, FORECAST YEARS, 2026-2034 (IN $ MILLION)
TABLE 35: TRANSPORTATION & MOBILITY MARKET, BY REGION, HISTORICAL YEARS, 2022-2024 (IN $ MILLION)
TABLE 36: TRANSPORTATION & MOBILITY MARKET, BY REGION, FORECAST YEARS, 2026-2034 (IN $ MILLION)
TABLE 37: CONSUMER ELECTRONICS MARKET, BY REGION, HISTORICAL YEARS, 2022-2024 (IN $ MILLION)
TABLE 38: CONSUMER ELECTRONICS MARKET, BY REGION, FORECAST YEARS, 2026-2034 (IN $ MILLION)
TABLE 39: MARKET BY GEOGRAPHICAL ANALYSIS, HISTORICAL YEARS, 2022-2024 (IN $ MILLION)
TABLE 40: MARKET BY GEOGRAPHICAL ANALYSIS, FORECAST YEARS, 2026-2034 (IN $ MILLION)
TABLE 41: NORTH AMERICA MARKET, COUNTRY ANALYSIS, HISTORICAL YEARS, 2022-2024 (IN $ MILLION)
TABLE 42: NORTH AMERICA MARKET, COUNTRY ANALYSIS, FORECAST YEARS, 2026-2034 (IN $ MILLION)
TABLE 43: KEY PLAYERS OPERATING IN THE NORTH AMERICAN MARKET
TABLE 44: EUROPE MARKET, COUNTRY ANALYSIS, HISTORICAL YEARS, 2022-2024 (IN $ MILLION)
TABLE 45: EUROPE MARKET, COUNTRY ANALYSIS, FORECAST YEARS, 2026-2034 (IN $ MILLION)
TABLE 46: KEY PLAYERS OPERATING IN THE EUROPEAN MARKET
TABLE 47: ASIA-PACIFIC MARKET, COUNTRY ANALYSIS, HISTORICAL YEARS, 2022-2024 (IN $ MILLION)
TABLE 48: ASIA-PACIFIC MARKET, COUNTRY ANALYSIS, FORECAST YEARS, 2026-2034 (IN $ MILLION)
TABLE 49: KEY PLAYERS OPERATING IN THE ASIA-PACIFIC MARKET
TABLE 50: REST OF WORLD MARKET, REGIONAL ANALYSIS, HISTORICAL YEARS, 2022-2024 (IN $ MILLION)
TABLE 51: REST OF WORLD MARKET, REGIONAL ANALYSIS, FORECAST YEARS, 2026-2034 (IN $ MILLION)
TABLE 52: KEY PLAYERS OPERATING IN THE REST OF WORLD MARKET
TABLE 53: LIST OF MERGERS & ACQUISITIONS
TABLE 54: LIST OF PRODUCT LAUNCHES & DEVELOPMENTS
TABLE 55: LIST OF PARTNERSHIPS & AGREEMENTS
TABLE 56: LIST OF BUSINESS EXPANSIONS & DIVESTITURES
LIST OF FIGURES
FIGURE 1: KEY MARKET TRENDS
FIGURE 2: PORTER’S FIVE FORCES ANALYSIS
FIGURE 3: GROWTH PROSPECT MAPPING FOR NORTH AMERICA
FIGURE 4: GROWTH PROSPECT MAPPING FOR EUROPE
FIGURE 5: GROWTH PROSPECT MAPPING FOR ASIA-PACIFIC
FIGURE 6: GROWTH PROSPECT MAPPING FOR REST OF WORLD
FIGURE 7: MARKET MATURITY ANALYSIS
FIGURE 8: MARKET CONCENTRATION ANALYSIS
FIGURE 9: VALUE CHAIN ANALYSIS
FIGURE 10: KEY BUYING CRITERIA
FIGURE 11: SEGMENT GROWTH POTENTIAL, BY MATERIAL TYPE, IN 2025
FIGURE 12: ETHYLENE VINYL ACETATE (EVA) MARKET SIZE, 2026-2034 (IN $ MILLION)
FIGURE 13: POLYOLEFIN ELASTOMERS (POE) MARKET SIZE, 2026-2034 (IN $ MILLION)
FIGURE 14: POLYVINYL BUTYRAL (PVB) MARKET SIZE, 2026-2034 (IN $ MILLION)
FIGURE 15: SILICONE & IONOMER MARKET SIZE, 2026-2034 (IN $ MILLION)
FIGURE 16: OTHER MATERIAL TYPES MARKET SIZE, 2026-2034 (IN $ MILLION)
FIGURE 17: SEGMENT GROWTH POTENTIAL, BY TECHNOLOGY (MODULE CONSTRUCTION), IN 2025
FIGURE 18: GLASS-BACKSHEET MARKET SIZE, 2026-2034 (IN $ MILLION)
FIGURE 19: GLASS-GLASS (DOUBLE GLASS) MARKET SIZE, 2026-2034 (IN $ MILLION)
FIGURE 20: BUILDING-INTEGRATED PHOTOVOLTAICS (BIPV) MARKET SIZE, 2026-2034 (IN $ MILLION)
FIGURE 21: SEGMENT GROWTH POTENTIAL, BY APPLICATION, IN 2025
FIGURE 22: PHOTOVOLTAICS (PV) MARKET SIZE, 2026-2034 (IN $ MILLION)
FIGURE 23: SEGMENT GROWTH POTENTIAL, BY PHOTOVOLTAICS (PV), IN 2025
FIGURE 24: UTILITY-SCALE MARKET SIZE, 2026-2034 (IN $ MILLION)
FIGURE 25: COMMERCIAL & INDUSTRIAL (C&I) MARKET SIZE, 2026-2034 (IN $ MILLION)
FIGURE 26: RESIDENTIAL MARKET SIZE, 2026-2034 (IN $ MILLION)
FIGURE 27: TRANSPORTATION & MOBILITY MARKET SIZE, 2026-2034 (IN $ MILLION)
FIGURE 28: CONSUMER ELECTRONICS MARKET SIZE, 2026-2034 (IN $ MILLION)
FIGURE 29: NORTH AMERICA SOLAR ENCAPSULATION MARKET, COUNTRY OUTLOOK, 2025 & 2034 (IN %)
FIGURE 30: UNITED STATES MARKET SIZE, 2026-2034 (IN $ MILLION)
FIGURE 31: CANADA MARKET SIZE, 2026-2034 (IN $ MILLION)
FIGURE 32: EUROPE SOLAR ENCAPSULATION MARKET, COUNTRY OUTLOOK, 2025 & 2034 (IN %)
FIGURE 33: GERMANY MARKET SIZE, 2026-2034 (IN $ MILLION)
FIGURE 34: UNITED KINGDOM MARKET SIZE, 2026-2034 (IN $ MILLION)
FIGURE 35: FRANCE MARKET SIZE, 2026-2034 (IN $ MILLION)
FIGURE 36: ITALY MARKET SIZE, 2026-2034 (IN $ MILLION)
FIGURE 37: SPAIN MARKET SIZE, 2026-2034 (IN $ MILLION)
FIGURE 38: BELGIUM MARKET SIZE, 2026-2034 (IN $ MILLION)
FIGURE 39: POLAND MARKET SIZE, 2026-2034 (IN $ MILLION)
FIGURE 40: REST OF EUROPE MARKET SIZE, 2026-2034 (IN $ MILLION)
FIGURE 41: ASIA-PACIFIC SOLAR ENCAPSULATION MARKET, COUNTRY OUTLOOK, 2025 & 2034 (IN %)
FIGURE 42: CHINA MARKET SIZE, 2026-2034 (IN $ MILLION)
FIGURE 43: INDIA MARKET SIZE, 2026-2034 (IN $ MILLION)
FIGURE 44: JAPAN MARKET SIZE, 2026-2034 (IN $ MILLION)
FIGURE 45: AUSTRALIA & NEW ZEALAND MARKET SIZE, 2026-2034 (IN $ MILLION)
FIGURE 46: SOUTH KOREA MARKET SIZE, 2026-2034 (IN $ MILLION)
FIGURE 47: THAILAND MARKET SIZE, 2026-2034 (IN $ MILLION)
FIGURE 48: INDONESIA MARKET SIZE, 2026-2034 (IN $ MILLION)
FIGURE 49: VIETNAM MARKET SIZE, 2026-2034 (IN $ MILLION)
FIGURE 50: REST OF ASIA-PACIFIC MARKET SIZE, 2026-2034 (IN $ MILLION)
FIGURE 51: REST OF WORLD SOLAR ENCAPSULATION MARKET, REGIONAL OUTLOOK, 2025 & 2034 (IN %)
FIGURE 52: LATIN AMERICA MARKET SIZE, 2026-2034 (IN $ MILLION)
FIGURE 53: MIDDLE EAST & AFRICA MARKET SIZE, 2026-2034 (IN $ MILLION)
FAQ’s
FAQs
POE encapsulants offer superior moisture resistance and better protection against potential-induced degradation compared to traditional ethylene-vinyl acetate materials. These performance advantages extend module lifespans and enable manufacturers to offer longer warranties. Although POE materials cost 20-30% more than EVA, the total cost of ownership benefits justifies the premium for high-efficiency and bifacial module applications.
Building-integrated photovoltaic applications demand encapsulants with enhanced aesthetic properties, superior UV resistance, and compatibility with architectural glass. These installations require materials that maintain optical clarity for 30+ years while enduring more complex stress profiles than ground-mounted systems. Specialized formulations incorporating polyvinyl butyral and advanced silicones address these unique requirements.
Asia-Pacific leads global growth, driven by massive solar installations in China, India, and Southeast Asian markets. Europe is experiencing renewed expansion due to energy security concerns and accelerated renewable energy targets. North America shows steady growth supported by utility-scale projects and residential solar adoption. Emerging markets in Latin America and the Middle East represent high-potential regions as solar economics improve.
RELATED REPORTS
-
TURKEY SOLAR ENCAPSULATION MARKET FORECAST 2026-2034
-
UNITED STATES SOLAR ENCAPSULATION MARKET FORECAST 2026-2034
-
JAPAN SOLAR ENCAPSULATION MARKET FORECAST 2026-2034
-
ASIA-PACIFIC SOLAR ENCAPSULATION MARKET FORECAST 2026-2034
-
EUROPE SOLAR ENCAPSULATION MARKET FORECAST 2026-2034
-
NORTH AMERICA SOLAR ENCAPSULATION MARKET FORECAST 2026-2034
-
UNITED STATES WIND ENERGY MARKET FORECAST 2026-2034
-
CANADA WIND ENERGY MARKET FORECAST 2026-2034
-
GERMANY WIND ENERGY MARKET FORECAST 2026-2034
-
INDIA WIND ENERGY MARKET FORECAST 2026-2034