Global Green Hydrogen Market by Technology (Alkaline Electrolyzer, Polymer Electrolyte Membrane (PEM) Electrolyzer, SOEC Electrolyzer), Market by Application (Power Generation, Transport, Other Applications), Market by Distribution Channel (Pipeline, Cargo), by Geography
GLOBAL GREEN HYDROGEN MARKET OVERVIEW
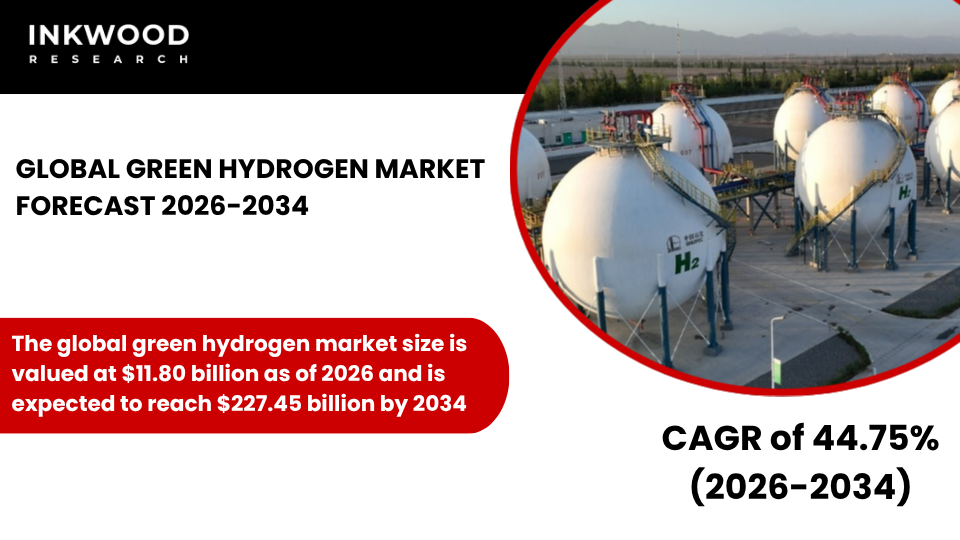
The global green hydrogen market size is valued at $11.80 billion as of 2026 and is expected to reach $227.45 billion by 2034, growing at a CAGR of 44.75% during the forecast period 2026-2034. The base year considered for the study is 2025, and the forecast period is between 2026 and 2034. The market study has also analyzed the crisis impact on the green hydrogen market qualitatively as well as quantitatively.
Green hydrogen represents a transformative energy solution produced through water electrolysis powered entirely by renewable energy sources. Unlike conventional grey hydrogen derived from fossil fuels, green hydrogen generates zero carbon emissions during production. This clean fuel undergoes electrolysis, where renewable electricity splits water molecules into hydrogen and oxygen.
Consequently, industries worldwide are embracing this sustainable alternative to achieve decarbonization goals. Moreover, green hydrogen serves multiple applications across power generation, transportation, and industrial manufacturing sectors. The technology enables energy storage from intermittent renewable sources like solar and wind power. Subsequently, this versatility positions green hydrogen as a cornerstone of the global energy transition strategy.
The global green hydrogen market is experiencing unprecedented growth driven by several converging factors. Governments worldwide are implementing robust policy frameworks and substantial financial incentives to accelerate deployment. Additionally, declining costs of renewable energy infrastructure have significantly improved the economic feasibility of electrolysis-based production.
Industrial sectors facing difficult decarbonization challenges are increasingly adopting green hydrogen as a viable clean feedstock. Furthermore, corporate commitments to achieve net-zero emissions are creating long-term demand certainty through offtake agreements. These dynamics collectively establish a favorable environment for rapid market expansion throughout the forecast period.
To Know More About This Report, Request a Free Sample Copy
GROWTH ENABLERS
Key enablers of the global green hydrogen market growth:
- Decarbonization targets across hard-to-abate sectors are driving strategic adoption of green hydrogen as a clean feedstock
- Declining renewable energy costs are improving the economic viability of electrolysis-based hydrogen production
- Strong government incentives, subsidies, and contract for difference mechanisms are reducing investment risk
- Corporate net zero commitments are creating long-term offtake agreements that support project bankability
- Corporate net zero commitments are fundamentally reshaping the green hydrogen market landscape by establishing reliable demand foundations. Major industrial consumers, including steel manufacturers, chemical producers, and refining operations, are signing long-term offtake agreements. These agreements typically span 10-20 years and guarantee minimum purchase volumes at predetermined prices. Consequently, project developers can secure financing more easily with predictable revenue streams.
- Moreover, companies like ArcelorMittal and Thyssenkrupp have announced significant green hydrogen integration plans for steel production. Such commitments reduce market uncertainty and encourage electrolyzer manufacturers to scale production capacity. Therefore, corporate climate pledges are directly translating into tangible infrastructure investments and accelerating overall market growth.
Key growth restraining factors of the global green hydrogen market:
- High capital costs of electrolyzers and associated infrastructure continue to limit large-scale deployment
- Lack of hydrogen transport, storage, and distribution networks constrains market expansion
- Uncertainty around long-term policy consistency and regulatory frameworks affects investor confidence
- Low-cost grey and blue hydrogen remains more competitive in price-sensitive markets
- Low-cost grey and blue hydrogen production continues to pose significant competitive challenges for green hydrogen adoption. Grey hydrogen, produced through steam methane reforming without carbon capture, costs approximately $1-2 per kilogram compared to green hydrogen’s $4-6 per kilogram.
- Similarly, blue hydrogen incorporating carbon capture achieves intermediate pricing around $2-3 per kilogram. This substantial price gap influences procurement decisions in cost-sensitive industrial applications, particularly in developing markets. Furthermore, existing infrastructure supporting conventional hydrogen production creates additional switching barriers for potential adopters.
- However, the gap is narrowing as renewable energy costs decline and carbon pricing mechanisms gain traction. Nevertheless, until green hydrogen achieves price parity, conventional alternatives will maintain considerable market presence and potentially slow transition rates.
KEY MARKET TRENDS
Global Green Hydrogen Industry | Top Trends
- Developers are increasingly coupling electrolyzer facilities directly with solar and wind power installations to ensure a reliable, clean energy supply. This vertical integration approach eliminates grid dependency and maximizes carbon reduction benefits. According to the International Renewable Energy Agency (IRENA), over 65% of announced green hydrogen projects in 2024 incorporate dedicated renewable generation capacity. Consequently, this trend strengthens project economics by reducing electricity procurement risks and enabling optimized production scheduling. Moreover, co-located facilities benefit from streamlined permitting processes and reduced transmission infrastructure requirements.
- Industrial buyers are committing to multi-year hydrogen purchase contracts to guarantee supply security and price stability. These agreements typically include volume commitments ranging from 10,000 to 100,000 tons annually. Furthermore, sectors like ammonia production, steel manufacturing, and refining are leading this contracting activity. Such arrangements provide project developers with bankable revenue projections essential for securing financing. Therefore, the trend toward structured offtake agreements is accelerating project development timelines and reducing market speculation risks.
- Manufacturers are investing heavily in research to enhance electrolyzer performance and reduce maintenance requirements. Current PEM electrolysis systems achieve approximately 65-70% efficiency, while alkaline electrolysis reaches 60-65% efficiency. However, next-generation systems target efficiencies exceeding 75% through advanced materials and optimized system designs. Additionally, extending electrolyzer lifespans from 60,000 to 100,000 operating hours significantly improves project economics. Companies like Siemens Energy and Nel ASA are pioneering these technological advancements to reduce levelized hydrogen costs.
- Countries with abundant renewable resources are developing large-scale export-oriented production facilities. Australia, Chile, and Saudi Arabia are establishing green hydrogen hubs specifically targeting international markets. These projects often focus on producing ammonia or methanol as hydrogen carriers for easier maritime transport. According to the International Energy Agency (IEA), announced export projects represent approximately 45% of global planned green hydrogen capacity. Subsequently, international trade frameworks and bilateral agreements are emerging to facilitate this growing export activity.
MARKET SEGMENTATION
Market Segmentation – Technology, Application, and Distribution Channel –
Market by Technology:
- Alkaline Electrolyzer
- Alkaline electrolysis represents the most mature and commercially proven technology for green hydrogen production worldwide. This technology utilizes a liquid alkaline solution, typically potassium hydroxide, as the electrolyte to facilitate water splitting. Alkaline electrolyzers offer several compelling advantages, including lower capital costs compared to alternative technologies and robust operational reliability. Furthermore, these systems demonstrate excellent scalability from megawatt to gigawatt capacities, making them suitable for large industrial applications.
- The technology features simpler stack designs with fewer expensive materials, particularly avoiding precious metal catalysts required by competing systems. Additionally, alkaline electrolyzers achieve operational lifetimes exceeding 60,000 hours with minimal performance degradation. This longevity translates to favorable levelized hydrogen costs over project lifecycles.
- Demand for alkaline electrolysis is being driven by several concurrent market forces. Large-scale industrial hydrogen consumers prefer this technology for its proven track record and cost-effectiveness. Moreover, recent innovations have improved dynamic response capabilities, enabling better integration with intermittent renewable energy sources. Companies like Air Liquide and Thyssenkrupp Nucera are deploying multi-megawatt alkaline systems for major industrial clients.
- The technology’s ability to operate efficiently at partial loads makes it particularly attractive for wind energy integration. Consequently, alkaline electrolysis continues capturing substantial market share in power-to-hydrogen applications. Regulatory support and declining balance-of-plant costs further enhance the segment’s growth trajectory. This sub-segment supports overall market expansion by providing affordable, scalable pathways for green hydrogen adoption across diverse industrial sectors.
Geographical Study based on Four Major Countries:
Our market research reports offer an in-depth analysis of individual country-level market size and growth statistics. We cover the segmentation analysis, key growth factors, and macro-economic trends within the green hydrogen market, providing detailed insights into –
MAJOR PLAYERS
The major players in the global green hydrogen market are:
- ACWA Power
- Air Liquide
- Air Products and Chemicals Inc
- Cummins Inc
- ENGIE
Key strategies adopted by some of these companies:
- In March 2024, Siemens Energy launched its next-generation Silyzer 300 PEM electrolyzer system with enhanced efficiency ratings reaching 73%. This advancement significantly reduces electricity consumption per kilogram of hydrogen produced, improving project economics for industrial applications.
- In July 2024, Air Liquide and TotalEnergies strengthened their partnership to develop large-scale green hydrogen projects in the Netherlands, including a 250 MW electrolyzer at TotalEnergies’ Zeeland refinery and Air Liquide’s ELYgator project powered by offshore wind. These initiatives aim to significantly increase green hydrogen production, cut refinery CO₂ emissions by around 450,000 tons annually, and support broader decarbonization and hydrogen refueling efforts across Europe.
REPORT SYNOPSIS
| REPORT SCOPE | DETAILS |
|---|---|
| Market Forecast Years | 2026-2034 |
| Base Year | 2025 |
| Market Historical Years | 2022-2024 |
| Forecast Units | Revenue ($ Million), Volume (Kilotons) |
| Segments Analyzed | Technology, Application, and Distribution Channel |
| Geographies Analyzed | India, the Netherlands, Saudi Arabia, Chile |
| Companies Analyzed | ACWA Power, Air Liquide, Air Products and Chemicals Inc, Cummins Inc, ENGIE, Ergosup, Linde PLC, McPhy Energy SA, Nel ASA, Plug Power, SGH2 Energy, Shell, Siemens Energy, Toshiba Energy Systems & Solutions Corporation, Total, Uniper SE |
TABLE OF CONTENTS
RESEARCH SCOPE & METHODOLOGY
- STUDY OBJECTIVES
- METHODOLOGY
- ASSUMPTIONS & LIMITATIONS
EXECUTIVE SUMMARY & KEY INSIGHTS
- MARKET SIZE, SHARE & ESTIMATES
- MARKET OVERVIEW
- SCOPE OF STUDY
- CRISIS SCENARIO ANALYSIS
- MAJOR MARKET FINDINGS
- GREEN HYDROGEN PRODUCTION IS SHIFTING FROM PILOT SCALE TO EARLY COMMERCIAL DEPLOYMENT, SUPPORTED BY GOVERNMENT-FUNDED PROJECT PIPELINES
- ELECTROLYZER CAPACITY ADDITIONS ARE ACCELERATING RAPIDLY, WITH ALKALINE AND PEM TECHNOLOGIES DOMINATING CURRENT INSTALLATIONS
- INDUSTRIAL APPLICATIONS SUCH AS REFINING FERTILIZERS AND STEEL ARE EMERGING AS THE PRIMARY SOURCES OF NEAR-TERM DEMAND
- REGIONAL MARKETS IN EUROPE, THE MIDDLE EAST, AND AUSTRALIA ARE LEADING PROJECT ANNOUNCEMENTS DUE TO STRONG POLICY BACKING AND RENEWABLE AVAILABILITY
MARKET DYNAMICS
- KEY DRIVERS
- DECARBONIZATION TARGETS ACROSS HARD-TO-ABATE SECTORS ARE DRIVING STRATEGIC ADOPTION OF GREEN HYDROGEN AS A CLEAN FEEDSTOCK
- DECLINING RENEWABLE ENERGY COSTS ARE IMPROVING THE ECONOMIC VIABILITY OF ELECTROLYSIS-BASED HYDROGEN PRODUCTION
- STRONG GOVERNMENT INCENTIVES, SUBSIDIES, AND CONTRACT FOR DIFFERENCE MECHANISMS ARE REDUCING INVESTMENT RISK
- CORPORATE NET ZERO COMMITMENTS ARE CREATING LONG-TERM OFTAKE AGREEMENTS THAT SUPPORT PROJECT BANKABILITY
- KEY RESTRAINTS
- HIGH CAPITAL COSTS OF ELECTROLYZERS AND ASSOCIATED INFRASTRUCTURE CONTINUE TO LIMIT LARGE-SCALE DEPLOYMENT
- LACK OF HYDROGEN TRANSPORT, STORAGE, AND DISTRIBUTION NETWORKS CONSTRAINS MARKET EXPANSION
- UNCERTAINTY AROUND LONG-TERM POLICY CONSISTENCY AND REGULATORY FRAMEWORKS AFFECTS INVESTOR CONFIDENCE
- LOW-COST GREY AND BLUE HYDROGEN REMAINS MORE COMPETITIVE IN PRICE-SENSITIVE MARKETS
- KEY DRIVERS
STRATEGIC MARKET ANALYTICS
- KEY MARKET TRENDS
- INTEGRATION OF GREEN HYDROGEN PROJECTS WITH DEDICATED RENEWABLE ENERGY ASSETS IS BECOMING STANDARD PRACTICE
- LONG-TERM OFFTAKE AGREEMENTS WITH INDUSTRIAL CONSUMERS ARE INCREASING TO SECURE DEMAND
- TECHNOLOGY INNOVATION IS FOCUSED ON IMPROVING ELECTROLYZER EFFICIENCY AND LIFETIME
- CROSS-BORDER GREEN HYDROGEN AND DERIVATIVE EXPORT PROJECTS ARE GAINING MOMENTUM
- PORTER’S FIVE FORCES ANALYSIS
- BUYERS POWER
- SUPPLIERS POWER
- SUBSTITUTION
- NEW ENTRANTS
- INDUSTRY RIVALRY
- GROWTH PROSPECT MAPPING
- GROWTH PROSPECT MAPPING FOR INDIA
- GROWTH PROSPECT MAPPING FOR THE NETHERLANDS
- GROWTH PROSPECT MAPPING FOR SAUDI ARABIA
- GROWTH PROSPECT MAPPING FOR CHILE
- MARKET MATURITY ANALYSIS
- MARKET CONCENTRATION ANALYSIS
- VALUE CHAIN ANALYSIS
- RENEWABLE POWER GENERATION
- ELECTROLYZER MANUFACTURING
- HYDROGEN PRODUCTION
- COMPRESSION AND STORAGE
- TRANSPORT AND LOGISTICS
- END USE APPLICATIONS
- KEY BUYING CRITERIA
- LEVELIZED HYDROGEN COST
- SUPPLY RELIABILITY
- TECHNOLOGY EFFICIENCY
- POLICY INCENTIVE ACCESS
- REGULATORY FRAMEWORK
- KEY MARKET TRENDS
GREEN HYDROGEN MARKET BY TECHNOLOGY
- ALKALINE ELECTROLYZER
- MARKET FORECAST FIGURE
- SEGMENT ANALYSIS
- POLYMER ELECTROLYTE MEMBRANE (PEM) ELECTROLYZER
- MARKET FORECAST FIGURE
- SEGMENT ANALYSIS
- SOEC ELECTROLYZER
- MARKET FORECAST FIGURE
- SEGMENT ANALYSIS
- ALKALINE ELECTROLYZER
GREEN HYDROGEN MARKET BY APPLICATION
- POWER GENERATION
- MARKET FORECAST FIGURE
- SEGMENT ANALYSIS
- TRANSPORT
- MARKET FORECAST FIGURE
- SEGMENT ANALYSIS
- OTHER APPLICATIONS
- MARKET FORECAST FIGURE
- SEGMENT ANALYSIS
- POWER GENERATION
GREEN HYDROGEN MARKET BY DISTRIBUTION CHANNEL
- PIPELINE
- MARKET FORECAST FIGURE
- SEGMENT ANALYSIS
- CARGO
- MARKET FORECAST FIGURE
- SEGMENT ANALYSIS
- PIPELINE
GEOGRAPHICAL ANALYSIS
- HYDROGEN POTENTIAL IN KEY COUNTRIES
- COUNTRY ANALYSIS
- NETHERLANDS
- NETHERLANDS ENERGY PROFILE
- IMPORTANT INSTITUTIONS & POLICIES FOR THE ENERGY SECTOR IN THE NETHERLANDS
- NETHERLANDS GREEN HYDROGEN INDUSTRY: OVERVIEW
- GREEN HYDROGEN PROJECTS IN THE NETHERLANDS
- INDIA
- INDIA ENERGY PROFILE
- IMPORTANT INSTITUTIONS & POLICIES FOR THE ENERGY SECTOR IN INDIA
- INDIA GREEN HYDROGEN INDUSTRY: OVERVIEW
- GREEN HYDROGEN PROJECTS IN INDIA
- SAUDI ARABIA
- SAUDI ARABIA ENERGY PROFILE
- IMPORTANT INSTITUTIONS & POLICIES FOR THE ENERGY SECTOR IN SAUDI ARABIA
- SAUDI ARABIA GREEN HYDROGEN INDUSTRY: OVERVIEW
- GREEN HYDROGEN PROJECTS IN SAUDI ARABIA
- CHILE
- CHILE ENERGY PROFILE
- IMPORTANT INSTITUTIONS & POLICIES FOR THE ENERGY SECTOR IN CHILE
- CHILE GREEN HYDROGEN INDUSTRY: OVERVIEW
- GREEN HYDROGEN PROJECTS IN CHILE
- NETHERLANDS
COMPETITIVE LANDSCAPE
- KEY STRATEGIC DEVELOPMENTS
- MERGERS & ACQUISITIONS
- PRODUCT LAUNCHES & DEVELOPMENTS
- PARTNERSHIPS & AGREEMENTS
- COMPETITOR POSITIONING & DIFFERENTIATION MAP
- COMPANY PROFILES
- ACWA POWER
- COMPANY OVERVIEW
- PRODUCT LIST
- STRENGTHS & CHALLENGES
- AIR LIQUIDE
- COMPANY OVERVIEW
- PRODUCT LIST
- STRENGTHS & CHALLENGES
- AIR PRODUCTS AND CHEMICALS INC
- COMPANY OVERVIEW
- PRODUCT LIST
- STRENGTHS & CHALLENGES
- CUMMINS INC
- COMPANY OVERVIEW
- PRODUCT LIST
- STRENGTHS & CHALLENGES
- ENGIE
- COMPANY OVERVIEW
- PRODUCT LIST
- STRENGTHS & CHALLENGES
- ERGOSUP
- COMPANY OVERVIEW
- PRODUCT LIST
- STRENGTHS & CHALLENGES
- LINDE PLC
- COMPANY OVERVIEW
- PRODUCT LIST
- STRENGTHS & CHALLENGES
- MCPHY ENERGY SA
- COMPANY OVERVIEW
- PRODUCT LIST
- STRENGTHS & CHALLENGES
- NEL ASA
- COMPANY OVERVIEW
- PRODUCT LIST
- STRENGTHS & CHALLENGES
- PLUG POWER
- COMPANY OVERVIEW
- PRODUCT LIST
- STRENGTHS & CHALLENGES
- SGH2 ENERGY
- COMPANY OVERVIEW
- PRODUCT LIST
- STRENGTHS & CHALLENGES
- SHELL
- COMPANY OVERVIEW
- PRODUCT LIST
- STRENGTHS & CHALLENGES
- SIEMENS ENERGY
- COMPANY OVERVIEW
- PRODUCT LIST
- STRENGTHS & CHALLENGES
- TOSHIBA ENERGY SYSTEMS & SOLUTIONS CORPORATION
- COMPANY OVERVIEW
- PRODUCT LIST
- STRENGTHS & CHALLENGES
- TOTAL
- COMPANY OVERVIEW
- PRODUCT LIST
- STRENGTHS & CHALLENGES
- UNIPER SE
- COMPANY OVERVIEW
- PRODUCT LIST
- STRENGTHS & CHALLENGES
- ACWA POWER
- KEY STRATEGIC DEVELOPMENTS
LIST OF TABLES
TABLE 1: MARKET SNAPSHOT – GREEN HYDROGEN
TABLE 2: GREEN HYDROGEN MARKET REGULATORY FRAMEWORK
TABLE 3: MARKET BY TECHNOLOGY, BY REGION, HISTORICAL YEARS, 2022-2024 (IN $ MILLION)
TABLE 4: MARKET BY TECHNOLOGY, BY REGION, FORECAST YEARS, 2026-2034 (IN $ MILLION)
TABLE 5: MARKET BY TECHNOLOGY, BY REGION, HISTORICAL YEARS, 2022-2024 (IN KILOTONS)
TABLE 6: MARKET BY TECHNOLOGY, BY REGION, FORECAST YEARS, 2026-2034 (IN KILOTONS)
TABLE 7: ALKALINE ELECTROLYZER MARKET, BY REGION, HISTORICAL YEARS, 2022-2024 (IN $ MILLION)
TABLE 8: ALKALINE ELECTROLYZER MARKET, BY REGION, FORECAST YEARS, 2026-2034 (IN $ MILLION)
TABLE 9: ALKALINE ELECTROLYZER MARKET, BY REGION, HISTORICAL YEARS, 2022-2024 (IN KILOTONS)
TABLE 10: ALKALINE ELECTROLYZER MARKET, BY REGION, FORECAST YEARS, 2026-2034 (IN KILOTONS)
TABLE 11: POLYMER ELECTROLYTE MEMBRANE (PEM) ELECTROLYZER MARKET, BY REGION, HISTORICAL YEARS, 2022-2024 (IN $ MILLION)
TABLE 12: POLYMER ELECTROLYTE MEMBRANE (PEM) ELECTROLYZER MARKET, BY REGION, FORECAST YEARS, 2026-2034 (IN $ MILLION)
TABLE 13: POLYMER ELECTROLYTE MEMBRANE (PEM) ELECTROLYZER MARKET, BY REGION, HISTORICAL YEARS, 2022-2024 (IN KILOTONS)
TABLE 14: POLYMER ELECTROLYTE MEMBRANE (PEM) ELECTROLYZER MARKET, BY REGION, FORECAST YEARS, 2026-2034 (IN KILOTONS)
TABLE 15: SOEC ELECTROLYZER MARKET, BY REGION, HISTORICAL YEARS, 2022-2024 (IN $ MILLION)
TABLE 16: SOEC ELECTROLYZER MARKET, BY REGION, FORECAST YEARS, 2026-2034 (IN $ MILLION)
TABLE 17: SOEC ELECTROLYZER MARKET, BY REGION, HISTORICAL YEARS, 2022-2024 (IN KILOTONS)
TABLE 18: SOEC ELECTROLYZER MARKET, BY REGION, FORECAST YEARS, 2026-2034 (IN KILOTONS)
TABLE 19: MARKET BY APPLICATION, BY REGION, HISTORICAL YEARS, 2022-2024 (IN $ MILLION)
TABLE 20: MARKET BY APPLICATION, BY REGION, FORECAST YEARS, 2026-2034 (IN $ MILLION)
TABLE 21: MARKET BY APPLICATION, BY REGION, HISTORICAL YEARS, 2022-2024 (IN KILOTONS)
TABLE 22: MARKET BY APPLICATION, BY REGION, FORECAST YEARS, 2026-2034 (IN KILOTONS)
TABLE 23: POWER GENERATION MARKET, BY REGION, HISTORICAL YEARS, 2022-2024 (IN $ MILLION)
TABLE 24: POWER GENERATION MARKET, BY REGION, FORECAST YEARS, 2026-2034 (IN $ MILLION)
TABLE 25: POWER GENERATION MARKET, BY REGION, HISTORICAL YEARS, 2022-2024 (IN KILOTONS)
TABLE 26: POWER GENERATION MARKET, BY REGION, FORECAST YEARS, 2026-2034 (IN KILOTONS)
TABLE 27: TRANSPORT MARKET, BY REGION, HISTORICAL YEARS, 2022-2024 (IN $ MILLION)
TABLE 28: TRANSPORT MARKET, BY REGION, FORECAST YEARS, 2026-2034 (IN $ MILLION)
TABLE 29: TRANSPORT MARKET, BY REGION, HISTORICAL YEARS, 2022-2024 (IN KILOTONS)
TABLE 30: TRANSPORT MARKET, BY REGION, FORECAST YEARS, 2026-2034 (IN KILOTONS)
TABLE 31: OTHER APPLICATIONS MARKET, BY REGION, HISTORICAL YEARS, 2022-2024 (IN $ MILLION)
TABLE 32: OTHER APPLICATIONS MARKET, BY REGION, FORECAST YEARS, 2026-2034 (IN $ MILLION)
TABLE 33: OTHER APPLICATIONS MARKET, BY REGION, HISTORICAL YEARS, 2022-2024 (IN KILOTONS)
TABLE 34: OTHER APPLICATIONS MARKET, BY REGION, FORECAST YEARS, 2026-2034 (IN KILOTONS)
TABLE 35: MARKET BY DISTRIBUTION CHANNEL, BY REGION, HISTORICAL YEARS, 2022-2024 (IN $ MILLION)
TABLE 36: MARKET BY DISTRIBUTION CHANNEL, BY REGION, FORECAST YEARS, 2026-2034 (IN $ MILLION)
TABLE 37: MARKET BY DISTRIBUTION CHANNEL, BY REGION, HISTORICAL YEARS, 2022-2024 (IN KILOTONS)
TABLE 38: MARKET BY DISTRIBUTION CHANNEL, BY REGION, FORECAST YEARS, 2026-2034 (IN KILOTONS)
TABLE 39: PIPELINE MARKET, BY REGION, HISTORICAL YEARS, 2022-2024 (IN $ MILLION)
TABLE 40: PIPELINE MARKET, BY REGION, FORECAST YEARS, 2026-2034 (IN $ MILLION)
TABLE 41: PIPELINE MARKET, BY REGION, HISTORICAL YEARS, 2022-2024 (IN KILOTONS)
TABLE 42: PIPELINE MARKET, BY REGION, FORECAST YEARS, 2026-2034 (IN KILOTONS)
TABLE 43: CARGO MARKET, BY REGION, HISTORICAL YEARS, 2022-2024 (IN $ MILLION)
TABLE 44: CARGO MARKET, BY REGION, FORECAST YEARS, 2026-2034 (IN $ MILLION)
TABLE 45: CARGO MARKET, BY REGION, HISTORICAL YEARS, 2022-2024 (IN KILOTONS)
TABLE 46: CARGO MARKET, BY REGION, FORECAST YEARS, 2026-2034 (IN KILOTONS)
TABLE 47: MARKET BY GEOGRAPHICAL ANALYSIS, HISTORICAL YEARS, 2022-2024 (IN $ MILLION)
TABLE 48: MARKET BY GEOGRAPHICAL ANALYSIS, FORECAST YEARS, 2026-2034 (IN $ MILLION)
TABLE 49: INDIA MARKET, COUNTRY ANALYSIS, HISTORICAL YEARS, 2022-2024 (IN $ MILLION)
TABLE 50: INDIA MARKET, COUNTRY ANALYSIS, FORECAST YEARS, 2026-2034 (IN $ MILLION)
TABLE 51: INDIA MARKET, COUNTRY ANALYSIS, HISTORICAL YEARS, 2022-2024 (IN KILOTONS)
TABLE 52: INDIA MARKET, COUNTRY ANALYSIS, FORECAST YEARS, 2026-2034 (IN KILOTONS)
TABLE 53: KEY PLAYERS OPERATING IN THE INDIAN MARKET
TABLE 54: NETHERLANDS MARKET, COUNTRY ANALYSIS, HISTORICAL YEARS, 2022-2024 (IN $ MILLION)
TABLE 55: NETHERLANDS MARKET, COUNTRY ANALYSIS, FORECAST YEARS, 2026-2034 (IN $ MILLION)
TABLE 56: NETHERLANDS MARKET, COUNTRY ANALYSIS, HISTORICAL YEARS, 2022-2024 (IN KILOTONS)
TABLE 57: NETHERLANDS MARKET, COUNTRY ANALYSIS, FORECAST YEARS, 2026-2034 (IN KILOTONS)
TABLE 58: KEY PLAYERS OPERATING IN THE NETHERLANDS MARKET
TABLE 59: SAUDI ARABIA MARKET, COUNTRY ANALYSIS, HISTORICAL YEARS, 2022-2024 (IN $ MILLION)
TABLE 60: SAUDI ARABIA MARKET, COUNTRY ANALYSIS, FORECAST YEARS, 2026-2034 (IN $ MILLION)
TABLE 61: SAUDI ARABIA MARKET, COUNTRY ANALYSIS, HISTORICAL YEARS, 2022-2024 (IN KILOTONS)
TABLE 62: SAUDI ARABIA MARKET, COUNTRY ANALYSIS, FORECAST YEARS, 2026-2034 (IN KILOTONS)
TABLE 63: KEY PLAYERS OPERATING IN THE SAUDI ARABIAN MARKET
TABLE 64: CHILE MARKET, COUNTRY ANALYSIS, HISTORICAL YEARS, 2022-2024 (IN $ MILLION)
TABLE 65: CHILE MARKET, COUNTRY ANALYSIS, FORECAST YEARS, 2026-2034 (IN $ MILLION)
TABLE 66: CHILE MARKET, COUNTRY ANALYSIS, HISTORICAL YEARS, 2022-2024 (IN KILOTONS)
TABLE 67: CHILE MARKET, COUNTRY ANALYSIS, FORECAST YEARS, 2026-2034 (IN KILOTONS)
TABLE 68: KEY PLAYERS OPERATING IN THE CHILEAN MARKET
TABLE 69: LIST OF MERGERS & ACQUISITIONS
TABLE 70: LIST OF PRODUCT LAUNCHES & DEVELOPMENTS
TABLE 71: LIST OF PARTNERSHIPS & AGREEMENTS
TABLE 72: LIST OF BUSINESS EXPANSIONS & DIVESTITURES
LIST OF FIGURES
FIGURE 1: KEY MARKET TRENDS
FIGURE 2: PORTER’S FIVE FORCES ANALYSIS
FIGURE 3: GROWTH PROSPECT MAPPING FOR INDIA
FIGURE 4: GROWTH PROSPECT MAPPING FOR THE NETHERLANDS
FIGURE 5: GROWTH PROSPECT MAPPING FOR SAUDI ARABIA
FIGURE 6: GROWTH PROSPECT MAPPING FOR CHILE
FIGURE 7: MARKET MATURITY ANALYSIS
FIGURE 8: MARKET CONCENTRATION ANALYSIS
FIGURE 9: VALUE CHAIN ANALYSIS
FIGURE 10: KEY BUYING CRITERIA
FIGURE 11: SEGMENT GROWTH POTENTIAL, BY TECHNOLOGY, IN 2025
FIGURE 12: ALKALINE ELECTROLYZER MARKET SIZE, 2026-2034 (IN $ MILLION)
FIGURE 13: POLYMER ELECTROLYTE MEMBRANE (PEM) ELECTROLYZER MARKET SIZE, 2026-2034 (IN $ MILLION)
FIGURE 14: SOEC ELECTROLYZER MARKET SIZE, 2026-2034 (IN $ MILLION)
FIGURE 15: SEGMENT GROWTH POTENTIAL, BY APPLICATION, IN 2025
FIGURE 16: POWER GENERATION MARKET SIZE, 2026-2034 (IN $ MILLION)
FIGURE 17: TRANSPORT MARKET SIZE, 2026-2034 (IN $ MILLION)
FIGURE 18: OTHER APPLICATIONS MARKET SIZE, 2026-2034 (IN $ MILLION)
FIGURE 19: SEGMENT GROWTH POTENTIAL, BY DISTRIBUTION CHANNEL, IN 2025
FIGURE 20: PIPELINE MARKET SIZE, 2026-2034 (IN $ MILLION)
FIGURE 21: CARGO MARKET SIZE, 2026-2034 (IN $ MILLION)
FIGURE 22: INDIA GREEN HYDROGEN MARKET, COUNTRY OUTLOOK, 2025 & 2034 (IN %)
FIGURE 23: THE NETHERLANDS GREEN HYDROGEN MARKET, COUNTRY OUTLOOK, 2025 & 2034 (IN %)
FIGURE 24: SAUDI ARABIA GREEN HYDROGEN MARKET, COUNTRY OUTLOOK, 2025 & 2034 (IN %)
FIGURE 25: CHILE GREEN HYDROGEN MARKET, COUNTRY OUTLOOK, 2025 & 2034 (IN %)
FAQ’s
FAQs
The green hydrogen market is experiencing exceptional growth due to aggressive decarbonization targets across hard-to-abate industrial sectors. Additionally, declining renewable energy costs are making electrolysis-based production increasingly economically viable. Government subsidies and corporate net-zero commitments are further accelerating adoption through reduced investment risks and guaranteed long-term demand.
Alkaline electrolysis currently leads the green hydrogen market due to its proven commercial reliability and lower capital costs. However, PEM electrolysis is gaining market share rapidly because of its superior dynamic response capabilities and compact system designs. Both technologies are experiencing significant capacity additions as manufacturers scale production to meet growing industrial demand.
High capital costs of electrolyzer systems and inadequate hydrogen transport infrastructure remain primary barriers to market growth. Furthermore, price competition from cheaper grey and blue hydrogen alternatives continues to limit adoption in cost-sensitive applications. Policy uncertainty regarding long-term regulatory frameworks and incentive structures also affects investor confidence and project development timelines.
RELATED REPORTS
-
TURKEY SOLAR ENCAPSULATION MARKET FORECAST 2026-2034
-
UNITED STATES SOLAR ENCAPSULATION MARKET FORECAST 2026-2034
-
JAPAN SOLAR ENCAPSULATION MARKET FORECAST 2026-2034
-
ASIA-PACIFIC SOLAR ENCAPSULATION MARKET FORECAST 2026-2034
-
EUROPE SOLAR ENCAPSULATION MARKET FORECAST 2026-2034
-
NORTH AMERICA SOLAR ENCAPSULATION MARKET FORECAST 2026-2034
-
GLOBAL SOLAR ENCAPSULATION MARKET FORECAST 2026-2034
-
UNITED STATES WIND ENERGY MARKET FORECAST 2026-2034
-
CANADA WIND ENERGY MARKET FORECAST 2026-2034
-
GERMANY WIND ENERGY MARKET FORECAST 2026-2034