Global Food Delivery Platform Fee Structures Market by Delivery Mode (Platform-To-Consumer Delivery, Restaurant-To-Consumer Delivery), Market by Payment Method (Online Payment, Cash On Delivery (COD)), Market by Revenue Model (Commission-Based Revenue, Delivery Fee-Based Revenue, Advertising & Promotion Revenue, Subscription-Based Revenue), Market by Product Type (Meal Delivery, Grocery Delivery, Meal Kit Delivery, Alcohol Delivery, Other Product Types), by Geography
GLOBAL FOOD DELIVERY PLATFORM FEE STRUCTURES MARKET OVERVIEW
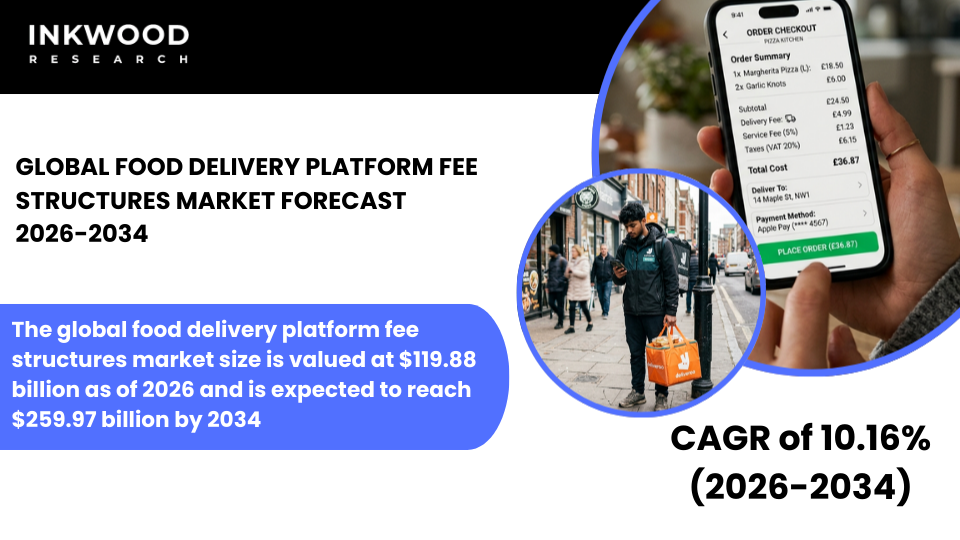
The global food delivery platform fee structures market size is valued at $119.88 billion as of 2026 and is expected to reach $259.97 billion by 2034, growing at a CAGR of 10.16% during the forecast period 2026-2034. The base year considered for the study is 2025, and the forecast period is between 2026 and 2034. The market study has also analyzed the crisis impact on the food delivery platform fee structures market qualitatively as well as quantitatively.
Food delivery platform fee structures refer to the systematic frameworks through which digital food ordering and delivery platforms, such as DoorDash, Uber Eats, Meituan, and Just Eat Takeaway, generate revenue from restaurant partners, consumers, and advertisers. These structures typically encompass multiple revenue layers, including restaurant delivery commissions (ranging from 15% to over 30% of order value), consumer-facing delivery fees, platform service charges, advertising and visibility fees, and subscription-based membership models.
The food delivery platform fee structure market essentially captures the economic architecture that underpins the multi-billion-dollar online food delivery ecosystem, governing how value is distributed between platforms, merchants, couriers, and end consumers. As platforms scale and diversify, food delivery platform pricing continues to evolve from simple flat-rate models toward more complex, tiered, and performance-linked arrangements.
The global food delivery platform fee structures market is growing at a strong pace, driven by the rapid digitization of food ordering habits, the proliferation of smartphones and mobile payment infrastructure, and intense investor pressure on platforms to achieve profitability through optimized food delivery platform pricing strategies.
As platforms expand into new geographies and categories, from restaurant meals to grocery and alcohol delivery, they are continuously refining their food delivery commission rates and service charge models to maximize take rates while retaining merchant and consumer loyalty.
To Know More About This Report, Request a Free Sample Copy
GROWTH ENABLERS
Key enablers of the global food delivery platform fee structures market growth:
- Rising operating costs driving platform dependence on multi-layer fee models
- Growth in on-demand food consumption supporting food delivery platform fee expansion
- Investor pressure to improve unit economics accelerating fee optimization
- Advanced data analytics enabling dynamic and tiered food delivery platform pricing structures
- Advanced data analytics has emerged as a powerful lever for online food delivery platforms seeking to optimize their fee architectures. By leveraging real-time behavioral data, order history, geographic demand patterns, and restaurant performance metrics, leading platforms are now deploying dynamic food delivery platform pricing models that adjust commissions and service fees based on time of day, order volume, and customer segment.
- According to the U.S. Bureau of Labor Statistics, digital service sectors investing in data-driven pricing tools have consistently demonstrated superior margin efficiency. For food delivery platforms, this translates into the ability to fine-tune food delivery commission rates at the individual restaurant level, charging higher take rates from high-demand partners while offering competitive fee structures to attract new merchants. This data-led approach to food delivery platform fee structure design is fundamentally reshaping how platforms monetize their ecosystems.
Key growth restraining factors of the global food delivery platform fee structures market:
- Regulatory caps and commission limits constraining food delivery platform fee growth
- Merchant pushback and restaurant attrition due to high food delivery service charges
- Public scrutiny and legal challenges impacting food delivery platform fee structure flexibility
- Increasing platform competition limiting aggressive fee monetization
- Intensifying competition among online food delivery platforms is placing measurable downward pressure on restaurant delivery commission levels and overall fee monetization. As new regional and global entrants compete for merchant sign-ups and consumer loyalty, established players face growing pressure to lower or restructure their food delivery platform take rates to remain competitive.
- According to the U.S. Federal Trade Commission (FTC), competitive dynamics in digital marketplace sectors frequently result in fee compression, particularly where platform differentiation is limited. For food delivery marketplaces, this means that aggressive commission monetization, once a reliable growth lever, is increasingly difficult to sustain without corresponding value-added services such as marketing tools, logistics optimization, and analytics dashboards that justify elevated online food ordering platform fees.
KEY MARKET TRENDS
Global Food Delivery Platform Fee Structures Industry | Top Trends
- One of the most consequential shifts in food delivery platform business models is the accelerating transition from flat-rate commissions to subscription-based and tiered restaurant delivery commission structures. Platforms like DoorDash, through its DashPass and tiered merchant plans, now offer restaurants the ability to choose fee arrangements based on order volume, desired visibility, and marketing access, rather than paying a one-size-fits-all food delivery commission rate. This unbundling of the commission into tiered packages is gaining traction because it allows platforms to serve both independent restaurants on tight margins and large chains seeking maximum reach, all while improving platform revenue predictability. For merchants, tiered food delivery platform pricing creates more transparency around what each fee level delivers, reducing friction and attrition.
- Demand-based pricing, already well established in ride-hailing, is increasingly being applied to online food delivery platform fee structures. Platforms are experimenting with dynamic food delivery service fees that rise during peak hours or high-demand periods, using real-time data to adjust delivery charges for consumers and logistics costs for platforms. According to Uber’s publicly available investor disclosures, dynamic pricing mechanisms have been central to improving the unit economics of Uber Eats, particularly in high-density urban markets. As a result, food delivery platform take rate optimization is increasingly tied to algorithmic pricing engines that balance consumer price sensitivity against margin improvement targets.
- Across the global food delivery marketplace, there is a clear trend toward unbundling the traditionally consolidated food delivery commission into distinct, separately priced components, covering logistics, platform technology access, and promotional visibility. This food delivery platform fee structure evolution allows merchants to opt into only the services they need, theoretically reducing total cost for smaller operators. Just Eat Takeaway and Delivery Hero have both moved toward more modular online food ordering platform fee arrangements in select markets, reflecting growing merchant demand for cost transparency. However, this unbundling also creates new monetization opportunities, as platforms can now charge separately for each service layer, potentially increasing total food delivery service charges for merchants who opt into all modules.
- Regulatory and merchant advocacy pressure, particularly in the United States, the United Kingdom, and the European Union, is pushing food delivery platforms toward greater transparency in how food delivery platform fees are disclosed and itemized. New York City’s permanent commission cap regulations (enforced through NYC Consumer and Worker Protection) require platforms to clearly display all restaurant delivery commission components to both merchants and consumers. This trend toward transparency is reshaping food delivery platform pricing models globally, as platforms must now design fee structures that can withstand public and regulatory scrutiny. While transparency requirements increase compliance costs, they are also accelerating innovation in how platforms communicate the value of their food delivery platform fee structures to merchant partners.
MARKET SEGMENTATION
Market Segmentation – Delivery Mode, Payment Method, Revenue Model, and Product Type –
Market by Revenue Model:
- Commission-Based Revenue
- Commission-based revenue is the foundational segment of the food delivery platform fee structure market, representing the core mechanism through which platforms monetize their merchant relationships. Under this model, food delivery platforms charge restaurants a percentage of each order value, commonly referred to as the food delivery commission rate, in exchange for access to the platform’s consumer base, digital ordering infrastructure, and (in most cases) last-mile delivery logistics.
- Restaurant delivery commissions typically range between 15% and 35%, depending on the platform, the geographic market, the merchant’s order volume, and the level of delivery support provided. Major platforms such as DoorDash, Uber Eats, and Grubhub have all adopted tiered commission structures that offer merchants varying levels of marketing exposure and delivery coverage at different food delivery service charge tiers.
- Demand for this sub-segment is reinforced by the sheer scale of digital food ordering globally, as more restaurants depend on online food delivery platforms for a meaningful share of their revenue, and commission-based monetization continues to grow in absolute value. Furthermore, the shift toward data-driven pricing is enabling platforms to fine-tune restaurant commission on food delivery apps at an individual merchant level, improving take rate optimization while managing attrition risk.
- Delivery Fee-Based Revenue
- Advertising & Promotion Revenue
- Subscription-Based Revenue
Market by Delivery Mode:
- Platform-To-Consumer Delivery
- Restaurant-To-Consumer Delivery
Market by Payment Method:
- Online Payment
- Cash On Delivery (COD)
Market by Product Type:
- Meal Delivery
- Grocery Delivery
- Meal Kit Delivery
- Alcohol Delivery
- Other Product Types
Geographical Study based on Four Major Regions:
- North America: The United States and Canada
- The North America food delivery platform fee structures market size is valued at $37,515.91 million as of 2026 and is expected to reach $75,105.15 million by 2034, growing at a CAGR of 9.06% during the forecast period 2026-2034.
- North America represents the most mature and regulated landscape for food delivery platform fee structures globally, with the United States serving as the primary market driver. The region is home to dominant players such as DoorDash and Uber Eats, both of which have faced significant scrutiny over their food delivery commission rates and overall food delivery platform pricing practices.
- Landmark commission cap legislation in New York City, which permanently limits third-party food delivery platform fees to 15% for delivery and 5% for other services, has set a regulatory precedent being studied by other U.S. cities and Canadian municipalities. In Canada, the growth of online food delivery platforms has been fueled by urbanization and smartphone adoption, with regulatory discussions around restaurant delivery commission transparency gaining momentum.
- Across the region, platforms are responding to regulatory and merchant pressure by diversifying their food delivery app revenue streams through advertising products, subscription models, and logistics services, reflecting a broader evolution of the food delivery platform business model beyond pure commission dependence.
- Europe: The United Kingdom, Germany, France, Italy, Spain, Poland, Belgium, and Rest of Europe
- The Europe food delivery platform fee structures market size is valued at $31,978.84 million as of 2026 and is expected to reach $66,123.21 million by 2034, growing at a CAGR of 9.51% during the forecast period 2026-2034.
- Europe presents a highly fragmented yet rapidly evolving market for food delivery platform fee structures, shaped by a diverse regulatory environment and intense platform competition. In the United Kingdom, the Competition and Markets Authority (CMA) has actively monitored online food delivery platform practices, particularly around food delivery service charges and their impact on small and independent restaurants.
- Just Eat Takeaway, which holds significant market share across the UK and continental Europe, has moved toward hybrid food delivery platform pricing models, offering both platform-only and full logistics options with differentiated food delivery commission rates. Germany, one of Europe’s largest food delivery markets, has seen growing merchant advocacy for lower restaurant delivery commissions, prompting platforms to introduce more transparent and modular food delivery platform fee structures.
- Overall, European regulators’ increasing attention to the gig economy and digital marketplace economics is pushing platforms to innovate their food delivery commission analysis frameworks while balancing profitability with merchant sustainability.
- Asia-Pacific: China, India, Japan, Australia & New Zealand, South Korea, Thailand, Indonesia, Vietnam, Singapore, and Rest of Asia-Pacific
- The Asia-Pacific food delivery platform fee structures market size is valued at $40,878.20 million as of 2026 and is expected to reach $95,351.56 million by 2034, growing at a CAGR of 11.17% during the forecast period 2026-2034.
- Asia-Pacific is the fastest-growing region in the global food delivery platform fee structures market, underpinned by China’s extraordinary scale and the rapid digital adoption across Southeast Asia and South Asia. In China, Meituan, the country’s dominant online food ordering platform, operates under a sophisticated and highly data-driven food delivery platform fee structure, with restaurant delivery commissions that vary significantly by city tier, restaurant type, and order volume.
- According to Meituan’s official annual report, the platform serves hundreds of millions of active users, enabling commission optimization at a massive scale. In Japan, food delivery platform pricing is still relatively nascent compared to Western markets, but services such as Uber Eats Japan and Demae-can are expanding their merchant bases while carefully calibrating food delivery service charges to suit a market where restaurant margins are traditionally thin.
- Across the broader Asia-Pacific region, the combination of young, mobile-first populations, expanding middle-class consumer bases, and improving digital payment infrastructure is creating powerful tailwinds for food delivery platform business model innovation.
- Rest of World: Latin America, the Middle East & Africa
Our market research reports offer an in-depth analysis of individual country-level market size and growth statistics. We cover the segmentation analysis, key growth factors, and macro-economic trends within the food delivery platform fee structures market, providing detailed insights into –
- The United States Food Delivery Platform Fee Structures Market
- Germany Food Delivery Platform Fee Structures Market
- United Kingdom Food Delivery Platform Fee Structures Market
- China Food Delivery Platform Fee Structures Market
- India Food Delivery Platform Fee Structures Market
- Brazil Food Delivery Platform Fee Structures Market
MAJOR PLAYERS
The major players in the global food delivery platform fee structures market are:
- DoorDash Inc
- Uber Eats
- Meituan Dianping
- Zomato (Eternal)
- Swiggy
Key strategies adopted by some of these companies:
- DoorDash expanded its tiered food delivery platform pricing plans for restaurant partners in the United States, offering three distinct commission tiers, Basic, Plus, and Premier, with food delivery commission rates and marketing benefits scaled accordingly. This move was designed to give merchants greater flexibility while improving DoorDash’s overall food delivery platform revenue model by linking higher platform investment to greater order volume and visibility.
- Uber Eats announced significant enhancements to its sponsored listings and in-app advertising products for restaurant partners, expanding its delivery platform advertising revenue model beyond commissions. This shift reflects a broader strategy to diversify food delivery app revenue streams and reduce platform dependence on commission income alone, improving unit economics while offering merchants an additional lever for demand generation.
- Zomato deepened its integration of Hyperpure, its B2B ingredient and supply chain platform, with its core food delivery marketplace, creating a vertically integrated food delivery platform business model that generates revenue across both supply and demand sides. By embedding supply chain services into its restaurant relationships, Zomato has effectively created an additional layer of food delivery service charges beyond the standard restaurant delivery commission, strengthening merchant stickiness and overall platform monetization.
REPORT SYNOPSIS
| REPORT SCOPE | DETAILS |
|---|---|
| Market Forecast Years | 2026-2034 |
| Base Year | 2025 |
| Market Historical Years | 2022-2024 |
| Forecast Units | Revenue ($ Million) |
| Segments Analyzed | Delivery Mode, Payment Method, Revenue Model, Product Type |
| Geographies Analyzed | North America, Europe, Asia-Pacific, Rest of World |
| Companies Analyzed | DoorDash Inc, Uber Eats, Meituan Dianping, Zomato (Eternal), Swiggy, Just Eat Takeaway.com, Grubhub Inc, Delivery Hero SE, Foodpanda GmbH, Rappi Inc |
TABLE OF CONTENTS
RESEARCH SCOPE & METHODOLOGY
- STUDY OBJECTIVES
- METHODOLOGY
- ASSUMPTIONS & LIMITATIONS
EXECUTIVE SUMMARY
- MARKET SIZE, SHARE & ESTIMATES
- MARKET OVERVIEW
- SCOPE OF STUDY
- MAJOR MARKET FINDINGS
- PLATFORM FEE MONETIZATION IS INCREASING FASTER THAN ORDER VOLUME GROWTH
- COMMISSION STRUCTURES ARE SHIFTING FROM FLAT RATES TO HYBRID FEE MODELS
- SMALL RESTAURANTS BEAR DISPROPORTIONATE PLATFORM COST BURDEN
- REGULATORY PRESSURE IS FORCING GREATER FEE TRANSPARENCY ACROSS MARKETS
MARKET DYNAMICS
- KEY DRIVERS
- RISING OPERATING COSTS DRIVING PLATFORM DEPENDENCE ON MULTI-LAYER FEE MODELS
- GROWTH IN ON-DEMAND FOOD CONSUMPTION SUPPORTING PLATFORM FEE EXPANSION
- INVESTOR PRESSURE TO IMPROVE UNIT ECONOMICS ACCELERATING FEE OPTIMIZATION
- ADVANCED DATA ANALYTICS ENABLING DYNAMIC AND TIERED PRICING STRUCTURES
- KEY RESTRAINTS
- REGULATORY CAPS AND COMMISSION LIMITS CONSTRAINING PLATFORM FEE GROWTH
- MERCHANT PUSHBACK AND RESTAURANT ATTRITION DUE TO HIGH PLATFORM CHARGES
- PUBLIC SCRUTINY AND LEGAL CHALLENGES IMPACTING FEE STRUCTURE FLEXIBILITY
- INCREASING PLATFORM COMPETITION LIMITING AGGRESSIVE FEE MONETIZATION
- KEY DRIVERS
STRATEGIC MARKET ANALYTICS
- GROWTH METRICS
- TAM, SAM & SOM OPPORTUNITY ANALYSIS
- EMERGING MARKET TRENDS & PARADIGM SHIFTS
- SHIFT TOWARD SUBSCRIPTION-BASED AND TIERED MERCHANT FEE MODELS
- EMERGENCE OF DEMAND-BASED AND SURGE PRICING FOR PLATFORM SERVICES
- UNBUNDLING OF DELIVERY, MARKETING, AND TECHNOLOGY FEES
- GREATER FEE TRANSPARENCY AND BREAKDOWN VISIBILITY FOR MERCHANTS
- PORTER’S FIVE FORCES ANALYSIS
- BUYERS POWER
- SUPPLIERS POWER
- SUBSTITUTION
- NEW ENTRANTS
- INDUSTRY RIVALRY
- PESTLE ANALYSIS
- POLITICAL
- ECONOMIC
- SOCIAL LANDSCAPE
- TECHNOLOGY
- LEGAL
- ENVIRONMENTAL
- GROWTH OPPORTUNITY MAPPING & HEATMAP
- GROWTH PROSPECT MAPPING FOR NORTH AMERICA
- GROWTH PROSPECT MAPPING FOR EUROPE
- GROWTH MAPPING PROSPECT FOR ASIA-PACIFIC
- GROWTH MAPPING PROSPECT FOR REST OF WORLD
- MARKET MATURITY & LIFECYCLE ANALYSIS
- MARKET CONCENTRATION ANALYSIS
- GROWTH METRICS
FOOD DELIVERY PLATFORM FEE STRUCTURES VALUE CHAIN & DECISION FRAMEWORK
- VALUE CHAIN ANALYSIS
- MERCHANT ONBOARDING & FEE CONTRACTING
- PLATFORM TECHNOLOGY & FEE ENGINE
- FEE STRUCTURE DESIGN & MONETIZATION
- LOGISTICS & DELIVERY COST MANAGEMENT
- MARKETING, VISIBILITY & DEMAND GENERATION
- SETTLEMENT, ANALYTICS & REGULATORY COMPLIANCE
- KEY BUYING CRITERIA
- COMMISSION LEVELS & FEE TRANSPARENCY
- IMPACT ON MERCHANT PROFITABILITY
- FLEXIBILITY OF FEE MODELS
- DEMAND REACH & ORDER POTENTIAL
- PROMOTION EFFECTIVENESS & VISIBILITY ROI
- SETTLEMENT RELIABILITY & PLATFORM CREDIBILITY
- PRICING MODELS, FEE STRUCTURES & TAKE RATE OPTIMIZATION STRATEGIES
- REGULATORY & POLICY LANDSCAPE ANALYSIS
- VALUE CHAIN ANALYSIS
FOOD DELIVERY PLATFORM FEE STRUCTURES MARKET BY DELIVERY MODE
- PLATFORM-TO-CONSUMER DELIVERY
- MARKET SIZE, FORECAST & SHARE (2022–2034)
- RESTAURANT-TO-CONSUMER DELIVERY
- MARKET SIZE, FORECAST & SHARE (2022–2034)
- PLATFORM-TO-CONSUMER DELIVERY
FOOD DELIVERY PLATFORM FEE STRUCTURES MARKET BY PAYMENT METHOD
- ONLINE PAYMENT
- MARKET SIZE, FORECAST & SHARE (2022–2034)
- CASH ON DELIVERY (COD)
- MARKET SIZE, FORECAST & SHARE (2022–2034)
- ONLINE PAYMENT
FOOD DELIVERY PLATFORM FEE STRUCTURES MARKET BY REVENUE MODEL
- COMMISSION-BASED REVENUE
- MARKET SIZE, FORECAST & SHARE (2022–2034)
- DELIVERY FEE-BASED REVENUE
- MARKET SIZE, FORECAST & SHARE (2022–2034)
- ADVERTISING & PROMOTION REVENUE
- MARKET SIZE, FORECAST & SHARE (2022–2034)
- SUBSCRIPTION-BASED REVENUE
- MARKET SIZE, FORECAST & SHARE (2022–2034)
- COMMISSION-BASED REVENUE
FOOD DELIVERY PLATFORM FEE STRUCTURES MARKET BY PRODUCT TYPE
- MEAL DELIVERY
- MARKET SIZE, FORECAST & SHARE (2022–2034)
- GROCERY DELIVERY
- MARKET SIZE, FORECAST & SHARE (2022–2034)
- MEAL KIT DELIVERY
- MARKET SIZE, FORECAST & SHARE (2022–2034)
- ALCOHOL DELIVERY
- MARKET SIZE, FORECAST & SHARE (2022–2034)
- OTHER PRODUCT TYPES
- MARKET SIZE, FORECAST & SHARE (2022–2034)
- MEAL DELIVERY
GEOGRAPHICAL ANALYSIS
- NORTH AMERICA
- MARKET SIZE & ESTIMATES
- NORTH AMERICA FOOD DELIVERY PLATFORM FEE STRUCTURES MARKET DRIVERS
- NORTH AMERICA FOOD DELIVERY PLATFORM FEE STRUCTURES MARKET CHALLENGES
- KEY REGIONAL PLAYERS & ECOSYSTEM
- COUNTRY ANALYSIS
- UNITED STATES
- UNITED STATES FOOD DELIVERY PLATFORM FEE STRUCTURES MARKET SIZE & OPPORTUNITIES
- CANADA
- CANADA FOOD DELIVERY PLATFORM FEE STRUCTURES MARKET SIZE & OPPORTUNITIES
- UNITED STATES
- EUROPE
- MARKET SIZE & ESTIMATES
- EUROPE FOOD DELIVERY PLATFORM FEE STRUCTURES MARKET DRIVERS
- EUROPE FOOD DELIVERY PLATFORM FEE STRUCTURES MARKET CHALLENGES
- KEY REGIONAL PLAYERS & ECOSYSTEM
- COUNTRY ANALYSIS
- UNITED KINGDOM
- UNITED KINGDOM FOOD DELIVERY PLATFORM FEE STRUCTURES MARKET SIZE & OPPORTUNITIES
- GERMANY
- GERMANY FOOD DELIVERY PLATFORM FEE STRUCTURES MARKET SIZE & OPPORTUNITIES
- FRANCE
- FRANCE FOOD DELIVERY PLATFORM FEE STRUCTURES MARKET SIZE & OPPORTUNITIES
- ITALY
- ITALY FOOD DELIVERY PLATFORM FEE STRUCTURES MARKET SIZE & OPPORTUNITIES
- SPAIN
- SPAIN FOOD DELIVERY PLATFORM FEE STRUCTURES MARKET SIZE & OPPORTUNITIES
- BELGIUM
- BELGIUM FOOD DELIVERY PLATFORM FEE STRUCTURES MARKET SIZE & OPPORTUNITIES
- POLAND
- POLAND FOOD DELIVERY PLATFORM FEE STRUCTURES MARKET SIZE & OPPORTUNITIES
- REST OF EUROPE
- REST OF EUROPE FOOD DELIVERY PLATFORM FEE STRUCTURES MARKET SIZE & OPPORTUNITIES
- UNITED KINGDOM
- ASIA-PACIFIC
- MARKET ESTIMATES & SIZES
- ASIA-PACIFIC FOOD DELIVERY PLATFORM FEE STRUCTURES MARKET DRIVERS
- ASIA-PACIFIC FOOD DELIVERY PLATFORM FEE STRUCTURES MARKET CHALLENGES
- KEY REGIONAL PLAYERS & ECOSYSTEM
- COUNTRY ANALYSIS
- CHINA
- CHINA FOOD DELIVERY PLATFORM FEE STRUCTURES MARKET SIZE & OPPORTUNITIES
- JAPAN
- JAPAN FOOD DELIVERY PLATFORM FEE STRUCTURES MARKET SIZE & OPPORTUNITIES
- AUSTRALIA & NEW ZEALAND
- AUSTRALIA & NEW ZEALAND FOOD DELIVERY PLATFORM FEE STRUCTURES MARKET SIZE & OPPORTUNITIES
- INDIA
- INDIA FOOD DELIVERY PLATFORM FEE STRUCTURES MARKET SIZE & OPPORTUNITIES
- SOUTH KOREA
- SOUTH KOREA FOOD DELIVERY PLATFORM FEE STRUCTURES MARKET SIZE & OPPORTUNITIES
- INDONESIA
- INDONESIA FOOD DELIVERY PLATFORM FEE STRUCTURES MARKET SIZE & OPPORTUNITIES
- THAILAND
- THAILAND FOOD DELIVERY PLATFORM FEE STRUCTURES MARKET SIZE & OPPORTUNITIES
- VIETNAM
- VIETNAM FOOD DELIVERY PLATFORM FEE STRUCTURES MARKET SIZE & OPPORTUNITIES
- SINGAPORE
- SINGAPORE FOOD DELIVERY PLATFORM FEE STRUCTURES MARKET SIZE & OPPORTUNITIES
- REST OF ASIA-PACIFIC
- REST OF ASIA-PACIFIC FOOD DELIVERY PLATFORM FEE STRUCTURES MARKET SIZE & OPPORTUNITIES
- CHINA
- REST OF WORLD
- MARKET ESTIMATES & SIZES
- REST OF WORLD FOOD DELIVERY PLATFORM FEE STRUCTURES MARKET DRIVERS
- REST OF WORLD FOOD DELIVERY PLATFORM FEE STRUCTURES MARKET CHALLENGES
- KEY REGIONAL PLAYERS & ECOSYSTEM
- REGIONAL ANALYSIS
- LATIN AMERICA
- LATIN AMERICA FOOD DELIVERY PLATFORM FEE STRUCTURES MARKET SIZE & OPPORTUNITIES
- MIDDLE EAST & AFRICA
- MIDDLE EAST & AFRICA FOOD DELIVERY PLATFORM FEE STRUCTURES MARKET SIZE & OPPORTUNITIES
- LATIN AMERICA
- NORTH AMERICA
COMPETITIVE LANDSCAPE
- KEY STRATEGIC DEVELOPMENTS
- MERGERS & ACQUISITIONS
- PRODUCT LAUNCHES & DEVELOPMENTS
- PARTNERSHIPS & AGREEMENTS
- BUSINESS EXPANSIONS & DIVESTITURES
- COMPETITOR POSITIONING & DIFFERENTIATION MAP
- COMPANY PROFILES
- DOORDASH INC
- COMPANY OVERVIEW
- PRODUCT LIST
- STRENGTHS & CHALLENGES
- UBER EATS
- COMPANY OVERVIEW
- PRODUCT LIST
- STRENGTHS & CHALLENGES
- MEITUAN DIANPING
- COMPANY OVERVIEW
- PRODUCT LIST
- STRENGTHS & CHALLENGES
- ZOMATO (ETERNAL)
- COMPANY OVERVIEW
- PRODUCT LIST
- STRENGTHS & CHALLENGES
- SWIGGY
- COMPANY OVERVIEW
- PRODUCT LIST
- STRENGTHS & CHALLENGES
- JUST EAT TAKEAWAY.COM
- COMPANY OVERVIEW
- PRODUCT LIST
- STRENGTHS & CHALLENGES
- GRUBHUB INC
- COMPANY OVERVIEW
- PRODUCT LIST
- STRENGTHS & CHALLENGES
- DELIVERY HERO SE
- COMPANY OVERVIEW
- PRODUCT LIST
- STRENGTHS & CHALLENGES
- FOODPANDA GMBH
- COMPANY OVERVIEW
- PRODUCT LIST
- STRENGTHS & CHALLENGES
- RAPPI INC
- COMPANY OVERVIEW
- PRODUCT LIST
- STRENGTHS & CHALLENGES
- DOORDASH INC
- KEY STRATEGIC DEVELOPMENTS
LIST OF TABLES
TABLE 1: MARKET SNAPSHOT – FOOD DELIVERY PLATFORM FEE STRUCTURES
TABLE 2: PRICING MODELS, FEE STRUCTURES & TAKE RATE OPTIMIZATION STRATEGIES
TABLE 3: REGULATORY & POLICY LANDSCAPE ANALYSIS
TABLE 4: MARKET BY DELIVERY MODE, BY REGION, HISTORICAL YEARS, 2022-2024 (IN $ MILLION)
TABLE 5: MARKET BY DELIVERY MODE, BY REGION, FORECAST YEARS, 2026-2034 (IN $ MILLION)
TABLE 6: PLATFORM-TO-CONSUMER DELIVERY MARKET, BY REGION, HISTORICAL YEARS, 2022-2024 (IN $ MILLION)
TABLE 7: PLATFORM-TO-CONSUMER DELIVERY MARKET, BY REGION, FORECAST YEARS, 2026-2034 (IN $ MILLION)
TABLE 8: RESTAURANT-TO-CONSUMER DELIVERY MARKET, BY REGION, HISTORICAL YEARS, 2022-2024 (IN $ MILLION)
TABLE 9: RESTAURANT-TO-CONSUMER DELIVERY MARKET, BY REGION, FORECAST YEARS, 2026-2034 (IN $ MILLION)
TABLE 10: MARKET BY PAYMENT METHOD, BY REGION, HISTORICAL YEARS, 2022-2024 (IN $ MILLION)
TABLE 11: MARKET BY PAYMENT METHOD, BY REGION, FORECAST YEARS, 2026-2034 (IN $ MILLION)
TABLE 12: ONLINE PAYMENT MARKET, BY REGION, HISTORICAL YEARS, 2022-2024 (IN $ MILLION)
TABLE 13: ONLINE PAYMENT MARKET, BY REGION, FORECAST YEARS, 2026-2034 (IN $ MILLION)
TABLE 14: CASH ON DELIVERY (COD) MARKET, BY REGION, HISTORICAL YEARS, 2022-2024 (IN $ MILLION)
TABLE 15: CASH ON DELIVERY (COD) MARKET, BY REGION, FORECAST YEARS, 2026-2034 (IN $ MILLION)
TABLE 16: MARKET BY REVENUE MODEL, BY REGION, HISTORICAL YEARS, 2022-2024 (IN $ MILLION)
TABLE 17: MARKET BY REVENUE MODEL, BY REGION, FORECAST YEARS, 2026-2034 (IN $ MILLION)
TABLE 18: COMMISSION-BASED REVENUE MARKET, BY REGION, HISTORICAL YEARS, 2022-2024 (IN $ MILLION)
TABLE 19: COMMISSION-BASED REVENUE MARKET, BY REGION, FORECAST YEARS, 2026-2034 (IN $ MILLION)
TABLE 20: DELIVERY FEE-BASED REVENUE MARKET, BY REGION, HISTORICAL YEARS, 2022-2024 (IN $ MILLION)
TABLE 21: DELIVERY FEE-BASED REVENUE MARKET, BY REGION, FORECAST YEARS, 2026-2034 (IN $ MILLION)
TABLE 22: ADVERTISING & PROMOTION REVENUE MARKET, BY REGION, HISTORICAL YEARS, 2022-2024 (IN $ MILLION)
TABLE 23: ADVERTISING & PROMOTION REVENUE MARKET, BY REGION, FORECAST YEARS, 2026-2034 (IN $ MILLION)
TABLE 24: SUBSCRIPTION-BASED REVENUE MARKET, BY REGION, HISTORICAL YEARS, 2022-2024 (IN $ MILLION)
TABLE 25: SUBSCRIPTION-BASED REVENUE MARKET, BY REGION, FORECAST YEARS, 2026-2034 (IN $ MILLION)
TABLE 26: MARKET BY PRODUCT TYPE, BY REGION, HISTORICAL YEARS, 2022-2024 (IN $ MILLION)
TABLE 27: MARKET BY PRODUCT TYPE, BY REGION, FORECAST YEARS, 2026-2034 (IN $ MILLION)
TABLE 28: MEAL DELIVERY MARKET, BY REGION, HISTORICAL YEARS, 2022-2024 (IN $ MILLION)
TABLE 29: MEAL DELIVERY MARKET, BY REGION, FORECAST YEARS, 2026-2034 (IN $ MILLION)
TABLE 30: GROCERY DELIVERY MARKET, BY REGION, HISTORICAL YEARS, 2022-2024 (IN $ MILLION)
TABLE 31: GROCERY DELIVERY MARKET, BY REGION, FORECAST YEARS, 2026-2034 (IN $ MILLION)
TABLE 32: MEAL KIT DELIVERY MARKET, BY REGION, HISTORICAL YEARS, 2022-2024 (IN $ MILLION)
TABLE 33: MEAL KIT DELIVERY MARKET, BY REGION, FORECAST YEARS, 2026-2034 (IN $ MILLION)
TABLE 34: ALCOHOL DELIVERY MARKET, BY REGION, HISTORICAL YEARS, 2022-2024 (IN $ MILLION)
TABLE 35: ALCOHOL DELIVERY MARKET, BY REGION, FORECAST YEARS, 2026-2034 (IN $ MILLION)
TABLE 36: OTHER PRODUCT TYPES MARKET, BY REGION, HISTORICAL YEARS, 2022-2024 (IN $ MILLION)
TABLE 37: OTHER PRODUCT TYPES MARKET, BY REGION, FORECAST YEARS, 2026-2034 (IN $ MILLION)
TABLE 38: MARKET BY GEOGRAPHICAL ANALYSIS, HISTORICAL YEARS, 2022-2024 (IN $ MILLION)
TABLE 39: MARKET BY GEOGRAPHICAL ANALYSIS, FORECAST YEARS, 2026-2034 (IN $ MILLION)
TABLE 40: NORTH AMERICA MARKET, COUNTRY ANALYSIS, HISTORICAL YEARS, 2022-2024 (IN $ MILLION)
TABLE 41: NORTH AMERICA MARKET, COUNTRY ANALYSIS, FORECAST YEARS, 2026-2034 (IN $ MILLION)
TABLE 42: KEY PLAYERS OPERATING IN THE NORTH AMERICAN MARKET
TABLE 43: EUROPE MARKET, COUNTRY ANALYSIS, HISTORICAL YEARS, 2022-2024 (IN $ MILLION)
TABLE 44: EUROPE MARKET, COUNTRY ANALYSIS, FORECAST YEARS, 2026-2034 (IN $ MILLION)
TABLE 45: KEY PLAYERS OPERATING IN THE EUROPEAN MARKET
TABLE 46: ASIA-PACIFIC MARKET, COUNTRY ANALYSIS, HISTORICAL YEARS, 2022-2024 (IN $ MILLION)
TABLE 47: ASIA-PACIFIC MARKET, COUNTRY ANALYSIS, FORECAST YEARS, 2026-2034 (IN $ MILLION)
TABLE 48: KEY PLAYERS OPERATING IN THE ASIA-PACIFIC MARKET
TABLE 49: REST OF WORLD MARKET, REGIONAL ANALYSIS, HISTORICAL YEARS, 2022-2024 (IN $ MILLION)
TABLE 50: REST OF WORLD MARKET, REGIONAL ANALYSIS, FORECAST YEARS, 2026-2034 (IN $ MILLION)
TABLE 51: KEY PLAYERS OPERATING IN THE REST OF WORLD MARKET
TABLE 52: LIST OF MERGERS & ACQUISITIONS
TABLE 53: LIST OF PRODUCT LAUNCHES & DEVELOPMENTS
TABLE 54: LIST OF PARTNERSHIPS & AGREEMENTS
TABLE 55: LIST OF BUSINESS EXPANSIONS & DIVESTITURES
LIST OF FIGURES
FIGURE 1: MAJOR MARKET FINDINGS
FIGURE 2: MARKET DYNAMICS
FIGURE 3: KEY MARKET TRENDS
FIGURE 4: PORTER’S FIVE FORCES ANALYSIS
FIGURE 5: GROWTH PROSPECT MAPPING FOR NORTH AMERICA
FIGURE 6: GROWTH PROSPECT MAPPING FOR EUROPE
FIGURE 7: GROWTH PROSPECT MAPPING FOR ASIA-PACIFIC
FIGURE 8: GROWTH PROSPECT MAPPING FOR REST OF WORLD
FIGURE 9: MARKET MATURITY ANALYSIS
FIGURE 10: MARKET CONCENTRATION ANALYSIS
FIGURE 11: VALUE CHAIN ANALYSIS
FIGURE 12: KEY BUYING CRITERIA
FIGURE 13: SEGMENT GROWTH POTENTIAL, BY DELIVERY MODE, IN 2025
FIGURE 14: PLATFORM-TO-CONSUMER DELIVERY MARKET SIZE, 2026-2034 (IN $ MILLION)
FIGURE 15: RESTAURANT-TO-CONSUMER DELIVERY MARKET SIZE, 2026-2034 (IN $ MILLION)
FIGURE 16: SEGMENT GROWTH POTENTIAL, BY PAYMENT METHOD, IN 2025
FIGURE 17: ONLINE PAYMENT MARKET SIZE, 2026-2034 (IN $ MILLION)
FIGURE 18: CASH ON DELIVERY (COD) MARKET SIZE, 2026-2034 (IN $ MILLION)
FIGURE 19: SEGMENT GROWTH POTENTIAL, BY REVENUE MODEL, IN 2025
FIGURE 20: COMMISSION-BASED REVENUE MARKET SIZE, 2026-2034 (IN $ MILLION)
FIGURE 21: DELIVERY FEE-BASED REVENUE MARKET SIZE, 2026-2034 (IN $ MILLION)
FIGURE 22: ADVERTISING & PROMOTION REVENUE MARKET SIZE, 2026-2034 (IN $ MILLION)
FIGURE 23: SUBSCRIPTION-BASED REVENUE MARKET SIZE, 2026-2034 (IN $ MILLION)
FIGURE 24: SEGMENT GROWTH POTENTIAL, BY PRODUCT TYPE, IN 2025
FIGURE 25: MEAL DELIVERY MARKET SIZE, 2026-2034 (IN $ MILLION)
FIGURE 26: GROCERY DELIVERY MARKET SIZE, 2026-2034 (IN $ MILLION)
FIGURE 27: MEAL KIT DELIVERY MARKET SIZE, 2026-2034 (IN $ MILLION)
FIGURE 28: ALCOHOL DELIVERY MARKET SIZE, 2026-2034 (IN $ MILLION)
FIGURE 29: OTHER PRODUCT TYPES MARKET SIZE, 2026-2034 (IN $ MILLION)
FIGURE 30: NORTH AMERICA WINE MARKET, COUNTRY OUTLOOK, 2025 & 2034 (IN %)
FIGURE 31: UNITED STATES MARKET SIZE, 2026-2034 (IN $ MILLION)
FIGURE 32: CANADA MARKET SIZE, 2026-2034 (IN $ MILLION)
FIGURE 33: EUROPE WINE MARKET, COUNTRY OUTLOOK, 2025 & 2034 (IN %)
FIGURE 34: GERMANY MARKET SIZE, 2026-2034 (IN $ MILLION)
FIGURE 35: UNITED KINGDOM MARKET SIZE, 2026-2034 (IN $ MILLION)
FIGURE 36: FRANCE MARKET SIZE, 2026-2034 (IN $ MILLION)
FIGURE 37: ITALY MARKET SIZE, 2026-2034 (IN $ MILLION)
FIGURE 38: SPAIN MARKET SIZE, 2026-2034 (IN $ MILLION)
FIGURE 39: BELGIUM MARKET SIZE, 2026-2034 (IN $ MILLION)
FIGURE 40: POLAND MARKET SIZE, 2026-2034 (IN $ MILLION)
FIGURE 41: REST OF EUROPE MARKET SIZE, 2026-2034 (IN $ MILLION)
FIGURE 42: ASIA-PACIFIC WINE MARKET, COUNTRY OUTLOOK, 2025 & 2034 (IN %)
FIGURE 43: CHINA MARKET SIZE, 2026-2034 (IN $ MILLION)
FIGURE 44: INDIA MARKET SIZE, 2026-2034 (IN $ MILLION)
FIGURE 45: JAPAN MARKET SIZE, 2026-2034 (IN $ MILLION)
FIGURE 46: AUSTRALIA & NEW ZEALAND MARKET SIZE, 2026-2034 (IN $ MILLION)
FIGURE 47: SOUTH KOREA MARKET SIZE, 2026-2034 (IN $ MILLION)
FIGURE 48: THAILAND MARKET SIZE, 2026-2034 (IN $ MILLION)
FIGURE 49: INDONESIA MARKET SIZE, 2026-2034 (IN $ MILLION)
FIGURE 50: VIETNAM MARKET SIZE, 2026-2034 (IN $ MILLION)
FIGURE 51: SINGAPORE MARKET SIZE, 2026-2034 (IN $ MILLION)
FIGURE 52: REST OF ASIA-PACIFIC MARKET SIZE, 2026-2034 (IN $ MILLION)
FIGURE 53: REST OF WORLD WINE MARKET, REGIONAL OUTLOOK, 2025 & 2034 (IN %)
FIGURE 54: LATIN AMERICA MARKET SIZE, 2026-2034 (IN $ MILLION)
FIGURE 55: MIDDLE EAST & AFRICA MARKET SIZE, 2026-2034 (IN $ MILLION)
FAQ’s
FAQs
The global food delivery platform fee structures market is valued at $119.88 billion in 2026 and is projected to reach $259.97 billion by 2034. The market is growing at a CAGR of 10.16%, driven by the rapid expansion of online food delivery platforms and evolving food delivery commission rates globally.
Food delivery commission rates typically range from 15% to 35% of each order value, depending on the platform, market, and service tier. Platforms like DoorDash, Uber Eats, and Grubhub offer tiered food delivery platform pricing plans, where higher commissions generally come with greater marketing visibility and delivery support for restaurant partners.
The primary food delivery platform revenue models include commission-based revenue, delivery fee-based revenue, advertising and promotion revenue, and subscription-based revenue. Most major online food delivery platforms combine several of these streams, with restaurant delivery commission remaining the largest single source of food delivery platform income.
Regulators in cities like New York and across the European Union have introduced commission cap legislation and transparency mandates in response to concerns that high food delivery service charges were undermining restaurant profitability, particularly for small and independent operators. These regulations are reshaping food delivery platform fee structure design across key markets.
In the platform-to-consumer delivery model, the food delivery platform manages last-mile logistics and charges the restaurant a higher food delivery commission rate to cover delivery costs. In restaurant-to-consumer delivery, the restaurant handles its own logistics, and the online food ordering platform fee is typically lower, covering only digital ordering and marketplace access rather than physical delivery.
Asia-Pacific is the fastest-growing regional market, with a CAGR of 11.17% between 2026 and 2034, fueled by China’s massive online food delivery ecosystem, India’s rapid smartphone adoption, and Southeast Asia’s expanding middle-class consumer base. The region’s food delivery platform pricing trends are being closely watched by global platforms seeking to refine their international food delivery commission analysis and market entry strategies.
RELATED REPORTS
-

LATIN AMERICA FACIAL RECOGNITION MARKET FORECAST 2019-2028
-

UNITED STATES AI-DRIVEN CLOUD MIGRATION SERVICES MARKET FORECAST 2026-2034
-

UNITED KINGDOM AI-DRIVEN CLOUD MIGRATION SERVICES MARKET FORECAST 2026-2034
-

UNITED ARAB EMIRATES AI-DRIVEN CLOUD MIGRATION SERVICES MARKET FORECAST 2026-2034
-

SOUTH KOREA AI-DRIVEN CLOUD MIGRATION SERVICES MARKET FORECAST 2026-2034
-

SINGAPORE AI-DRIVEN CLOUD MIGRATION SERVICES MARKET FORECAST 2026-2034
-

SAUDI ARABIA AI-DRIVEN CLOUD MIGRATION SERVICES MARKET FORECAST 2026-2034
-

AUSTRALIA AI-DRIVEN CLOUD MIGRATION SERVICES MARKET FORECAST 2026-2034
-

JAPAN AI-DRIVEN CLOUD MIGRATION SERVICES MARKET FORECAST 2026-2034
-

INDIA AI-DRIVEN CLOUD MIGRATION SERVICES MARKET FORECAST 2026-2034