Global Computer Vision Applications in Mobility Market by Component (Hardware, Vision Processing & Compute, Software, Services), Market by Application (Advanced Driver Assistance Systems (ADAS), Autonomous Driving, Driver & Occupant Monitoring, Surround View & Parking Assistance, Other Applications), Market by Vehicle Type (Passenger Vehicles, Light Commercial Vehicles, Heavy Commercial Vehicles), by Geography
GLOBAL COMPUTER VISION APPLICATIONS IN MOBILITY MARKET OVERVIEW
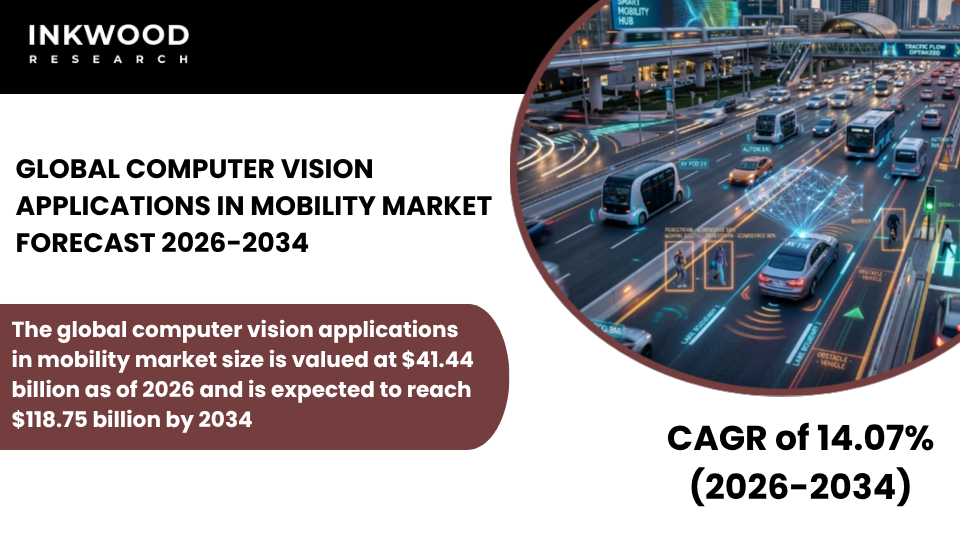
The global computer vision applications in mobility market size is valued at $41.44 billion as of 2026 and is expected to reach $118.75 billion by 2034, growing at a CAGR of 14.07% during the forecast period 2026–2034. The base year considered for the study is 2025, and the forecast period is between 2026 and 2034. The market study has also analyzed the crisis impact on the computer vision applications in mobility market qualitatively as well as quantitatively.
Computer vision applications in mobility refer to the use of AI-driven image processing and perception technologies to enable vehicles, transportation infrastructure, and mobility platforms to interpret and respond to their visual environment. These systems rely on cameras, sensors, deep learning algorithms, and real-time processing hardware to perform critical functions such as object detection, lane recognition, pedestrian identification, traffic signal interpretation, and driver behavior monitoring.
Spanning a wide range of use cases, from advanced driver assistance systems and fully autonomous vehicles to smart traffic management and fleet surveillance, computer vision has become a foundational layer of modern intelligent transportation systems. As automakers, technology companies, and urban planners converge on safer and more efficient mobility ecosystems, these applications are increasingly embedded across passenger cars, commercial vehicles, and public transit infrastructure worldwide.
The global computer vision in transportation market is experiencing robust growth, driven by the rapid integration of AI and machine learning into automotive and mobility platforms. Escalating road safety mandates from governments worldwide, combined with surging consumer and commercial demand for autonomous and semi-autonomous vehicles, are fundamentally reshaping mobility ecosystems.
Simultaneously, advancements in edge computing, neural processing units, and camera sensor technology are enabling more cost-effective and accurate real-time vision processing, making computer vision mobility solutions accessible beyond premium vehicle segments and expanding into mass-market and commercial fleet applications.
To Know More About This Report, Request a Free Sample Copy
GROWTH ENABLERS
Key enablers of the global computer vision applications in mobility market growth:
- Increasing global road safety regulations and government mandates for advanced driver assistance systems are driving demand for computer vision technologies
- Rapid advancements in artificial intelligence, deep learning, and edge computing are enabling higher accuracy and real-time processing
- Growing demand for autonomous and semi-autonomous vehicles is accelerating the adoption of computer vision
- The increasing use of computer vision in mobility services such as ride-sharing, fleet management, and traffic surveillance is supporting market expansion
- The growing deployment of computer vision in ride-sharing, fleet management, and traffic surveillance represents a powerful and often underappreciated growth lever for the AI computer vision mobility market. Ride-hailing platforms and logistics operators are leveraging in-cabin vision systems to monitor driver alertness, verify passenger safety, and reduce insurance liabilities.
- Fleet operators, meanwhile, are deploying external camera arrays for real-time lane deviation alerts, collision warnings, and route optimization. On the infrastructure side, city governments and transport authorities are installing computer vision-enabled traffic management systems to dynamically control signal timing, monitor congestion, and enforce traffic regulations.
- According to the S. Department of Transportation, intelligent transportation system investments are expanding across major American cities, with camera-based analytics forming a core component of smart corridor programs.
- Globally, the proliferation of these mobility service applications is broadening the addressable market well beyond traditional automotive OEMs, creating sustained demand across software platforms, cloud analytics providers, and embedded hardware manufacturers.
Key growth restraining factors of the global computer vision applications in mobility market:
- High development costs associated with advanced vision sensors, AI models, and computational hardware can limit adoption among smaller automotive manufacturers and mobility service providers
- Technical limitations related to adverse weather conditions, low visibility, and complex traffic environments can affect accuracy
- Data privacy and surveillance concerns related to camera-based monitoring systems may create regulatory and public acceptance challenges
- Integration complexities between computer vision software, vehicle electronics, and multi-sensor architectures can slow down deployment
- Integration complexity is one of the most pressing operational challenges in the computer vision automotive market. Modern vehicles rely on multiple electronic control units (ECUs), sensor modalities, including radar, LiDAR, ultrasonic sensors, and cameras, and embedded software stacks that must work in seamless coordination.
- Incorporating computer vision software into this architecture requires extensive validation cycles, hardware abstraction layers, and compliance with automotive-grade standards such as ISO 26262 (functional safety) and AUTOSAR frameworks. For OEMs integrating third-party computer vision platforms, the challenge is compounded by proprietary software ecosystems, varying data interface standards, and the need to meet stringent real-time latency requirements.
- These complexities significantly extend development timelines and increase go-to-market costs, creating a particularly high barrier for smaller Tier 2 and Tier 3 suppliers. As per guidance from the European Union Agency for Cybersecurity (ENISA), automotive systems with AI components also face growing requirements for security and resilience, adding a further layer of integration work that can slow deployment across the intelligent mobility computer vision market.
KEY MARKET TRENDS
Global Computer Vision Applications in Mobility Industry | Top Trends
- One of the most significant trends reshaping the computer vision transportation technology market is the shift from single-sensor to multi-sensor fusion architectures. Automotive engineers are increasingly combining camera-based computer vision with radar and LiDAR data to create more robust and redundant perception systems. This approach compensates for the individual limitations of each sensor type, for instance, cameras excel in object classification and lane detection but struggle in low-light or heavy rain conditions, while radar performs reliably in adverse weather. By fusing inputs from multiple modalities using AI-based algorithms, mobility systems achieve a more complete and reliable picture of the surrounding environment, directly supporting higher levels of autonomous driving.
- The development and deployment of driver monitoring systems (DMS) powered by computer vision is accelerating rapidly across the global computer vision in transportation market. These systems use in-cabin cameras and deep learning models to track eye gaze, head position, facial expressions, and micro-movements to detect driver fatigue, distraction, and impairment in real time.
- The transition from cloud-dependent to edge-based AI inference is fundamentally changing the architecture of automotive computer vision systems market solutions. Deploying AI models directly on in-vehicle processors, using chips such as NVIDIA’s Drive platform, Qualcomm’s Snapdragon Ride, or Mobileye’s EyeQ series, eliminates the latency associated with cloud data transmission and enables real-time decision-making at the millisecond level required for safe autonomous navigation. This trend is being reinforced by concerns around connectivity reliability in tunnels, rural areas, and bandwidth-constrained environments.
- Beyond the vehicle itself, computer vision mobility solutions are rapidly expanding into urban infrastructure applications. Smart city authorities are deploying high-resolution camera networks powered by AI vision algorithms to monitor traffic flow, detect incidents, enforce speed limits, and manage automated tolling systems. The International Transport Forum (ITF) has noted that intelligent transportation systems, including vision-based traffic analytics, are increasingly central to national road safety and urban mobility strategies across OECD countries. Automated tolling and license plate recognition systems, key use cases within the computer vision for traffic monitoring and mobility management segment, reduce operational costs and congestion at toll plazas while generating rich mobility data for urban planners.
MARKET SEGMENTATION
Market Segmentation – Component, Application, and Vehicle Type
Market by Component:
- Hardware
- Hardware forms the foundational physical layer of the computer vision applications in mobility market, encompassing image sensors, cameras, embedded processors, and associated optics. This sub-segment includes monocular and stereo cameras, event-based sensors, infrared imagers, and the ruggedized enclosures necessary for automotive-grade deployment.
- The key features that distinguish automotive-grade vision hardware include wide dynamic range, high frame rates, thermal stability, and compliance with standards such as AEC-Q100 for automotive semiconductor reliability.
- Hardware demand is directly driven by rising vehicle production volumes, the increasing number of cameras per vehicle, which is growing significantly as ADAS and autonomous driving features proliferate, and the mandated inclusion of systems. These include automatic emergency braking, lane keeping assistance, and rearview cameras by regulators in the United States, the European Union, and other major automotive markets.
- According to the National Highway Traffic Safety Administration (NHTSA), rear-visibility camera standards have been mandatory for all new light vehicles sold in the U.S. since May 2018, establishing a baseline of camera hardware installation that subsequent ADAS requirements continue to build upon.
- As a result, hardware remains the largest and most foundational revenue-generating segment within the global automotive computer vision systems market, with volume growth closely tied to global vehicle production trends and regulatory mandates.
- Vision Processing & Compute
- Software
- Services
Market by Application:
- Advanced Driver Assistance Systems (ADAS)
- Autonomous Driving
- Driver & Occupant Monitoring
- Surround View & Parking Assistance
- Other Applications
Market by Vehicle Type:
- Passenger Vehicles
- Light Commercial Vehicles
- Heavy Commercial Vehicles
Geographical Study based on Four Major Regions:
- North America: The United States and Canada
- The North America computer vision applications in mobility market size is valued at $11,382.09 million as of 2026 and is expected to reach $30,202.97 million by 2034, growing at a CAGR of 12.97% during the forecast period 2026–2034.
- North America remains one of the most mature and strategically significant regions within the global computer vision in transportation market. The United States is home to several of the world’s leading autonomous vehicle developers and technology platforms, including Waymo, Tesla, and Cruise, whose substantial R&D investments are continuously advancing the state of computer vision for autonomous vehicle market applications.
- Federal regulatory support through the National Highway Traffic Safety Administration (NHTSA) and the U.S. Department of Transportation’s (DOT) Automated Vehicles Comprehensive Plan is creating a structured policy environment conducive to commercial deployment.
- In Canada, government-backed smart city and connected vehicle initiatives, particularly in Ontario and Quebec, are further stimulating demand for AI computer vision mobility market solutions. Together, the two countries present a compelling combination of regulatory clarity, technology investment, and automotive manufacturing activity that underpins strong and sustained regional market growth.
- Europe: The United Kingdom, Germany, France, Italy, Spain, Poland, Belgium, and Rest of Europe
- The Europe computer vision applications in mobility market size is valued at $9,572.02 million as of 2026 and is expected to reach $25,848.56 million by 2034, growing at a CAGR of 13.22% during the forecast period 2026–2034.
- Europe is distinguished by one of the most stringent and proactive regulatory environments for automotive safety technology globally, making it a critical growth market for the computer vision automotive market. The European Commission’s General Safety Regulation (EU) 2019/2144 mandates a broad suite of safety technologies, including emergency lane keeping, intelligent speed assistance, and driver drowsiness detection, that are directly dependent on computer vision systems.
- Germany, as Europe’s largest automotive economy and home to OEMs such as Volkswagen, BMW, and Mercedes-Benz, as well as major Tier 1 suppliers including Bosch and Continental, continues to drive significant technology investment in computer vision mobility solutions. The United Kingdom, meanwhile, is advancing its own autonomous vehicle legislative framework following its Automated Vehicles Act, creating fresh commercial opportunities for intelligent mobility computer vision providers.
- Across the region, the convergence of regulatory mandates, established automotive manufacturing clusters, and active smart city programs positions Europe as a high-growth, high-compliance market within the global computer vision transportation technology market.
- Asia-Pacific: China, India, Japan, Australia & New Zealand, South Korea, Thailand, Indonesia, Vietnam, Singapore, and Rest of Asia-Pacific
- The Asia-Pacific computer vision applications in mobility market size is valued at $16,351.91 million as of 2026 and is expected to reach $50,151.05 million by 2034, growing at a CAGR of 15.04% during the forecast period 2026–2034.
- Asia-Pacific represents the fastest-growing regional market within the global computer vision applications in mobility market, driven by the dual engines of China’s expansive autonomous vehicle ecosystem and Japan’s deep-rooted automotive technology leadership. China is aggressively advancing both its domestic EV industry and its smart transportation infrastructure, with government-backed programs supporting the deployment of intelligent transportation systems and vehicle-to-infrastructure (V2I) communication networks across major urban centers.
- The Ministry of Industry and Information Technology (MIIT) of China has released multiple policy frameworks promoting the development and commercialization of intelligent connected vehicles (ICVs), directly accelerating demand for AI computer vision mobility market solutions. Japan, anchored by automotive giants Toyota, Honda, and Denso, continues to lead in ADAS integration and camera-based safety systems, with computer vision embedded across a broad range of vehicle categories.
- The region’s large vehicle production volumes, rapidly expanding middle-class consumer base, and government commitment to reducing road fatalities collectively make Asia-Pacific the most dynamic and high-potential geography in the global computer vision transportation technology market.
- Rest of World: Latin America, the Middle East & Africa
Our market research reports offer an in-depth analysis of individual country-level market size and growth statistics. We cover the segmentation analysis, key growth factors, and macro-economic trends within the computer vision applications in mobility market, providing detailed insights into –
MAJOR PLAYERS
The major players in the global computer vision applications in mobility market are:
- Mobileye
- NVIDIA Corporation
- Robert Bosch GmbH
- Continental AG
- Valeo SA
Key strategies adopted by some of these companies:
- Mobileye announced the commercial launch of its SuperVision™ surround-view perception system with select automotive OEM partners, expanding its footprint in the Level 2+ autonomous driving segment. This deployment marked a significant step in Mobileye’s strategy to move from supplying discrete ADAS chips to delivering full-stack computer vision mobility solutions, strengthening its competitive positioning in the intelligent mobility computer vision market.
- NVIDIA announced an expanded partnership with BYD, one of the world’s largest electric vehicle manufacturers, to deploy NVIDIA DRIVE Orin-based AI computing platforms across BYD’s next-generation EV lineup. This collaboration deepens NVIDIA’s integration into the automotive computer vision systems market in China, directly supporting the development of advanced ADAS and autonomous driving capabilities at scale.
- Continental AG announced the expansion of its ADAS development center in Bangalore, India, to accelerate the localization of computer vision and sensor fusion technologies for Asian automotive markets. This strategic expansion reflects Continental’s intent to scale its automotive computer vision systems market presence across high-growth emerging economies, leveraging India’s engineering talent base to support global R&D for intelligent mobility platforms.
REPORT SYNOPSIS
| REPORT SCOPE | DETAILS |
|---|---|
| Market Forecast Years | 2026-2034 |
| Base Year | 2025 |
| Market Historical Years | 2022-2024 |
| Forecast Units | Revenue ($ Million) |
| Segments Analyzed | Component, Application, Vehicle Type |
| Geographies Analyzed | North America, Europe, Asia-Pacific, Rest of World |
| Companies Analyzed | Mobileye, NVIDIA Corporation, Robert Bosch GmbH, Continental AG, Valeo SA, DENSO Corporation, Magna International Inc, Qualcomm Technologies Inc, Tesla Inc, Netradyne |
TABLE OF CONTENTS
RESEARCH SCOPE & METHODOLOGY
- STUDY OBJECTIVES
- METHODOLOGY
- ASSUMPTIONS & LIMITATIONS
EXECUTIVE SUMMARY & KEY INSIGHTS
- MARKET SIZE, SHARE & ESTIMATES
- MARKET OVERVIEW
- SCOPE OF STUDY
- MAJOR MARKET FINDINGS
- RISING ADOPTION OF ADVANCED DRIVER ASSISTANCE SYSTEMS (ADAS) AND AUTONOMOUS DRIVING TECHNOLOGIES IS ACCELERATING THE INTEGRATION OF COMPUTER VISION SOLUTIONS IN MOBILITY ECOSYSTEMS
- THE GROWING DEPLOYMENT OF CAMERA-BASED SENSOR SYSTEMS IN VEHICLES IS ENABLING REAL-TIME OBJECT DETECTION, LANE TRACKING, AND PEDESTRIAN RECOGNITION TO ENHANCE ROAD SAFETY AND DRIVING EFFICIENCY
- AUTOMOTIVE OEMS AND MOBILITY TECHNOLOGY PROVIDERS ARE INCREASINGLY INVESTING IN AI-POWERED COMPUTER VISION PLATFORMS TO SUPPORT AUTONOMOUS NAVIGATION, DRIVER MONITORING, AND TRAFFIC ANALYTICS APPLICATIONS
- THE EXPANSION OF SMART CITY INITIATIVES AND INTELLIGENT TRANSPORTATION SYSTEMS IS CREATING NEW OPPORTUNITIES FOR COMPUTER VISION IN TRAFFIC MANAGEMENT, VEHICLE MONITORING, AND URBAN MOBILITY OPTIMIZATION
MARKET DYNAMICS
- KEY DRIVERS
- INCREASING GLOBAL ROAD SAFETY REGULATIONS AND GOVERNMENT MANDATES FOR ADVANCED DRIVER ASSISTANCE SYSTEMS ARE DRIVING DEMAND FOR COMPUTER VISION TECHNOLOGIES
- RAPID ADVANCEMENTS IN ARTIFICIAL INTELLIGENCE, DEEP LEARNING, AND EDGE COMPUTING ARE ENABLING HIGHER ACCURACY AND REAL-TIME PROCESSING
- GROWING DEMAND FOR AUTONOMOUS AND SEMI-AUTONOMOUS VEHICLES IS ACCELERATING THE ADOPTION OF COMPUTER VISION
- THE INCREASING USE OF COMPUTER VISION IN MOBILITY SERVICES SUCH AS RIDE-SHARING, FLEET MANAGEMENT, AND TRAFFIC SURVEILLANCE IS SUPPORTING MARKET EXPANSION
- KEY RESTRAINTS
- HIGH DEVELOPMENT COSTS ASSOCIATED WITH ADVANCED VISION SENSORS, AI MODELS, AND COMPUTATIONAL HARDWARE CAN LIMIT ADOPTION AMONG SMALLER AUTOMOTIVE MANUFACTURERS AND MOBILITY SERVICE PROVIDERS
- TECHNICAL LIMITATIONS RELATED TO ADVERSE WEATHER CONDITIONS, LOW VISIBILITY, AND COMPLEX TRAFFIC ENVIRONMENTS CAN AFFECT ACCURACY
- DATA PRIVACY AND SURVEILLANCE CONCERNS RELATED TO CAMERA-BASED MONITORING SYSTEMS MAY CREATE REGULATORY AND PUBLIC ACCEPTANCE CHALLENGES
- INTEGRATION COMPLEXITIES BETWEEN COMPUTER VISION SOFTWARE, VEHICLE ELECTRONICS, AND MULTI-SENSOR ARCHITECTURES CAN SLOW DOWN DEPLOYMENT
- KEY DRIVERS
STRATEGIC MARKET ANALYTICS
- GROWTH METRICS
- TAM, SAM & SOM OPPORTUNITY ANALYSIS
- EMERGING MARKET TRENDS & PARADIGM SHIFTS
- INCREASING INTEGRATION OF MULTI-SENSOR FUSION COMBINING CAMERAS, RADAR, AND LIDAR WITH COMPUTER VISION ALGORITHMS TO IMPROVE PERCEPTION CAPABILITIES IN AUTONOMOUS MOBILITY SYSTEMS
- RISING DEVELOPMENT OF DRIVER MONITORING SYSTEMS USING COMPUTER VISION TO DETECT FATIGUE, DISTRACTION, AND DRIVER BEHAVIOR IN REAL TIME
- GROWING ADOPTION OF EDGE AI PROCESSORS IN VEHICLES TO ENABLE FASTER COMPUTER VISION INFERENCE WITHOUT DEPENDENCE ON CLOUD INFRASTRUCTURE
- EXPANSION OF COMPUTER VISION APPLICATIONS IN SMART TRAFFIC MANAGEMENT, AUTOMATED TOLLING, AND URBAN MOBILITY ANALYTICS
- PORTER’S FIVE FORCES ANALYSIS
- BUYERS POWER
- SUPPLIERS POWER
- SUBSTITUTION
- NEW ENTRANTS
- INDUSTRY RIVALRY
- PESTLE ANALYSIS
- POLITICAL
- ECONOMIC
- SOCIAL LANDSCAPE
- TECHNOLOGY
- LEGAL
- ENVIRONMENTAL
- GROWTH OPPORTUNITY MAPPING & HEATMAP
- GROWTH PROSPECT MAPPING FOR NORTH AMERICA
- GROWTH PROSPECT MAPPING FOR EUROPE
- GROWTH MAPPING PROSPECT FOR ASIA-PACIFIC
- GROWTH MAPPING PROSPECT FOR REST OF WORLD
- MARKET MATURITY & LIFECYCLE ANALYSIS
- MARKET CONCENTRATION ANALYSIS
- GROWTH METRICS
COMPUTER VISION APPLICATIONS IN MOBILITY VALUE CHAIN & DECISION FRAMEWORK
- VALUE CHAIN ANALYSIS
- IMAGE SENSOR MANUFACTURING
- VISION HARDWARE DESIGN
- AI MODEL DEVELOPMENT
- AUTOMOTIVE SYSTEM INTEGRATION
- SOFTWARE PLATFORM DEVELOPMENT
- OEM VEHICLE DEPLOYMENT
- AFTERMARKET MOBILITY SOLUTIONS
- KEY BUYING CRITERIA
- VISION ACCURACY
- REAL TIME PROCESSING
- SYSTEM INTEGRATION
- REGULATORY COMPLIANCE
- PRICING MODELS, PLATFORM LICENSING FRAMEWORKS & AI SOFTWARE MONETIZATION STRATEGIES
- REGULATORY & POLICY LANDSCAPE ANALYSIS
- VALUE CHAIN ANALYSIS
COMPUTER VISION APPLICATIONS IN MOBILITY MARKET BY COMPONENT
- HARDWARE
- MARKET SIZE, FORECAST & SHARE (2022–2034)
- VISION PROCESSING & COMPUTE
- MARKET SIZE, FORECAST & SHARE (2022–2034)
- SOFTWARE
- MARKET SIZE, FORECAST & SHARE (2022–2034)
- SERVICES
- MARKET SIZE, FORECAST & SHARE (2022–2034)
- HARDWARE
COMPUTER VISION APPLICATIONS IN MOBILITY MARKET BY APPLICATION
- ADVANCED DRIVER ASSISTANCE SYSTEMS (ADAS)
- MARKET SIZE, FORECAST & SHARE (2022–2034)
- AUTONOMOUS DRIVING
- MARKET SIZE, FORECAST & SHARE (2022–2034)
- DRIVER & OCCUPANT MONITORING
- MARKET SIZE, FORECAST & SHARE (2022–2034)
- SURROUND VIEW & PARKING ASSISTANCE
- MARKET SIZE, FORECAST & SHARE (2022–2034)
- OTHER APPLICATIONS
- MARKET SIZE, FORECAST & SHARE (2022–2034)
- ADVANCED DRIVER ASSISTANCE SYSTEMS (ADAS)
COMPUTER VISION APPLICATIONS IN MOBILITY MARKET BY VEHICLE TYPE
- PASSENGER VEHICLES
- MARKET SIZE, FORECAST & SHARE (2022–2034)
- LIGHT COMMERCIAL VEHICLES
- MARKET SIZE, FORECAST & SHARE (2022–2034)
- HEAVY COMMERCIAL VEHICLES
- MARKET SIZE, FORECAST & SHARE (2022–2034)
- PASSENGER VEHICLES
GEOGRAPHICAL ANALYSIS
- NORTH AMERICA
- MARKET SIZE & ESTIMATES
- NORTH AMERICA COMPUTER VISION APPLICATIONS IN MOBILITY MARKET DRIVERS
- NORTH AMERICA COMPUTER VISION APPLICATIONS IN MOBILITY MARKET CHALLENGES
- KEY REGIONAL PLAYERS & ECOSYSTEM
- COUNTRY ANALYSIS
- UNITED STATES
- UNITED STATES COMPUTER VISION APPLICATIONS IN MOBILITY MARKET SIZE & OPPORTUNITIES
- CANADA
- CANADA COMPUTER VISION APPLICATIONS IN MOBILITY MARKET SIZE & OPPORTUNITIES
- UNITED STATES
- EUROPE
- MARKET SIZE & ESTIMATES
- EUROPE COMPUTER VISION APPLICATIONS IN MOBILITY MARKET DRIVERS
- EUROPE COMPUTER VISION APPLICATIONS IN MOBILITY MARKET CHALLENGES
- KEY REGIONAL PLAYERS & ECOSYSTEM
- COUNTRY ANALYSIS
- UNITED KINGDOM
- UNITED KINGDOM COMPUTER VISION APPLICATIONS IN MOBILITY MARKET SIZE & OPPORTUNITIES
- GERMANY
- GERMANY COMPUTER VISION APPLICATIONS IN MOBILITY MARKET SIZE & OPPORTUNITIES
- FRANCE
- FRANCE COMPUTER VISION APPLICATIONS IN MOBILITY MARKET SIZE & OPPORTUNITIES
- ITALY
- ITALY COMPUTER VISION APPLICATIONS IN MOBILITY MARKET SIZE & OPPORTUNITIES
- SPAIN
- SPAIN COMPUTER VISION APPLICATIONS IN MOBILITY MARKET SIZE & OPPORTUNITIES
- BELGIUM
- BELGIUM COMPUTER VISION APPLICATIONS IN MOBILITY MARKET SIZE & OPPORTUNITIES
- POLAND
- POLAND COMPUTER VISION APPLICATIONS IN MOBILITY MARKET SIZE & OPPORTUNITIES
- REST OF EUROPE
- REST OF EUROPE COMPUTER VISION APPLICATIONS IN MOBILITY MARKET SIZE & OPPORTUNITIES
- UNITED KINGDOM
- ASIA-PACIFIC
- MARKET ESTIMATES & SIZES
- ASIA-PACIFIC COMPUTER VISION APPLICATIONS IN MOBILITY MARKET DRIVERS
- ASIA-PACIFIC COMPUTER VISION APPLICATIONS IN MOBILITY MARKET CHALLENGES
- KEY REGIONAL PLAYERS & ECOSYSTEM
- COUNTRY ANALYSIS
- CHINA
- CHINA COMPUTER VISION APPLICATIONS IN MOBILITY MARKET SIZE & OPPORTUNITIES
- JAPAN
- JAPAN COMPUTER VISION APPLICATIONS IN MOBILITY MARKET SIZE & OPPORTUNITIES
- AUSTRALIA & NEW ZEALAND
- AUSTRALIA & NEW ZEALAND COMPUTER VISION APPLICATIONS IN MOBILITY MARKET SIZE & OPPORTUNITIES
- INDIA
- INDIA COMPUTER VISION APPLICATIONS IN MOBILITY MARKET SIZE & OPPORTUNITIES
- SOUTH KOREA
- SOUTH KOREA COMPUTER VISION APPLICATIONS IN MOBILITY MARKET SIZE & OPPORTUNITIES
- INDONESIA
- INDONESIA COMPUTER VISION APPLICATIONS IN MOBILITY MARKET SIZE & OPPORTUNITIES
- THAILAND
- THAILAND COMPUTER VISION APPLICATIONS IN MOBILITY MARKET SIZE & OPPORTUNITIES
- VIETNAM
- VIETNAM COMPUTER VISION APPLICATIONS IN MOBILITY MARKET SIZE & OPPORTUNITIES
- SINGAPORE
- SINGAPORE COMPUTER VISION APPLICATIONS IN MOBILITY MARKET SIZE & OPPORTUNITIES
- REST OF ASIA-PACIFIC
- REST OF ASIA-PACIFIC COMPUTER VISION APPLICATIONS IN MOBILITY MARKET SIZE & OPPORTUNITIES
- CHINA
- REST OF WORLD
- MARKET ESTIMATES & SIZES
- REST OF WORLD COMPUTER VISION APPLICATIONS IN MOBILITY MARKET DRIVERS
- REST OF WORLD COMPUTER VISION APPLICATIONS IN MOBILITY MARKET CHALLENGES
- KEY REGIONAL PLAYERS & ECOSYSTEM
- REGIONAL ANALYSIS
- LATIN AMERICA
- LATIN AMERICA COMPUTER VISION APPLICATIONS IN MOBILITY MARKET SIZE & OPPORTUNITIES
- MIDDLE EAST & AFRICA
- MIDDLE EAST & AFRICA COMPUTER VISION APPLICATIONS IN MOBILITY MARKET SIZE & OPPORTUNITIES
- LATIN AMERICA
- NORTH AMERICA
COMPETITIVE LANDSCAPE
- KEY STRATEGIC DEVELOPMENTS
- MERGERS & ACQUISITIONS
- PRODUCT LAUNCHES & DEVELOPMENTS
- PARTNERSHIPS & AGREEMENTS
- BUSINESS EXPANSIONS & DIVESTITURES
- COMPETITOR POSITIONING & DIFFERENTIATION MAP
- COMPANY PROFILES
- MOBILEYE
- COMPANY OVERVIEW
- PRODUCT LIST
- STRENGTHS & CHALLENGES
- NVIDIA CORPORATION
- COMPANY OVERVIEW
- PRODUCT LIST
- STRENGTHS & CHALLENGES
- ROBERT BOSCH GMBH
- COMPANY OVERVIEW
- PRODUCT LIST
- STRENGTHS & CHALLENGES
- CONTINENTAL AG
- COMPANY OVERVIEW
- PRODUCT LIST
- STRENGTHS & CHALLENGES
- VALEO SA
- COMPANY OVERVIEW
- PRODUCT LIST
- STRENGTHS & CHALLENGES
- DENSO CORPORATION
- COMPANY OVERVIEW
- PRODUCT LIST
- STRENGTHS & CHALLENGES
- MAGNA INTERNATIONAL INC
- COMPANY OVERVIEW
- PRODUCT LIST
- STRENGTHS & CHALLENGES
- QUALCOMM TECHNOLOGIES INC
- COMPANY OVERVIEW
- PRODUCT LIST
- STRENGTHS & CHALLENGES
- TESLA INC
- COMPANY OVERVIEW
- PRODUCT LIST
- STRENGTHS & CHALLENGES
- NETRADYNE
- COMPANY OVERVIEW
- PRODUCT LIST
- STRENGTHS & CHALLENGES
- MOBILEYE
- KEY STRATEGIC DEVELOPMENTS
LIST OF TABLES
TABLE 1: MARKET SNAPSHOT – COMPUTER VISION APPLICATIONS IN MOBILITY MARKET
TABLE 2: PRICING MODELS, PLATFORM LICENSING FRAMEWORKS & AI SOFTWARE MONETIZATION STRATEGIES
TABLE 3: REGULATORY & POLICY LANDSCAPE ANALYSIS
TABLE 4: MARKET BY COMPONENT, BY REGION, HISTORICAL YEARS, 2022-2024 (IN $ MILLION)
TABLE 5: MARKET BY COMPONENT, BY REGION, FORECAST YEARS, 2026-2034 (IN $ MILLION)
TABLE 6: HARDWARE MARKET, BY REGION, HISTORICAL YEARS, 2022-2024 (IN $ MILLION)
TABLE 7: HARDWARE MARKET, BY REGION, FORECAST YEARS, 2026-2034 (IN $ MILLION)
TABLE 8: VISION PROCESSING & COMPUTE MARKET, BY REGION, HISTORICAL YEARS, 2022-2024 (IN $ MILLION)
TABLE 9: VISION PROCESSING & COMPUTE MARKET, BY REGION, FORECAST YEARS, 2026-2034 (IN $ MILLION)
TABLE 10: SOFTWARE MARKET, BY REGION, HISTORICAL YEARS, 2022-2024 (IN $ MILLION)
TABLE 11: SOFTWARE MARKET, BY REGION, FORECAST YEARS, 2026-2034 (IN $ MILLION)
TABLE 12: SERVICES MARKET, BY REGION, HISTORICAL YEARS, 2022-2024 (IN $ MILLION)
TABLE 13: SERVICES MARKET, BY REGION, FORECAST YEARS, 2026-2034 (IN $ MILLION)
TABLE 14: MARKET BY APPLICATION, BY REGION, HISTORICAL YEARS, 2022-2024 (IN $ MILLION)
TABLE 15: MARKET BY APPLICATION, BY REGION, FORECAST YEARS, 2026-2034 (IN $ MILLION)
TABLE 16: ADVANCED DRIVER ASSISTANCE SYSTEMS (ADAS) MARKET, BY REGION, HISTORICAL YEARS, 2022-2024 (IN $ MILLION)
TABLE 17: ADVANCED DRIVER ASSISTANCE SYSTEMS (ADAS) MARKET, BY REGION, FORECAST YEARS, 2026-2034 (IN $ MILLION)
TABLE 18: AUTONOMOUS DRIVING MARKET, BY REGION, HISTORICAL YEARS, 2022-2024 (IN $ MILLION)
TABLE 19: AUTONOMOUS DRIVING MARKET, BY REGION, FORECAST YEARS, 2026-2034 (IN $ MILLION)
TABLE 20: DRIVER & OCCUPANT MONITORING MARKET, BY REGION, HISTORICAL YEARS, 2022-2024 (IN $ MILLION)
TABLE 21: DRIVER & OCCUPANT MONITORING MARKET, BY REGION, FORECAST YEARS, 2026-2034 (IN $ MILLION)
TABLE 22: SURROUND VIEW & PARKING ASSISTANCE MARKET, BY REGION, HISTORICAL YEARS, 2022-2024 (IN $ MILLION)
TABLE 23: SURROUND VIEW & PARKING ASSISTANCE MARKET, BY REGION, FORECAST YEARS, 2026-2034 (IN $ MILLION)
TABLE 24: OTHER APPLICATIONS MARKET, BY REGION, HISTORICAL YEARS, 2022-2024 (IN $ MILLION)
TABLE 25: OTHER APPLICATIONS MARKET, BY REGION, FORECAST YEARS, 2026-2034 (IN $ MILLION)
TABLE 26: MARKET BY VEHICLE TYPE, BY REGION, HISTORICAL YEARS, 2022-2024 (IN $ MILLION)
TABLE 27: MARKET BY VEHICLE TYPE, BY REGION, FORECAST YEARS, 2026-2034 (IN $ MILLION)
TABLE 28: PASSENGER VEHICLES MARKET, BY REGION, HISTORICAL YEARS, 2022-2024 (IN $ MILLION)
TABLE 29: PASSENGER VEHICLES MARKET, BY REGION, FORECAST YEARS, 2026-2034 (IN $ MILLION)
TABLE 30: LIGHT COMMERCIAL VEHICLES MARKET, BY REGION, HISTORICAL YEARS, 2022-2024 (IN $ MILLION)
TABLE 31: LIGHT COMMERCIAL VEHICLES MARKET, BY REGION, FORECAST YEARS, 2026-2034 (IN $ MILLION)
TABLE 32: HEAVY COMMERCIAL VEHICLES MARKET, BY REGION, HISTORICAL YEARS, 2022-2024 (IN $ MILLION)
TABLE 33: HEAVY COMMERCIAL VEHICLES MARKET, BY REGION, FORECAST YEARS, 2026-2034 (IN $ MILLION)
TABLE 34: MARKET BY GEOGRAPHICAL ANALYSIS, HISTORICAL YEARS, 2022-2024 (IN $ MILLION)
TABLE 35: MARKET BY GEOGRAPHICAL ANALYSIS, FORECAST YEARS, 2026-2034 (IN $ MILLION)
TABLE 36: NORTH AMERICA MARKET, COUNTRY ANALYSIS, HISTORICAL YEARS, 2022-2024 (IN $ MILLION)
TABLE 37: NORTH AMERICA MARKET, COUNTRY ANALYSIS, FORECAST YEARS, 2026-2034 (IN $ MILLION)
TABLE 38: KEY PLAYERS OPERATING IN THE NORTH AMERICAN MARKET
TABLE 39: EUROPE MARKET, COUNTRY ANALYSIS, HISTORICAL YEARS, 2022-2024 (IN $ MILLION)
TABLE 40: EUROPE MARKET, COUNTRY ANALYSIS, FORECAST YEARS, 2026-2034 (IN $ MILLION)
TABLE 41: KEY PLAYERS OPERATING IN THE EUROPEAN MARKET
TABLE 42: ASIA-PACIFIC MARKET, COUNTRY ANALYSIS, HISTORICAL YEARS, 2022-2024 (IN $ MILLION)
TABLE 43: ASIA-PACIFIC MARKET, COUNTRY ANALYSIS, FORECAST YEARS, 2026-2034 (IN $ MILLION)
TABLE 44: KEY PLAYERS OPERATING IN THE ASIA-PACIFIC MARKET
TABLE 45: REST OF WORLD MARKET, REGIONAL ANALYSIS, HISTORICAL YEARS, 2022-2024 (IN $ MILLION)
TABLE 46: REST OF WORLD MARKET, REGIONAL ANALYSIS, FORECAST YEARS, 2026-2034 (IN $ MILLION)
TABLE 47: KEY PLAYERS OPERATING IN THE REST OF WORLD MARKET
TABLE 48: LIST OF MERGERS & ACQUISITIONS
TABLE 49: LIST OF PRODUCT LAUNCHES & DEVELOPMENTS
TABLE 50: LIST OF PARTNERSHIPS & AGREEMENTS
TABLE 51: LIST OF BUSINESS EXPANSIONS & DIVESTITURES
LIST OF FIGURES
FIGURE 1: MAJOR MARKET FINDINGS
FIGURE 2: MARKET DYNAMICS
FIGURE 3: KEY MARKET TRENDS
FIGURE 4: PORTER’S FIVE FORCES ANALYSIS
FIGURE 5: GROWTH PROSPECT MAPPING FOR NORTH AMERICA
FIGURE 6: GROWTH PROSPECT MAPPING FOR EUROPE
FIGURE 7: GROWTH PROSPECT MAPPING FOR ASIA-PACIFIC
FIGURE 8: GROWTH PROSPECT MAPPING FOR REST OF WORLD
FIGURE 9: MARKET MATURITY ANALYSIS
FIGURE 10: MARKET CONCENTRATION ANALYSIS
FIGURE 11: VALUE CHAIN ANALYSIS
FIGURE 12: KEY BUYING CRITERIA
FIGURE 13: SEGMENT GROWTH POTENTIAL, BY COMPONENT, IN 2025
FIGURE 14: HARDWARE MARKET SIZE, 2026-2034 (IN $ MILLION)
FIGURE 15: VISION PROCESSING & COMPUTE MARKET SIZE, 2026-2034 (IN $ MILLION)
FIGURE 16: SOFTWARE MARKET SIZE, 2026-2034 (IN $ MILLION)
FIGURE 17: SERVICES MARKET SIZE, 2026-2034 (IN $ MILLION)
FIGURE 18: SEGMENT GROWTH POTENTIAL, BY APPLICATION, IN 2025
FIGURE 19: ADVANCED DRIVER ASSISTANCE SYSTEMS (ADAS) MARKET SIZE, 2026-2034 (IN $ MILLION)
FIGURE 20: AUTONOMOUS DRIVING MARKET SIZE, 2026-2034 (IN $ MILLION)
FIGURE 21: DRIVER & OCCUPANT MONITORING MARKET SIZE, 2026-2034 (IN $ MILLION)
FIGURE 22: SURROUND VIEW & PARKING ASSISTANCE MARKET SIZE, 2026-2034 (IN $ MILLION)
FIGURE 23: OTHER APPLICATIONS MARKET SIZE, 2026-2034 (IN $ MILLION)
FIGURE 24: SEGMENT GROWTH POTENTIAL, BY VEHICLE TYPE, IN 2025
FIGURE 25: PASSENGER VEHICLES MARKET SIZE, 2026-2034 (IN $ MILLION)
FIGURE 26: LIGHT COMMERCIAL VEHICLES MARKET SIZE, 2026-2034 (IN $ MILLION)
FIGURE 27: HEAVY COMMERCIAL VEHICLES MARKET SIZE, 2026-2034 (IN $ MILLION)
FIGURE 28: NORTH AMERICA COMPUTER VISION APPLICATIONS IN MOBILITY MARKET, COUNTRY OUTLOOK, 2025 & 2034 (IN %)
FIGURE 29: UNITED STATES MARKET SIZE, 2026-2034 (IN $ MILLION)
FIGURE 30: CANADA MARKET SIZE, 2026-2034 (IN $ MILLION)
FIGURE 31: EUROPE COMPUTER VISION APPLICATIONS IN MOBILITY MARKET, COUNTRY OUTLOOK, 2025 & 2034 (IN %)
FIGURE 32: GERMANY MARKET SIZE, 2026-2034 (IN $ MILLION)
FIGURE 33: UNITED KINGDOM MARKET SIZE, 2026-2034 (IN $ MILLION)
FIGURE 34: FRANCE MARKET SIZE, 2026-2034 (IN $ MILLION)
FIGURE 35: ITALY MARKET SIZE, 2026-2034 (IN $ MILLION)
FIGURE 36: SPAIN MARKET SIZE, 2026-2034 (IN $ MILLION)
FIGURE 37: BELGIUM MARKET SIZE, 2026-2034 (IN $ MILLION)
FIGURE 38: POLAND MARKET SIZE, 2026-2034 (IN $ MILLION)
FIGURE 39: REST OF EUROPE MARKET SIZE, 2026-2034 (IN $ MILLION)
FIGURE 40: ASIA-PACIFIC COMPUTER VISION APPLICATIONS IN MOBILITY MARKET, COUNTRY OUTLOOK, 2025 & 2034 (IN %)
FIGURE 41: CHINA MARKET SIZE, 2026-2034 (IN $ MILLION)
FIGURE 42: INDIA MARKET SIZE, 2026-2034 (IN $ MILLION)
FIGURE 43: JAPAN MARKET SIZE, 2026-2034 (IN $ MILLION)
FIGURE 44: AUSTRALIA & NEW ZEALAND MARKET SIZE, 2026-2034 (IN $ MILLION)
FIGURE 45: SOUTH KOREA MARKET SIZE, 2026-2034 (IN $ MILLION)
FIGURE 46: THAILAND MARKET SIZE, 2026-2034 (IN $ MILLION)
FIGURE 47: INDONESIA MARKET SIZE, 2026-2034 (IN $ MILLION)
FIGURE 48: VIETNAM MARKET SIZE, 2026-2034 (IN $ MILLION)
FIGURE 49: SINGAPORE MARKET SIZE, 2026-2034 (IN $ MILLION)
FIGURE 50: REST OF ASIA-PACIFIC MARKET SIZE, 2026-2034 (IN $ MILLION)
FIGURE 51: REST OF WORLD COMPUTER VISION APPLICATIONS IN MOBILITY MARKET, REGIONAL OUTLOOK, 2025 & 2034 (IN %)
FIGURE 52: LATIN AMERICA MARKET SIZE, 2026-2034 (IN $ MILLION)
FIGURE 53: MIDDLE EAST & AFRICA MARKET SIZE, 2026-2034 (IN $ MILLION)
FAQ’s
FAQs
The global computer vision applications in mobility market is valued at $41.44 billion in 2026 and is projected to reach $118.75 billion by 2034, growing at a CAGR of 14.07%. This growth is primarily driven by rising ADAS adoption, autonomous vehicle development, and expanding smart city transportation infrastructure.
The key applications include advanced driver assistance systems (ADAS), autonomous driving, driver and occupant monitoring, surround view and parking assistance, and smart traffic management. These computer vision mobility solutions are deployed across passenger vehicles, commercial fleets, and urban transportation infrastructure to improve safety and operational efficiency.
AI and deep learning algorithms enable real-time object detection, semantic segmentation, and predictive analytics in automotive computer vision systems, significantly improving accuracy and response times. The integration of AI-powered computer vision is accelerating autonomous vehicle capabilities and enabling OEMs to meet increasingly stringent global road safety regulations.
Asia-Pacific is the fastest-growing region, with a CAGR of 15.04% through 2034, driven by China’s intelligent connected vehicle programs and Japan’s advanced ADAS integration. North America and Europe also hold significant shares, supported by regulatory mandates for safety technology and substantial investments in autonomous mobility platforms.
The primary challenges include high development and integration costs, technical limitations in adverse weather conditions, data privacy concerns related to camera-based surveillance, and the complexity of integrating computer vision software with multi-sensor vehicle architectures.
Key players in the intelligent mobility computer vision market include Mobileye, NVIDIA Corporation, Robert Bosch GmbH, Continental AG, Valeo SA, DENSO Corporation, Magna International, Qualcomm Technologies, Tesla, and Netradyne.
RELATED REPORTS
-

LATIN AMERICA FACIAL RECOGNITION MARKET FORECAST 2019-2028
-

UNITED STATES AI-DRIVEN CLOUD MIGRATION SERVICES MARKET FORECAST 2026-2034
-
UNITED KINGDOM AI-DRIVEN CLOUD MIGRATION SERVICES MARKET FORECAST 2026-2034
-
UNITED ARAB EMIRATES AI-DRIVEN CLOUD MIGRATION SERVICES MARKET FORECAST 2026-2034
-
SOUTH KOREA AI-DRIVEN CLOUD MIGRATION SERVICES MARKET FORECAST 2026-2034
-

SINGAPORE AI-DRIVEN CLOUD MIGRATION SERVICES MARKET FORECAST 2026-2034
-
SAUDI ARABIA AI-DRIVEN CLOUD MIGRATION SERVICES MARKET FORECAST 2026-2034
-

AUSTRALIA AI-DRIVEN CLOUD MIGRATION SERVICES MARKET FORECAST 2026-2034
-

JAPAN AI-DRIVEN CLOUD MIGRATION SERVICES MARKET FORECAST 2026-2034
-

INDIA AI-DRIVEN CLOUD MIGRATION SERVICES MARKET FORECAST 2026-2034