
GERMANY SOLAR PANEL RECYCLING MARKET FORECAST 2026-2034
SCOPE OF THE REPORT
Germany Solar Panel Recycling Market by Process (Thermal, Mechanical, Chemical, Laser) Market by Type (Silicon-Based C-Si, Thin-Film, Other Types) Market by Shelf Life (Early Loss, Normal Loss) Market by Material/Recoverable Components (Glass, Aluminum, Copper, Plastic, Silver, PV Silicon, Other Materials/Recoverable Components), by Geography
REPORTS » ENERGY, POWER & UTILITIES » GERMANY SOLAR PANEL RECYCLING MARKET FORECAST 2026-2034
GERMANY SOLAR PANEL RECYCLING MARKET OVERVIEW
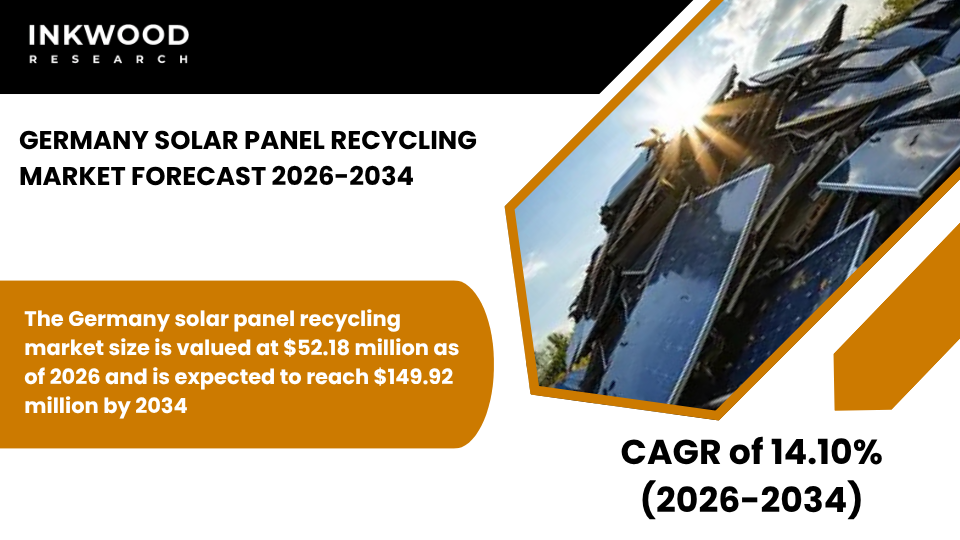
The Germany solar panel recycling market size is valued at $52.18 million as of 2026 and is expected to reach $149.92 million by 2034, progressing with a CAGR of 14.10% during the forecast years, 2026-2034.
Germany’s solar panel recycling market stands as one of Europe’s most mature and sophisticated sectors, built upon decades of environmental policy leadership and comprehensive renewable energy infrastructure development that began in the early 2000s. The country’s aggressive solar adoption through feed-in tariffs and subsidies created massive photovoltaic capacity installations, which are now systematically approaching their operational shelf life and generating substantial recycling volumes.
Stringent environmental regulations under both EU and national frameworks mandate proper disposal and material recovery from decommissioned panels, eliminating landfilling options and creating robust compliance drivers throughout the value chain. Furthermore, Germany’s well-established collection infrastructure, coordinated through producer responsibility organizations and certified waste management networks, ensures efficient panel retrieval from residential, commercial, and utility-scale installations nationwide.
Technological advancements in mechanical thermal laser recycling processes have positioned German facilities at the forefront of material recovery innovation, achieving exceptional rates for silicon, silver, and aluminum extraction. Additionally, strong environmental awareness among utilities, manufacturers, and end-users supports widespread recycling adoption while driving continuous improvements in processing efficiency and resource recovery.
The demand for efficient recycling methods continues to intensify as first-generation solar installations require systematic decommissioning, creating predictable material streams that enable long-term infrastructure investments. According to Germany’s Federal Environment Agency (Umweltbundesamt), the country has established comprehensive guidelines for photovoltaic waste management, requiring detailed tracking of panel lifecycles from installation through final material recovery.
These regulatory frameworks create transparency throughout the waste management chain while ensuring compliance with EU WEEE Directive requirements that mandate producer responsibility for end-of-life product management. Consequently, German solar manufacturers and importers must participate in authorized collection and recycling systems, guaranteeing funding for proper disposal regardless of panel origin or age.
This regulatory certainty has attracted significant private sector investments in specialized recycling facilities equipped with state-of-the-art processing technologies capable of handling diverse panel types efficiently. The market structure reflects Germany’s organized approach to waste management, with producer responsibility organizations coordinating collection logistics while specialized recyclers focus on processing and material recovery operations.
To Know More About This Report, Request a Free Sample Copy
As a result, this division of responsibilities creates operational efficiencies by leveraging each participant’s core competencies throughout the value chain. Moreover, Germany’s robust manufacturing sector generates strong domestic demand for recovered materials, particularly high-purity silicon and precious metals that command premium prices in semiconductor and electronics production.
Recovery of glass and aluminum accounts for the majority of recycling volumes by weight, though silicon and silver represent higher-value components driving facility profitability. However, challenges persist regarding economic viability for certain recovered materials where processing costs exceed market values, requiring continuous technological innovation to improve separation efficiency and reduce operational expenses.
Labor and operational costs in Germany remain substantially higher compared to other European markets, creating pressure on recycling facilities to maximize automation and process optimization. Nevertheless, German engineering expertise enables the development of advanced dismantling technologies that reduce manual labor requirements while improving safety standards throughout operations.
Strategic partnerships between panel manufacturers and recycling companies are becoming increasingly common, establishing closed-loop systems where manufacturers design panels with recyclability considerations while securing guaranteed material streams for reprocessing. Rising investment in automated dismantling technologies reflects industry recognition that labor cost management represents a critical competitive factor for long-term sustainability.
Furthermore, integration of solar panel recycling into broader circular economy policies creates synergies with other waste management streams, enabling shared infrastructure utilization and cross-sector knowledge transfer that enhances overall system efficiency. Germany’s focus on closed-loop recycling for high-value materials like silicon and silver demonstrates the market’s evolution toward maximizing resource efficiency and economic returns from material recovery operations.
Advanced purification techniques enable recovered silicon to meet semiconductor-grade specifications, creating premium product categories that justify additional processing investments. Similarly, silver extraction from photovoltaic cells generates significant revenue given the material’s industrial value and relatively high concentration in modern panel designs.
Complex compliance requirements create barriers for smaller recyclers lacking resources to navigate regulatory frameworks and maintain required certifications, leading to market consolidation around larger, well-capitalized operators with established compliance infrastructure. Logistics costs remain elevated despite Germany’s excellent transportation networks, as decommissioned panels require specialized handling and storage throughout the collection process.
SEGMENTATION ANALYSIS
The Germany solar panel recycling market is segmented into process, type, shelf life, and material/recoverable components. The material/recoverable components segment is further categorized into glass, aluminum, copper, plastic, silver, PV silicon, and other materials/recoverable components.
Glass dominates the material recovery segment in Germany, representing approximately 70-75% of total panel weight and constituting the largest volume stream processed through recycling facilities nationwide. This material proves relatively straightforward to recover through mechanical crushing and separation techniques, making it economically attractive despite a lower per-unit value compared to metals or semiconductors.
The recovered glass typically meets quality standards for construction applications, container manufacturing, and other industrial uses where recycled content provides both environmental benefits and cost advantages. Consequently, German recyclers have optimized processing lines specifically for glass extraction, employing multi-stage separation that removes contaminants while preserving material quality for downstream applications.
Furthermore, strong demand from domestic glass manufacturers creates reliable markets for recovered material, ensuring consistent revenue streams that support facility operations and justify ongoing infrastructure investments. Environmental advantages include substantial energy savings compared to virgin glass production, aligning perfectly with Germany’s climate goals and circular economy objectives that prioritize resource conservation across all industrial sectors.
Material recovery rates for glass consistently exceed 90% in modern facilities, demonstrating technological maturity and operational excellence throughout Germany’s recycling infrastructure. This segment supports overall market expansion by providing the volume and revenue stability necessary for sustainable business models, while simultaneously addressing environmental mandates for comprehensive material recovery from photovoltaic waste streams.
COMPETITIVE INSIGHTS
Some of the top players operating in the Germany solar panel recycling market include Aurubis AG, Reiling Group, Rinovasol Group, SIC Processing GmbH, etc.
Reiling Group operates as a leading European recycling specialist, focusing on comprehensive waste management solutions for diverse industrial and electronic materials, including photovoltaic panels. The company employs advanced mechanical processing technologies that efficiently separate glass, aluminum, copper, and silicon from decommissioned solar panels through multi-stage crushing, screening, and density separation systems.
Reiling Group’s integrated operations encompass collection logistics, processing infrastructure, and material sales, providing end-to-end recycling services for manufacturers, utilities, and waste management organizations throughout Germany and neighboring markets. The company maintains multiple processing facilities strategically located near major solar installation concentrations, minimizing transportation costs while ensuring rapid response capabilities for large-scale decommissioning projects.
Additionally, Reiling Group emphasizes environmental compliance and material quality, achieving certifications that demonstrate adherence to stringent German and EU regulations governing hazardous waste handling and resource recovery standards. This comprehensive approach positions the company as a trusted partner for solar industry stakeholders seeking reliable, compliant recycling solutions that maximize material recovery while minimizing environmental impact throughout the photovoltaic waste management value chain.
REPORT SYNOPSIS
| REPORT SCOPE | DETAILS |
|---|---|
| Market Forecast Years | 2026-2034 |
| Base Year | 2025 |
| Market Historical Years | 2022-2024 |
| Forecast Units | Revenue ($ Million) |
| Segments Analyzed | Process, Type, Shelf Life, and Material / Recoverable Components |
| Country Analyzed | Germany |
| Companies Analyzed | Aurubis AG, First Solar Inc, Reiling Group, Rinovasol Group, SiC Processing GmbH |
TABLE OF CONTENTS
RESEARCH SCOPE & METHODOLOGY
- STUDY OBJECTIVES
- METHODOLOGY
- ASSUMPTIONS & LIMITATIONS
EXECUTIVE SUMMARY
- MARKET SIZE & FORECAST
- MARKET OVERVIEW
- SCOPE OF STUDY
- CRISIS SCENARIO ANALYSIS
- MAJOR MARKET FINDINGS
- GERMANY IS ONE OF THE MOST MATURE SOLAR PANEL RECYCLING MARKETS, DRIVEN BY EARLY SOLAR ADOPTION AND STRICT WASTE DIRECTIVES
- THE COUNTRY HAS A WELL-ESTABLISHED COLLECTION AND COMPLIANCE FRAMEWORK UNDER EU WEEE REGULATIONS
- RECOVERY OF GLASS AND ALUMINUM ACCOUNTS FOR A MAJOR SHARE OF RECYCLING VOLUMES
- PRIVATE RECYCLERS AND PRODUCER RESPONSIBILITY ORGANIZATIONS DOMINATE THE MARKET STRUCTURE
MARKET DYNAMICS
- KEY DRIVERS
- STRINGENT EU AND NATIONAL REGULATIONS MANDATE RECYCLING OF END-OF-LIFE SOLAR PANELS
- A LARGE INSTALLED BASE OF AGING SOLAR PANELS IS ENTERING THE DECOMMISSIONING PHASE
- STRONG ENVIRONMENTAL AWARENESS AMONG UTILITIES AND MANUFACTURERS SUPPORTS RECYCLING ADOPTION
- TECHNOLOGICAL INNOVATION IN MECHANICAL AND THERMAL RECYCLING IMPROVES MATERIAL RECOVERY RATES
- KEY RESTRAINTS
- HIGH LABOR AND OPERATIONAL COSTS INCREASE OVERALL RECYCLING EXPENSES
- LIMITED ECONOMIC VALUE FROM CERTAIN RECOVERED MATERIALS AFFECTS PROFITABILITY
- COMPLEX COMPLIANCE REQUIREMENTS CREATE BARRIERS FOR SMALL RECYCLERS
- LOGISTICS COSTS REMAIN HIGH FOR TRANSPORTING DECOMMISSIONED PANELS
- KEY DRIVERS
KEY ANALYTICS
- KEY MARKET TRENDS
- INCREASING FOCUS ON CLOSED-LOOP RECYCLING FOR SILICON AND SILVER
- STRATEGIC PARTNERSHIPS BETWEEN PANEL MANUFACTURERS AND RECYCLING COMPANIES
- RISING INVESTMENT IN AUTOMATED DISMANTLING TECHNOLOGIES
- INTEGRATION OF SOLAR PANEL RECYCLING INTO BROADER CIRCULAR ECONOMY POLICIES
- PORTER’S FIVE FORCES ANALYSIS
- BUYERS POWER
- SUPPLIERS POWER
- SUBSTITUTION
- NEW ENTRANTS
- INDUSTRY RIVALRY
- GROWTH PROSPECT MAPPING
- GROWTH PROSPECT MAPPING FOR GERMANY
- MARKET MATURITY ANALYSIS
- MARKET CONCENTRATION ANALYSIS
- VALUE CHAIN ANALYSIS
- RAW MATERIAL SUPPLY
- COLLECTION AND LOGISTICS
- DISMANTLING AND SHREDDING
- MATERIAL SORTING
- CHEMICAL PROCESSING
- RECOVERED MATERIAL SUPPLY
- KEY BUYING CRITERIA
- RECYCLING EFFICIENCY
- COST COMPETITIVENESS
- ENVIRONMENTAL COMPLIANCE
- TECHNOLOGICAL ADVANCEMENT
- REGULATORY FRAMEWORK
- KEY MARKET TRENDS
SOLAR PANEL RECYCLING MARKET BY PROCESS
- THERMAL
- MARKET FORECAST FIGURE
- SEGMENT ANALYSIS
- MECHANICAL
- MARKET FORECAST FIGURE
- SEGMENT ANALYSIS
- CHEMICAL
- MARKET FORECAST FIGURE
- SEGMENT ANALYSIS
- LASER
- MARKET FORECAST FIGURE
- SEGMENT ANALYSIS
- THERMAL
SOLAR PANEL RECYCLING MARKET BY TYPE
- SILICON-BASED (C-SI)
- MARKET FORECAST FIGURE
- SEGMENT ANALYSIS
- THIN-FILM
- MARKET FORECAST FIGURE
- SEGMENT ANALYSIS
- OTHER TYPES
- MARKET FORECAST FIGURE
- SEGMENT ANALYSIS
- SILICON-BASED (C-SI)
SOLAR PANEL RECYCLING MARKET BY SHELF LIFE
- EARLY LOSS
- MARKET FORECAST FIGURE
- SEGMENT ANALYSIS
- NORMAL LOSS
- MARKET FORECAST FIGURE
- SEGMENT ANALYSIS
- EARLY LOSS
SOLAR PANEL RECYCLING MARKET BY MATERIAL / RECOVERABLE COMPONENTS
- GLASS
- MARKET FORECAST FIGURE
- SEGMENT ANALYSIS
- ALUMINUM
- MARKET FORECAST FIGURE
- SEGMENT ANALYSIS
- COPPER
- MARKET FORECAST FIGURE
- SEGMENT ANALYSIS
- PLASTIC
- MARKET FORECAST FIGURE
- SEGMENT ANALYSIS
- SILVER
- MARKET FORECAST FIGURE
- SEGMENT ANALYSIS
- PV SILICON
- MARKET FORECAST FIGURE
- SEGMENT ANALYSIS
- OTHER MATERIALS / RECOVERABLE COMPONENTS
- MARKET FORECAST FIGURE
- SEGMENT ANALYSIS
- GLASS
COMPETITIVE LANDSCAPE
- KEY STRATEGIC DEVELOPMENTS
- MERGERS & ACQUISITIONS
- PRODUCT LAUNCHES & DEVELOPMENTS
- PARTNERSHIPS & AGREEMENTS
- BUSINESS EXPANSIONS & DIVESTITURES
- COMPANY PROFILES
- AURUBIS AG
- COMPANY OVERVIEW
- PRODUCTS / SERVICES LIST
- STRENGTHS & CHALLENGES
- FIRST SOLAR INC
- COMPANY OVERVIEW
- PRODUCTS / SERVICES LIST
- STRENGTHS & CHALLENGES
- REILING GROUP
- COMPANY OVERVIEW
- PRODUCTS / SERVICES LIST
- STRENGTHS & CHALLENGES
- RINOVASOL GROUP
- COMPANY OVERVIEW
- PRODUCTS / SERVICES LIST
- STRENGTHS & CHALLENGES
- SIC PROCESSING GMBH
- COMPANY OVERVIEW
- PRODUCTS / SERVICES LIST
- STRENGTHS & CHALLENGES
- AURUBIS AG
- KEY STRATEGIC DEVELOPMENTS
LIST OF TABLES
TABLE 1: MARKET SNAPSHOT – SOLAR PANEL RECYCLING
TABLE 2: SOLAR PANEL RECYCLING MARKET REGULATORY FRAMEWORK
TABLE 3: MARKET BY PROCESS, HISTORICAL YEARS, 2022-2024 (IN $ MILLION)
TABLE 4: MARKET BY PROCESS, FORECAST YEARS, 2026-2034 (IN $ MILLION)
TABLE 5: MARKET BY TYPE, HISTORICAL YEARS, 2022-2024 (IN $ MILLION)
TABLE 6: MARKET BY TYPE, FORECAST YEARS, 2026-2034 (IN $ MILLION)
TABLE 7: MARKET BY SHELF LIFE, HISTORICAL YEARS, 2022-2024 (IN $ MILLION)
TABLE 8: MARKET BY SHELF LIFE, FORECAST YEARS, 2026-2034 (IN $ MILLION)
TABLE 9: MARKET BY MATERIAL / RECOVERABLE COMPONENTS, HISTORICAL YEARS, 2022-2024 (IN $ MILLION)
TABLE 10: MARKET BY MATERIAL / RECOVERABLE COMPONENTS, FORECAST YEARS, 2026-2034 (IN $ MILLION)
TABLE 11: KEY PLAYERS OPERATING IN THE GERMAN MARKET
TABLE 12: LIST OF MERGERS & ACQUISITIONS
TABLE 13: LIST OF PRODUCT LAUNCHES & DEVELOPMENTS
TABLE 14: LIST OF PARTNERSHIPS & AGREEMENTS
TABLE 15: LIST OF BUSINESS EXPANSIONS & DIVESTITURES
LIST OF FIGURES
FIGURE 1: KEY MARKET TRENDS
FIGURE 2: PORTER’S FIVE FORCES ANALYSIS
FIGURE 3: GROWTH PROSPECT MAPPING FOR GERMANY
FIGURE 4: MARKET MATURITY ANALYSIS
FIGURE 5: MARKET CONCENTRATION ANALYSIS
FIGURE 6: VALUE CHAIN ANALYSIS
FIGURE 7: KEY BUYING CRITERIA
FIGURE 8: SEGMENT GROWTH POTENTIAL, BY PROCESS, IN 2025
FIGURE 9: THERMAL MARKET SIZE, 2026-2034 (IN $ MILLION)
FIGURE 10: MECHANICAL MARKET SIZE, 2026-2034 (IN $ MILLION)
FIGURE 11: CHEMICAL MARKET SIZE, 2026-2034 (IN $ MILLION)
FIGURE 12: LASER MARKET SIZE, 2026-2034 (IN $ MILLION)
FIGURE 13: SEGMENT GROWTH POTENTIAL, BY TYPE, IN 2025
FIGURE 14: SILICON-BASED (C-SI) MARKET SIZE, 2026-2034 (IN $ MILLION)
FIGURE 15: THIN-FILM MARKET SIZE, 2026-2034 (IN $ MILLION)
FIGURE 16: OTHER TYPES MARKET SIZE, 2026-2034 (IN $ MILLION)
FIGURE 17: SEGMENT GROWTH POTENTIAL, BY SHELF LIFE, IN 2025
FIGURE 18: EARLY LOSS MARKET SIZE, 2026-2034 (IN $ MILLION)
FIGURE 19: NORMAL LOSS MARKET SIZE, 2026-2034 (IN $ MILLION)
FIGURE 20: SEGMENT GROWTH POTENTIAL, BY MATERIAL / RECOVERABLE COMPONENTS, IN 2025
FIGURE 21: GLASS MARKET SIZE, 2026-2034 (IN $ MILLION)
FIGURE 22: ALUMINUM MARKET SIZE, 2026-2034 (IN $ MILLION)
FIGURE 23: COPPER MARKET SIZE, 2026-2034 (IN $ MILLION)
FIGURE 24: PLASTIC MARKET SIZE, 2026-2034 (IN $ MILLION)
FIGURE 25: SILVER MARKET SIZE, 2026-2034 (IN $ MILLION)
FIGURE 26: PV SILICON MARKET SIZE, 2026-2034 (IN $ MILLION)
FIGURE 27: OTHER MATERIALS / RECOVERABLE COMPONENTS MARKET SIZE, 2026-2034 (IN $ MILLION)
FAQ’s
RELATED REPORTS
-

UNITED STATES AI-DRIVEN CLOUD MIGRATION SERVICES MARKET FORECAST 2026-2034
-

UNITED KINGDOM AI-DRIVEN CLOUD MIGRATION SERVICES MARKET FORECAST 2026-2034
-

UNITED ARAB EMIRATES AI-DRIVEN CLOUD MIGRATION SERVICES MARKET FORECAST 2026-2034
-

SOUTH KOREA AI-DRIVEN CLOUD MIGRATION SERVICES MARKET FORECAST 2026-2034
-

SINGAPORE AI-DRIVEN CLOUD MIGRATION SERVICES MARKET FORECAST 2026-2034
-

SAUDI ARABIA AI-DRIVEN CLOUD MIGRATION SERVICES MARKET FORECAST 2026-2034
-

AUSTRALIA AI-DRIVEN CLOUD MIGRATION SERVICES MARKET FORECAST 2026-2034
-

JAPAN AI-DRIVEN CLOUD MIGRATION SERVICES MARKET FORECAST 2026-2034
-

INDIA AI-DRIVEN CLOUD MIGRATION SERVICES MARKET FORECAST 2026-2034
-

CHINA AI-DRIVEN CLOUD MIGRATION SERVICES MARKET FORECAST 2026-2034