Europe Magnetic Resonance Imaging (MRI) Systems Market by Architecture (Closed MRI Systems, Open MRI Systems) Market by Field Type (High Field System, Low-Mid Field Systems, Ultra High Field Systems) Market by Application (Brain and Neurology MRI System, Spine and Musculoskeletal MRI System, Pelvic and Abdominal MRI System, Oncology MRI System, Vascular MRI System, Cardiology MRI System, Pediatric MRI System, Gastroenterology MRI System, Other Applications), and Geography
EUROPE MAGNETIC RESONANCE IMAGING (MRI) SYSTEMS MARKET OVERVIEW
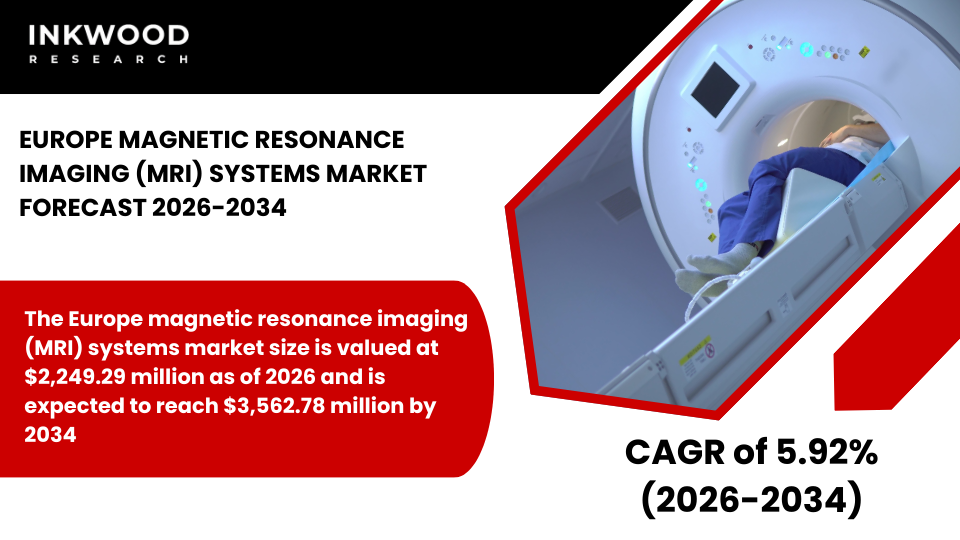
The Europe magnetic resonance imaging (MRI) systems market size is valued at $2,249.29 million as of 2026 and is expected to reach $3,562.78 million by 2034, progressing with a CAGR of 5.92% during the forecast years, 2026-2034.
Harmonized regulatory frameworks combined with universal healthcare coverage drive sustained MRI systems market expansion across European nations. The European Union Medical Device Regulation (MDR), implemented in May 2021, established stringent safety and efficacy standards for magnetic resonance imaging equipment.
This comprehensive regulatory overhaul ensures patient protection while supporting technological innovation across member states. Moreover, aging populations throughout Europe accelerate demand for neurological and oncological diagnostic imaging services. Healthcare systems increasingly prioritize value-based procurement strategies that emphasize total cost of ownership and clinical outcomes.
Additionally, cross-border healthcare agreements facilitate patient mobility between countries, creating standardized imaging requirements across the region. Consequently, manufacturers align product portfolios with EU-wide regulatory expectations rather than navigating fragmented national requirements.
To Know More About This Report, Request a Free Sample Copy
The Europe magnetic resonance imaging (MRI) systems market growth assessment includes the analysis of the United Kingdom, Germany, France, Italy, Spain, Belgium, Poland, and Rest of Europe.
The United Kingdom maintains a significant presence within the European MRI systems market despite post-Brexit regulatory adjustments. National Health Service procurement processes emphasize cost-effectiveness alongside clinical performance when selecting imaging equipment. Healthcare facilities face persistent imaging capacity constraints that create extended waiting times for non-urgent MRI examinations.
Nevertheless, private diagnostic imaging centers proliferate rapidly, offering timely access to patients willing to pay out-of-pocket or through private insurance. Furthermore, the UK government’s commitment to healthcare modernization drives capital investments in advanced imaging technologies. Academic medical centers and research institutions champion ultra-high-field MRI systems for groundbreaking neuroscience investigations.
Additionally, artificial intelligence integration becomes increasingly prevalent across UK radiology departments seeking efficiency gains. Remote radiologist interpretation networks connect district hospitals with specialist readers based in urban centers effectively.
Germany represents Europe’s largest healthcare economy and commands a substantial magnetic resonance imaging systems market share regionally. According to industry sources, Germany reported over 2.0 MRI units per 100,000 inhabitants in 2018, reflecting exceptional equipment density. Subsequently, the country performed approximately 13 million MRI scan examinations in 2022, demonstrating robust utilization rates.
The high volume of scans reflects significant patient demand, supported by a strong local market with major players like Siemens Healthineers and Philips. German healthcare infrastructure also combines statutory health insurance with competitive hospital markets that encourage technology adoption. Moreover, federal funding programs support diagnostic equipment modernization across rural regions historically underserved by advanced imaging.
Teaching hospitals and university medical centers drive demand for high-field and ultra-high-field systems supporting clinical research. Additionally, Germany’s medical technology manufacturing expertise positions domestic companies as innovation leaders. Cross-border patient flows from neighboring Austria and Denmark supplement domestic demand, smoothing utilization patterns throughout the year.
France demonstrates robust growth potential within the European magnetic resonance imaging systems market, supported by comprehensive national healthcare coverage and extensive hospital networks. The country’s centralized healthcare planning, coordinated through regional health agencies, ensures equitable MRI equipment distribution across urban and metropolitan areas.
Moreover, France maintains strong public-private partnerships, facilitating diagnostic imaging infrastructure investments throughout the nation. Academic medical centers in Paris, Lyon, and Marseille drive demand for cutting-edge 3T and ultra-high-field systems supporting oncology and neurology research programs. Additionally, France’s aging population, coupled with rising cancer screening initiatives, accelerates procedure volumes substantially.
The government emphasizes value-based procurement strategies, prioritizing total cost of ownership over initial acquisition prices. Furthermore, French healthcare providers are increasingly adopting AI-powered workflow optimization tools addressing radiologist workforce shortages. Consequently, France represents a strategically important market for MRI manufacturers seeking European expansion opportunities.
The Europe magnetic resonance imaging (MRI) systems market is segmented into architecture, field type, and application. The field type segment is further categorized into high field systems, low-mid field systems, and ultra high field systems.
High field MRI systems play a key role in the European market landscape through their optimal balance of clinical versatility and operational economics. These systems operating at 1.5 Tesla and 3 Tesla field strengths deliver diagnostic quality suitable for comprehensive clinical applications. European healthcare providers value high-field systems for their reliability, established clinical protocols, and broad reimbursement coverage.
Moreover, radiologists across the continent possess extensive training and experience interpreting images from high-field platforms. The 1.5T segment maintains the largest installed base due to favorable acquisition costs and manageable infrastructure requirements. However, 3T systems gain market share progressively as clinical evidence demonstrates superior diagnostic capabilities for neurological and musculoskeletal examinations.
Furthermore, high field systems accommodate advanced sequences including diffusion-weighted imaging, perfusion studies, and spectroscopy protocols. European medical societies publish clinical guidelines increasingly recommending high-field imaging for specific indications. Additionally, research institutions utilize high-field platforms for translational studies, bridging basic science and clinical practice. Consequently, high-field MRI systems represent strategic investments for healthcare facilities seeking long-term diagnostic capabilities.
Some of the top players operating in the Europe magnetic resonance imaging (MRI) systems market include Siemens Healthineers, Philips Healthcare, Canon Medical Systems Corp, Esaote SpA, etc.
Esaote SpA operates as a prominent Italian medical diagnostic imaging manufacturer headquartered in Genoa, specializing in dedicated and compact MRI systems. The company focuses on producing cost-effective magnetic resonance imaging solutions optimized for musculoskeletal, orthopedic, and extremity applications. Esaote’s dedicated MRI platforms feature open architectures that enhance patient comfort while maintaining diagnostic image quality.
The company’s product portfolio includes the G-scan Brio, an innovative weight-bearing MRI system enabling imaging in various positions. Moreover, Esaote maintains a strong market presence throughout Southern Europe and emerging markets where space constraints favor compact equipment. The company’s European manufacturing facilities ensure regulatory compliance with EU MDR requirements while supporting rapid customer service response.
REPORT SYNOPSIS
| REPORT SCOPE | DETAILS |
|---|---|
| Market Forecast Years | 2026-2034 |
| Base Year | 2025 |
| Market Historical Years | 2022-2024 |
| Forecast Units | Revenue ($ Million) |
| Segments Analyzed | Architecture, Field Type, and Application |
| Countries Analyzed | The United Kingdom, Germany, France, Italy, Spain, Belgium, Poland, and Rest of Europe |
| Companies Analyzed | Analogic Corporation, Aurora Imaging Technology Inc, Canon Medical Systems Corporation, Carestream Health Inc, Esaote SpA, FONAR Corporation, FUJIFILM Holdings Corporation, GE HealthCare, Hologic Inc, Konica Minolta Inc, Medtronic plc, Mindray Medical International Limited, Philips Healthcare, Shimadzu Corporation, Siemens Healthineers |
TABLE OF CONTENTS
RESEARCH SCOPE & METHODOLOGY
- STUDY OBJECTIVES
- METHODOLOGY
- ASSUMPTIONS & LIMITATIONS
EXECUTIVE SUMMARY
- MARKET SIZE & FORECAST
- MARKET OVERVIEW
- SCOPE OF STUDY
- CRISIS SCENARIO ANALYSIS
- MAJOR MARKET FINDINGS
- THE MRI SYSTEMS MARKET IS EXPERIENCING STRONG GROWTH DRIVEN BY EXPANDING DEMAND FOR ADVANCED DIAGNOSTIC IMAGING CAPABILITIES IN HOSPITALS AND DIAGNOSTIC CENTERS
- THE MARKET IS SUPPORTED BY BROAD ADOPTION OF HIGH‑FIELD AND ULTRA‑LOW‑FIELD SYSTEMS
- PORTABLE AND COMPACT MRI SYSTEMS ARE OPENING NEW ACCESS POINTS IN OUTPATIENT, REMOTE, AND POINT‑OF‑CARE SETTINGS, SHAPING MARKET EXPANSION BEYOND TRADITIONAL HOSPITAL ENVIRONMENTS
MARKET DYNAMICS
- KEY DRIVERS
- RISING PREVALENCE OF CHRONIC AND NEUROLOGICAL DISEASES IS ACCELERATING THE NEED FOR SOPHISTICATED IMAGING TECHNIQUES THAT MRI TECHNOLOGY PROVIDES
- TECHNOLOGICAL ADVANCEMENTS INCLUDING AI INTEGRATION, HIGH‑RESOLUTION IMAGING, AND FASTER SCANNING CAPABILITIES ARE ENCOURAGING ADOPTION ACROSS HEALTHCARE FACILITIES
- INCREASING HEALTHCARE EXPENDITURE AND INFRASTRUCTURE DEVELOPMENT IN EMERGING ECONOMIES IS BOOSTING MARKET PENETRATION AND CAPITAL EQUIPMENT PURCHASES
- EXPANDING OUTPATIENT SERVICES AND SHIFT TOWARD NON‑INVASIVE DIAGNOSTICS ARE MAKING MRI SYSTEMS MORE FREQUENTLY UTILIZED ACROSS CARE SETTINGS
- KEY RESTRAINTS
- HIGH ACQUISITION, INSTALLATION, AND MAINTENANCE COSTS OF MRI SYSTEMS REMAIN A SIGNIFICANT BARRIER FOR SMALLER FACILITIES AND LOW‑RESOURCE REGIONS
- LIMITED ACCESS IN RURAL AND UNDERDEVELOPED AREAS PERSISTENTLY RESTRICTS BROADER MARKET REACH AND EQUITABLE CARE DELIVERY
- SHORTAGE OF SKILLED PERSONNEL AND RADIOLOGISTS FOR OPERATING ADVANCED MRI MACHINES HINDERS OPTIMAL UTILIZATION AND SCANNING CAPACITY
- STRINGENT REGULATORY REQUIREMENTS AND COMPLEX APPROVAL PROCESSES CAN DELAY MARKET ENTRY FOR NEW MRI TECHNOLOGIES
- KEY DRIVERS
KEY ANALYTICS
- KEY MARKET TRENDS
- INTEGRATION OF ARTIFICIAL INTELLIGENCE AND MACHINE LEARNING IN MRI SYSTEMS IS ENHANCING IMAGE QUALITY, WORKFLOW EFFICIENCY, AND DIAGNOSTIC ACCURACY
- GROWTH IN PORTABLE AND LOW‑FIELD MRI TECHNOLOGIES IS EXTENDING DIAGNOSTIC CAPABILITY TO REMOTE, OUTPATIENT, AND POINT‑OF‑CARE SETTINGS
- INCREASING FOCUS ON PATIENT COMFORT THROUGH OPEN, LOW‑NOISE, AND SHORTER SCAN MRI DESIGNS IS INFLUENCING PURCHASE DECISIONS
- SHIFT TOWARD AMBULATORY AND OUTSIDE HOSPITAL DIAGNOSTIC SERVICES IS EXPANDING MRI UTILIZATION BEYOND TRADITIONAL INPATIENT SETTINGS
- PORTER’S FIVE FORCES ANALYSIS
- BUYERS POWER
- SUPPLIERS POWER
- SUBSTIOTUTION
- NEW ENTRANTS
- INDUSTRY RIVALRY
- GROWTH PROSPECT MAPPING
- GROWTH PROSPECT MAPPING FOR EUROPE
- MARKET MATURITY ANALYSIS
- MARKET CONCENTRATION ANALYSIS
- VALUE CHAIN ANALYSIS
- RAW MAGNETIC COIL MANUFACTURING
- MAGNET AND COMPONENT SUPPLY
- MRI SYSTEM ASSEMBLY
- SOFTWARE & AI INTEGRATION
- DISTRIBUTION & LOGISTICS
- INSTALLATION & VALIDATION
- TRAINING & MAINTENANCE SERVICES
- AFTERMARKET SUPPORT
- KEY BUYING CRITERIA
- IMAGE QUALITY & RESOLUTION
- TOTAL COST OF OWNERSHIP
- PATIENT COMFORT FEATURES
- SERVICE & TECHNICAL SUPPORT
- REGULATORY FRAMEWORK
- KEY MARKET TRENDS
MAGNETIC RESONANCE IMAGING (MRI) SYSTEMS MARKET BY ARCHITECTURE
- CLOSED MRI SYSTEMS
- STANDARD BORE MRI SYSTEMS
- WIDE BORE MRI SYSTEMS
- OPEN MRI SYSTEMS
- CLOSED MRI SYSTEMS
MAGNETIC RESONANCE IMAGING (MRI) SYSTEMS MARKET BY FIELD TYPE
- HIGH FIELD SYSTEMS
- 5T SYSTEM
- 3T SYSTEM
- LOW-MID FIELD SYSTEMS
- ULTRA HIGH FIELD SYSTEMS
- HIGH FIELD SYSTEMS
MAGNETIC RESONANCE IMAGING (MRI) SYSTEMS MARKET BY APPLICATION
- BRAIN AND NEUROLOGY MRI SYSTEM
- SPINE AND MUSCULOSKELETAL MRI SYSTEM
- PELVIC AND ABDOMINAL MRI SYSTEM
- ONCOLOGY MRI SYSTEM
- VASCULAR MRI SYSTEM
- CARDIOLOGY MRI SYSTEM
- PEDIATRIC MRI SYSTEM
- GASTROENTEROLOGY MRI SYSTEM
- OTHER APPLICATIONS
GEOGRAPHICAL ANALYSIS
- EUROPE
- MARKET SIZE & ESTIMATES
- EUROPE MARKET DRIVERS
- EUROPE MAGNETIC RESONANCE IMAGING (MRI) SYSTEMS MARKET CHALLENGES
- KEY PLAYERS IN EUROPE MAGNETIC RESONANCE IMAGING (MRI) SYSTEMS MARKET
- COUNTRY ANALYSIS
- GERMANY
- GERMANY MARKET SIZE & OPPORTUNITIES
- UNITED KINGDOM
- UNITED KINGDOM MARKET SIZE & OPPORTUNITIES
- FRANCE
- FRANCE MARKET SIZE & OPPORTUNITIES
- ITALY
- ITALY MARKET SIZE & OPPORTUNITIES
- SPAIN
- SPAIN MARKET SIZE & OPPORTUNITIES
- BELGIUM
- BELGIUM MARKET SIZE & OPPORTUNITIES
- POLAND
- POLAND MARKET SIZE & OPPORTUNITIES
- REST OF EUROPE
- REST OF EUROPE MARKET SIZE & OPPORTUNITIES
- GERMANY
- EUROPE
COMPETITIVE LANDSCAPE
- KEY STRATEGIC DEVELOPMENTS
- MERGERS & ACQUISITIONS
- PRODUCT LAUNCHES & DEVELOPMENTS
- PARTNERSHIPS & AGREEMENTS
- BUSINESS EXPANSIONS & DIVESTITURES
- COMPANY PROFILES
- ANALOGIC CORPORATION
- COMPANY OVERVIEW
- PRODUCTS
- STRENGTHS & CHALLENGES
- AURORA IMAGING TECHNOLOGY INC
- COMPANY OVERVIEW
- PRODUCTS
- STRENGTHS & CHALLENGES
- CANON MEDICAL SYSTEMS CORP
- COMPANY OVERVIEW
- PRODUCTS
- STRENGTHS & CHALLENGES
- CARESTREAM HEALTH INC
- COMPANY OVERVIEW
- PRODUCTS
- STRENGTHS & CHALLENGES
- ESAOTE SPA
- COMPANY OVERVIEW
- PRODUCTS
- STRENGTHS & CHALLENGES
- FONARCORPORATION
- COMPANY OVERVIEW
- PRODUCTS
- STRENGTHS & CHALLENGES
- FUJIFILM HOLDINGS CORPORATION
- COMPANY OVERVIEW
- PRODUCTS
- STRENGTHS & CHALLENGES
- GE HEALTHCARE
- COMPANY OVERVIEW
- PRODUCTS
- STRENGTHS & CHALLENGES
- HOLOGIC INC
- COMPANY OVERVIEW
- PRODUCTS
- STRENGTHS & CHALLENGES
- KONICA MINOLTA
- COMPANY OVERVIEW
- PRODUCTS
- STRENGTHS & CHALLENGES
- MEDTRONIC PLC
- COMPANY OVERVIEW
- PRODUCTS
- STRENGTHS & CHALLENGES
- MINDRAY MEDICAL INTERNATIONAL LIMITED
- COMPANY OVERVIEW
- PRODUCTS
- STRENGTHS & CHALLENGES
- PHILIPS HEALTHCARE
- COMPANY OVERVIEW
- PRODUCTS
- STRENGTHS & CHALLENGES
- SHIMADZU CORP
- COMPANY OVERVIEW
- PRODUCTS
- STRENGTHS & CHALLENGES
- SIEMENS HEALTHINEERS
- COMPANY OVERVIEW
- PRODUCTS
- STRENGTHS & CHALLENGES
- ANALOGIC CORPORATION
- KEY STRATEGIC DEVELOPMENTS
LIST OF TABLES
TABLE 1: MARKET SNAPSHOT – MAGNETIC RESONANCE IMAGING (MRI) SYSTEMS
TABLE 2: MARKET BY ARCHITECTURE, BY REGION, HISTORICAL YEARS, 2022-2024 (IN $ MILLION)
TABLE 3: MARKET BY ARCHITECTURE, BY REGION, FORECAST YEARS, 2026-2034 (IN $ MILLION)
TABLE 4: MARKET BY CLOSED MRI SYSTEMS, BY REGION, HISTORICAL YEARS, 2022-2024 (IN $ MILLION)
TABLE 5: MARKET BY CLOSED MRI SYSTEMS, BY REGION, FORECAST YEARS, 2026-2034 (IN $ MILLION)
TABLE 6: MARKET BY FIELD TYPE, BY REGION, HISTORICAL YEARS, 2022-2024 (IN $ MILLION)
TABLE 7: MARKET BY FIELD TYPE, BY REGION, FORECAST YEARS, 2026-2034 (IN $ MILLION)
TABLE 8: MARKET BY HIGH FIELD SYSTEMS, BY REGION, HISTORICAL YEARS, 2022-2024 (IN $ MILLION)
TABLE 9: MARKET BY HIGH FIELD SYSTEMS, BY REGION, FORECAST YEARS, 2026-2034 (IN $ MILLION)
TABLE 10: MARKET BY APPLICATION, BY REGION, HISTORICAL YEARS, 2022-2024 (IN $ MILLION)
TABLE 11: MARKET BY APPLICATION, BY REGION, FORECAST YEARS, 2026-2034 (IN $ MILLION)
TABLE 12: EUROPE MARKET, COUNTRY ANALYSIS, HISTORICAL YEARS, 2022-2024 (IN $ MILLION)
TABLE 13: EUROPE MARKET, COUNTRY ANALYSIS, FORECAST YEARS, 2026-2034 (IN $ MILLION)
TABLE 14: KEY PLAYERS OPERATING IN THE EUROPEAN MARKET
TABLE 15: LIST OF MERGERS & ACQUISITIONS
TABLE 16: LIST OF PRODUCT LAUNCHES & DEVELOPMENTS
TABLE 17: LIST OF PARTNERSHIPS & AGREEMENTS
TABLE 18: LIST OF BUSINESS EXPANSIONS & DIVESTITURES
LIST OF FIGURES
FIGURE 1: KEY MARKET TRENDS
FIGURE 2: PORTER’S FIVE FORCES ANALYSIS
FIGURE 3: GROWTH PROSPECT MAPPING FOR EUROPE
FIGURE 4: MARKET MATURITY ANALYSIS
FIGURE 5: MARKET CONCENTRATION ANALYSIS
FIGURE 6: VALUE CHAIN ANALYSIS
FIGURE 7: KEY BUYING CRITERIA
FIGURE 8: SEGMENT GROWTH POTENTIAL, BY ARCHITECTURE, IN 2025
FIGURE 9: CLOSED MRI SYSTEMS MARKET SIZE, 2026-2034 (IN $ MILLION)
FIGURE 10: SEGMENT GROWTH POTENTIAL, BY CLOSED MRI SYSTEMS, IN 2025
FIGURE 11: STANDARD BORE MRI SYSTEMS MARKET SIZE, 2026-2034 (IN $ MILLION)
FIGURE 12: WIDE BORE MRI SYSTEMS MARKET SIZE, 2026-2034 (IN $ MILLION)
FIGURE 13: OPEN MRI SYSTEMS MARKET SIZE, 2026-2034 (IN $ MILLION)
FIGURE 14: SEGMENT GROWTH POTENTIAL, BY FIELD TYPE, IN 2025
FIGURE 15: HIGH FIELD SYSTEMS MARKET SIZE, 2026-2034 (IN $ MILLION)
FIGURE 16: SEGMENT GROWTH POTENTIAL, BY HIGH FIELD SYSTEMS, IN 2025
FIGURE 17: 1.5T SYSTEM MARKET SIZE, 2026-2034 (IN $ MILLION)
FIGURE 18: 3T SYSTEM MARKET SIZE, 2026-2034 (IN $ MILLION)
FIGURE 19: LOW-MID FIELD SYSTEMS MARKET SIZE, 2026-2034 (IN $ MILLION)
FIGURE 20: ULTRA HIGH FIELD SYSTEMS MARKET SIZE, 2026-2034 (IN $ MILLION)
FIGURE 21: SEGMENT GROWTH POTENTIAL, BY APPLICATION, IN 2025
FIGURE 22: BRAIN AND NEUROLOGY MRI SYSTEM MARKET SIZE, 2026-2034 (IN $ MILLION)
FIGURE 23: SPINE AND MUSCULOSKELETAL MRI SYSTEM MARKET SIZE, 2026-2034 (IN $ MILLION)
FIGURE 24: VASCULAR MRI SYSTEM MARKET SIZE, 2026-2034 (IN $ MILLION)
FIGURE 25: PELVIC AND ABDOMINAL MRI SYSTEM MARKET SIZE, 2026-2034 (IN $ MILLION)
FIGURE 26: ONCOLOGY MRI SYSTEM MARKET SIZE, 2026-2034 (IN $ MILLION)
FIGURE 27: CARDIOLOGY MRI SYSTEM MARKET SIZE, 2026-2034 (IN $ MILLION)
FIGURE 28: PEDIATRIC MRI SYSTEM MARKET SIZE, 2026-2034 (IN $ MILLION)
FIGURE 29: GASTROENTEROLOGY MRI SYSTEM MARKET SIZE, 2026-2034 (IN $ MILLION)
FIGURE 30: OTHER APPLICATIONS MARKET SIZE, 2026-2034 (IN $ MILLION)
FIGURE 31: EUROPE MAGNETIC RESONANCE IMAGING (MRI) SYSTEMS MARKET, COUNTRY OUTLOOK, 2025 & 2034 (IN %)
FIGURE 32: GERMANY MARKET SIZE, 2026-2034 (IN $ MILLION)
FIGURE 33: UNITED KINGDOM MARKET SIZE, 2026-2034 (IN $ MILLION)
FIGURE 34: FRANCE MARKET SIZE, 2026-2034 (IN $ MILLION)
FIGURE 35: ITALY MARKET SIZE, 2026-2034 (IN $ MILLION)
FIGURE 36: SPAIN MARKET SIZE, 2026-2034 (IN $ MILLION)
FIGURE 37: BELGIUM MARKET SIZE, 2026-2034 (IN $ MILLION)
FIGURE 38: POLAND MARKET SIZE, 2026-2034 (IN $ MILLION)
FIGURE 39: REST OF EUROPE MARKET SIZE, 2026-2034 (IN $ MILLION)
FAQ’s
RELATED REPORTS
-
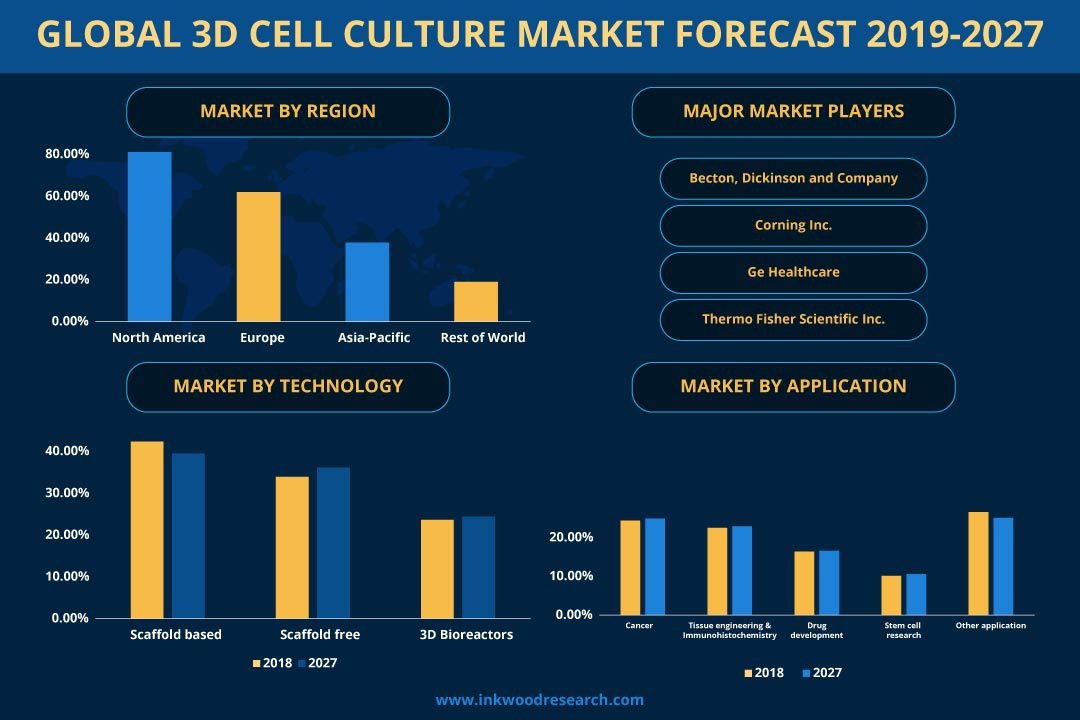
GLOBAL 3D CELL CULTURE MARKET FORECAST 2026
-
NORTH AMERICA 3D CELL CULTURE MARKET FORECAST 2026
-
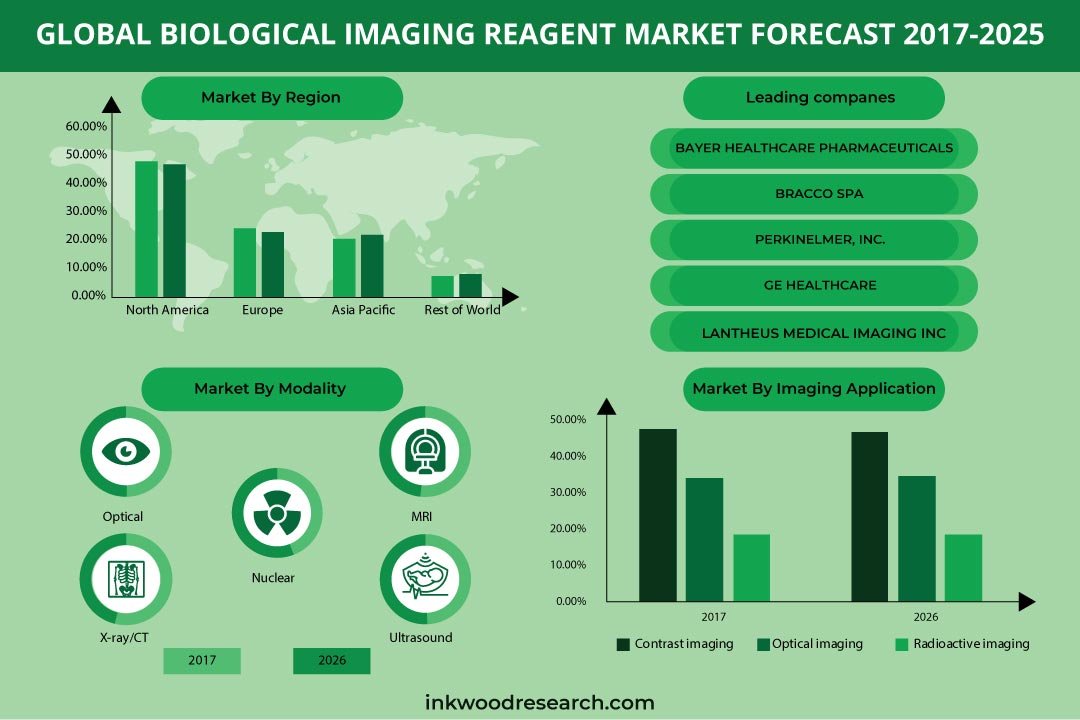
GLOBAL BIOLOGICAL IMAGING REAGENT MARKET FORECAST 2026
-
EUROPE SOLAR ENCAPSULATION MARKET FORECAST 2026-2034
-

NORTH AMERICA SOLAR ENCAPSULATION MARKET FORECAST 2026-2034
-

SPAIN ADVANCED DELIVERY NUTRACEUTICALS MARKET FORECAST 2026-2034
-
MEXICO ADVANCED DELIVERY NUTRACEUTICALS MARKET FORECAST 2026-2034
-

ITALY ADVANCED DELIVERY NUTRACEUTICALS MARKET FORECAST 2026-2034
-
AUSTRALIA ADVANCED DELIVERY NUTRACEUTICALS MARKET FORECAST 2026-2034
-

BRAZIL ADVANCED DELIVERY NUTRACEUTICALS MARKET FORECAST 2026-2034