China Biogas Market by Source Type (Agricultural, Industrial, Municipal) Market by Application (Electricity Generation, Biofuel Production, Heat Generation) Market by End-User (Power Utilities, Industrial, Commercial, Residential, Other End-Users) Market by Technology (Fixed Dome, Floating Drum, Balloon, Other Plant Concepts, Wet Vs Dry Digestion, Single Vs Multi-Stage), by Geography
CHINA BIOGAS MARKET OVERVIEW
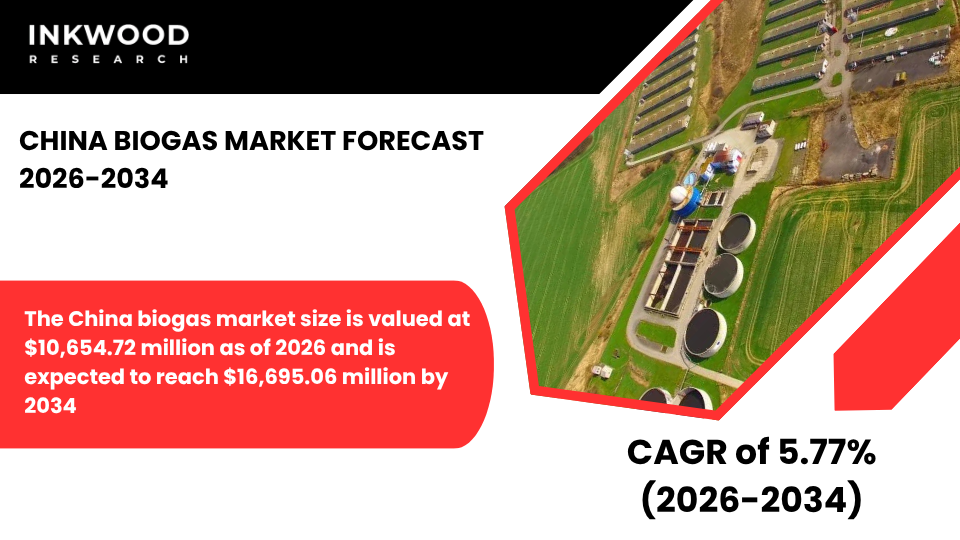
The China biogas market size is valued at $10,654.72 million as of 2026 and is expected to reach $16,695.06 million by 2034, progressing with a CAGR of 5.77% during the forecast years, 2026-2034.
China operates one of the world’s most extensive biogas infrastructure networks, historically dominated by small-scale household digesters serving rural communities. Traditional farm-based systems developed over decades provided clean cooking fuel and residential energy, particularly in agricultural regions where livestock waste offered readily available feedstock.
However, the market landscape demonstrates significant transformation as policy priorities shift toward industrial-scale facilities and centralized municipal projects. According to the International Energy Agency, China’s continued growth in biogas production during 2024, with several indicators pointing toward sector acceleration.
Further, state-owned energy and gas companies recently commissioned bio-natural gas plants, while foreign companies establish new production facilities across the country. Notably, power generation represents 69% of biogas utilization when excluding household production, with installed capacity growing 22% between 2022 and 2023.
On the other hand, government programs strongly influence market development patterns through strategic funding mechanisms and technology deployment initiatives. Policies implemented since 2015 prioritize medium and large-scale projects over household systems, reflecting broader objectives around waste management, emissions reduction, and resource recovery.
Rising organic waste generation from rapid urbanization and agricultural intensification provides substantial feedstock availability, supporting project economics through reliable substrate supplies. Furthermore, China’s manufacturing capabilities enable low-cost construction and local technology production, improving project affordability compared to imported equipment alternatives.
To Know More About This Report, Request a Free Sample Copy
Industrial biogas demand expands for both energy and chemical applications, as companies explore biomethane utilization for low-emissions hydrogen and methanol production. The IEA reports that China signed its first biomethane purchase agreements in 2024, signaling market maturation toward commercial renewable natural gas transactions.
Nevertheless, operational challenges persist around small-scale system utilization and performance standardization. Many household digesters suffer from low gas yields and operational inefficiencies due to inadequate maintenance, inconsistent feedstock management, and technical knowledge gaps among rural operators.
Limited standardization across technologies results in variable plant performance, complicating quality control and reliability expectations. Additionally, gas infrastructure constraints restrict large-scale commercialization opportunities, particularly in regions lacking pipeline networks for biomethane distribution.
Moreover, training deficiencies affect long-term plant sustainability, as operators struggle to optimize anaerobic digestion processes without specialized technical support. Market evolution increasingly focuses on technology upgrades that improve gas yield and process stability through advanced monitoring systems and automated controls. Collectively, these factors are set to play a pivotal role in influencing the biogas market growth in China during the forecasted years.
The China biogas market is segmented into source type, application, end-user, and technology. The end-user segment is further categorized into power utilities, industrial, commercial, residential, and other end-users.
Industrial end-users emerge as a strategic growth segment, consuming biogas for thermal energy, process heat, and increasingly for power generation applications. Manufacturing facilities, food processing plants, and chemical producers utilize biogas to reduce fossil fuel dependence while managing organic waste streams from production operations.
This segment benefits from concentrated feedstock availability at industrial sites, creating opportunities for on-site anaerobic digestion that converts waste liabilities into energy assets. Industrial biogas adoption addresses rising energy costs while supporting corporate decarbonization commitments under China’s climate policy framework.
Companies integrate biogas systems with existing manufacturing processes, utilizing captured methane for steam generation, drying operations, and combined heat and power applications. The segment demonstrates strong economics through waste disposal cost reductions combined with energy procurement savings, particularly for operations generating substantial organic byproducts.
Moreover, industrial facilities possess technical expertise and capital resources that support reliable plant operation and maintenance, overcoming challenges that constrain smaller-scale residential systems. Government incentives further strengthen industrial adoption through emissions reduction credits and renewable energy subsidies targeting large-scale biogas implementations.
Some of the top players operating in the China biogas market include Air Liquide, Engie SA, etc.
Air Liquide operates as a multinational industrial gas company providing comprehensive biomethane solutions across biogas production, purification, and distribution value chains. The company develops competencies throughout biogas upgrading processes, converting raw biogas into pipeline-quality biomethane through the removal of carbon dioxide, moisture, and impurities.
Air Liquide’s technology portfolio includes membrane-based gas separation systems and cryogenic purification equipment that achieve high methane concentrations suitable for grid injection or vehicle fuel applications. The firm currently operates 29 biomethane production units globally with approximately 2 TWh annual production capacity, serving industrial customers and transportation fuel markets.
In China, Air Liquide supplies biogas purification technologies and engineering services to support the country’s emerging renewable natural gas sector. The company’s biomethane and biogas activities transferred to its Industrial Merchant business segment in January 2025, reflecting strategic reorganization around decarbonization solutions.
Furthermore, Air Liquide leverages its extensive industrial gas expertise to provide biogas compression, liquefaction, storage, and transportation solutions that enable biomethane commercialization across diverse end-use applications, including industry, transport, and power generation sectors.
REPORT SYNOPSIS
| REPORT SCOPE | DETAILS |
|---|---|
| Market Forecast Years | 2026-2034 |
| Base Year | 2025 |
| Market Historical Years | 2022-2024 |
| Forecast Units | Revenue ($ Million) |
| Segments Analyzed | Source Type, Application, End-User, and Technology |
| Country Analyzed | China |
| Companies Analyzed | DVO Inc, ENGIE SA, Evonik Industries AG, Air Liquide, YHR Environment (Subsidiary of Beijing Yingherui Environmental Technology Co Ltd) |
TABLE OF CONTENTS
RESEARCH SCOPE & METHODOLOGY
- STUDY OBJECTIVES
- METHODOLOGY
- ASSUMPTIONS & LIMITATIONS
EXECUTIVE SUMMARY
- MARKET SIZE & FORECAST
- MARKET OVERVIEW
- SCOPE OF STUDY
- CRISIS SCENARIO ANALYSIS
- MAJOR MARKET FINDINGS
- CHINA OPERATES A SIGNIFICANT NUMBER OF BIOGAS UNITS GLOBALLY, PRIMARILY AT SMALL AND MEDIUM SCALE
- RURAL HOUSEHOLD AND AGRICULTURAL BIOGAS SYSTEMS FORM THE BACKBONE OF THE MARKET
- INDUSTRIAL AND MUNICIPAL BIOGAS PROJECTS ARE EMERGING AS A HIGH-GROWTH SEGMENT
- GOVERNMENT PROGRAMS STRONGLY INFLUENCE DEPLOYMENT PATTERNS AND TECHNOLOGY CHOICES
MARKET DYNAMICS
- KEY DRIVERS
- STRONG GOVERNMENT SUPPORT FOR RURAL ENERGY AND WASTE MANAGEMENT IS DRIVING BIOGAS ADOPTION
- RISING ORGANIC WASTE GENERATION FROM AGRICULTURE AND URBANIZATION SUPPORTS FEEDSTOCK AVAILABILITY
- FOCUS ON EMISSIONS REDUCTION AND RESOURCE RECOVERY STRENGTHENS POLICY BACKING
- LOW-COST CONSTRUCTION AND LOCAL TECHNOLOGY MANUFACTURING IMPROVE PROJECT AFFORDABILITY
- KEY RESTRAINTS
- SMALL SCALE SYSTEMS OFTEN SUFFER FROM LOW UTILIZATION AND OPERATIONAL INEFFICIENCIES
- LIMITED STANDARDIZATION RESULTS IN VARIABLE PLANT PERFORMANCE AND GAS OUTPUT
- INSUFFICIENT OPERATIONAL TRAINING AFFECTS LONG-TERM PLANT SUSTAINABILITY
- GRID AND GAS INFRASTRUCTURE CONSTRAINTS LIMIT LARGE-SCALE COMMERCIALIZATION
- KEY DRIVERS
KEY ANALYTICS
- KEY MARKET TRENDS
- SHIFT TOWARD LARGE INDUSTRIAL AND MUNICIPAL BIOGAS PLANTS IS INCREASING
- INTEGRATION OF BIOGAS WITH ORGANIC FERTILIZER PRODUCTION IS GAINING TRACTION
- POLICY EMPHASIS IS MOVING FROM HOUSEHOLD SYSTEMS TO CENTRALIZED PROJECTS
- TECHNOLOGY UPGRADES ARE IMPROVING GAS YIELD AND PROCESS STABILITY
- PORTER’S FIVE FORCES ANALYSIS
- BUYERS POWER
- SUPPLIERS POWER
- SUBSTITUTION
- NEW ENTRANTS
- INDUSTRY RIVALRY
- GROWTH PROSPECT MAPPING
- GROWTH PROSPECT MAPPING FOR CHINA
- MARKET MATURITY ANALYSIS
- MARKET CONCENTRATION ANALYSIS
- VALUE CHAIN ANALYSIS
- FEEDSTOCK COLLECTION
- WASTE PRETREATMENT
- ANAEROBIC DIGESTION
- BIOGAS UPGRADING
- POWER GENERATION
- DISTRIBUTION SALES
- KEY BUYING CRITERIA
- FEEDSTOCK AVAILABILITY
- CAPEX PAYBACK
- TECHNOLOGY RELIABILITY
- POLICY INCENTIVES
- REGULATORY FRAMEWORK
- KEY MARKET TRENDS
BIOGAS MARKET BY SOURCE TYPE
- AGRICULTURAL
- MARKET FORECAST FIGURE
- SEGMENT ANALYSIS
- INDUSTRIAL
- MARKET FORECAST FIGURE
- SEGMENT ANALYSIS
- MUNICIPAL
- MARKET FORECAST FIGURE
- SEGMENT ANALYSIS
- AGRICULTURAL
BIOGAS MARKET BY APPLICATION
- ELECTRICITY GENERATION
- MARKET FORECAST FIGURE
- SEGMENT ANALYSIS
- BIOFUEL PRODUCTION
- MARKET FORECAST FIGURE
- SEGMENT ANALYSIS
- HEAT GENERATION
- MARKET FORECAST FIGURE
- SEGMENT ANALYSIS
- ELECTRICITY GENERATION
BIOGAS MARKET BY END-USER
- POWER UTILITIES
- MARKET FORECAST FIGURE
- SEGMENT ANALYSIS
- INDUSTRIAL
- MARKET FORECAST FIGURE
- SEGMENT ANALYSIS
- COMMERCIAL
- MARKET FORECAST FIGURE
- SEGMENT ANALYSIS
- RESIDENTIAL
- MARKET FORECAST FIGURE
- SEGMENT ANALYSIS
- OTHER END-USERS
- MARKET FORECAST FIGURE
- SEGMENT ANALYSIS
- POWER UTILITIES
BIOGAS MARKET BY TECHNOLOGY
- FIXED DOME
- MARKET FORECAST FIGURE
- SEGMENT ANALYSIS
- FLOATING DRUM
- MARKET FORECAST FIGURE
- SEGMENT ANALYSIS
- BALLOON
- MARKET FORECAST FIGURE
- SEGMENT ANALYSIS
- OTHER PLANT CONCEPTS
- MARKET FORECAST FIGURE
- SEGMENT ANALYSIS
- WET VS DRY DIGESTION
- MARKET FORECAST FIGURE
- SEGMENT ANALYSIS
- SINGLE VS MULTI‑STAGE
- MARKET FORECAST FIGURE
- SEGMENT ANALYSIS
- FIXED DOME
COMPETITIVE LANDSCAPE
- KEY STRATEGIC DEVELOPMENTS
- MERGERS & ACQUISITIONS
- PRODUCT LAUNCHES & DEVELOPMENTS
- PARTNERSHIPS & AGREEMENTS
- BUSINESS EXPANSIONS & DIVESTITURES
- COMPANY PROFILES
- DVO INC
- COMPANY OVERVIEW
- PRODUCT LIST
- STRENGTHS & CHALLENGES
- ENGIE SA
- COMPANY OVERVIEW
- PRODUCT LIST
- STRENGTHS & CHALLENGES
- EVONIK INDUSTRIES AG
- COMPANY OVERVIEW
- PRODUCT LIST
- STRENGTHS & CHALLENGES
- AIR LIQUIDE
- COMPANY OVERVIEW
- PRODUCT LIST
- STRENGTHS & CHALLENGES
- YHR ENVIRONMENT (SUBSIDIARY OF BEIJING YINGHERUI ENVIRONMENTAL TECHNOLOGY CO LTD)
- COMPANY OVERVIEW
- PRODUCT LIST
- STRENGTHS & CHALLENGES
- DVO INC
- KEY STRATEGIC DEVELOPMENTS
LIST OF TABLES
TABLE 1: MARKET SNAPSHOT – BIOGAS
TABLE 2: BIOGAS MARKET REGULATORY FRAMEWORK
TABLE 3: MARKET BY SOURCE TYPE, HISTORICAL YEARS, 2022-2024 (IN $ MILLION)
TABLE 4: MARKET BY SOURCE TYPE, FORECAST YEARS, 2026-2034 (IN $ MILLION)
TABLE 5: MARKET BY APPLICATION, HISTORICAL YEARS, 2022-2024 (IN $ MILLION)
TABLE 6: MARKET BY APPLICATION, FORECAST YEARS, 2026-2034 (IN $ MILLION)
TABLE 7: MARKET BY END-USER, HISTORICAL YEARS, 2022-2024 (IN $ MILLION)
TABLE 8: MARKET BY END-USER, FORECAST YEARS, 2026-2034 (IN $ MILLION)
TABLE 9: MARKET BY TECHNOLOGY, HISTORICAL YEARS, 2022-2024 (IN $ MILLION)
TABLE 10: MARKET BY TECHNOLOGY, FORECAST YEARS, 2026-2034 (IN $ MILLION)
TABLE 11: KEY PLAYERS OPERATING IN THE CHINESE MARKET
TABLE 12: LIST OF MERGERS & ACQUISITIONS
TABLE 13: LIST OF PRODUCT LAUNCHES & DEVELOPMENTS
TABLE 14: LIST OF PARTNERSHIPS & AGREEMENTS
TABLE 15: LIST OF BUSINESS EXPANSIONS & DIVESTITURES
LIST OF FIGURES
FIGURE 1: KEY MARKET TRENDS
FIGURE 2: PORTER’S FIVE FORCES ANALYSIS
FIGURE 3: GROWTH PROSPECT MAPPING FOR CHINA
FIGURE 4: MARKET MATURITY ANALYSIS
FIGURE 5: MARKET CONCENTRATION ANALYSIS
FIGURE 6: VALUE CHAIN ANALYSIS
FIGURE 7: KEY BUYING CRITERIA
FIGURE 8: SEGMENT GROWTH POTENTIAL, BY SOURCE TYPE, IN 2025
FIGURE 9: AGRICULTURAL MARKET SIZE, 2026-2034 (IN $ MILLION)
FIGURE 10: INDUSTRIAL MARKET SIZE, 2026-2034 (IN $ MILLION)
FIGURE 11: MUNICIPAL MARKET SIZE, 2026-2034 (IN $ MILLION)
FIGURE 12: SEGMENT GROWTH POTENTIAL, BY APPLICATION, IN 2025
FIGURE 13: ELECTRICITY GENERATION MARKET SIZE, 2026-2034 (IN $ MILLION)
FIGURE 14: BIOFUEL PRODUCTION MARKET SIZE, 2026-2034 (IN $ MILLION)
FIGURE 15: HEAT GENERATION MARKET SIZE, 2026-2034 (IN $ MILLION)
FIGURE 16: SEGMENT GROWTH POTENTIAL, BY END-USER, IN 2025
FIGURE 17: POWER UTILITIES MARKET SIZE, 2026-2034 (IN $ MILLION)
FIGURE 18: INDUSTRIAL MARKET SIZE, 2026-2034 (IN $ MILLION)
FIGURE 19: COMMERCIAL MARKET SIZE, 2026-2034 (IN $ MILLION)
FIGURE 20: RESIDENTIAL MARKET SIZE, 2026-2034 (IN $ MILLION)
FIGURE 21: OTHER END-USERS MARKET SIZE, 2026-2034 (IN $ MILLION)
FIGURE 22: SEGMENT GROWTH POTENTIAL, BY TECHNOLOGY, IN 2025
FIGURE 23: FIXED DOME MARKET SIZE, 2026-2034 (IN $ MILLION)
FIGURE 24: FLOATING DRUM MARKET SIZE, 2026-2034 (IN $ MILLION)
FIGURE 25: BALLOON MARKET SIZE, 2026-2034 (IN $ MILLION)
FIGURE 26: OTHER PLANT CONCEPTS MARKET SIZE, 2026-2034 (IN $ MILLION)
FIGURE 27: WET VS DRY DIGESTION MARKET SIZE, 2026-2034 (IN $ MILLION)
FIGURE 28: SINGLE VS MULTI-STAGE MARKET SIZE, 2026-2034 (IN $ MILLION)
FAQ’s
RELATED REPORTS
-

UNITED STATES AI-DRIVEN CLOUD MIGRATION SERVICES MARKET FORECAST 2026-2034
-

UNITED KINGDOM AI-DRIVEN CLOUD MIGRATION SERVICES MARKET FORECAST 2026-2034
-

UNITED ARAB EMIRATES AI-DRIVEN CLOUD MIGRATION SERVICES MARKET FORECAST 2026-2034
-

SOUTH KOREA AI-DRIVEN CLOUD MIGRATION SERVICES MARKET FORECAST 2026-2034
-

SINGAPORE AI-DRIVEN CLOUD MIGRATION SERVICES MARKET FORECAST 2026-2034
-

SAUDI ARABIA AI-DRIVEN CLOUD MIGRATION SERVICES MARKET FORECAST 2026-2034
-

AUSTRALIA AI-DRIVEN CLOUD MIGRATION SERVICES MARKET FORECAST 2026-2034
-

JAPAN AI-DRIVEN CLOUD MIGRATION SERVICES MARKET FORECAST 2026-2034
-

INDIA AI-DRIVEN CLOUD MIGRATION SERVICES MARKET FORECAST 2026-2034
-

CHINA AI-DRIVEN CLOUD MIGRATION SERVICES MARKET FORECAST 2026-2034