ASIA-PACIFIC ETHNIC FOOD MARKET OVERVIEW
The Asia-Pacific ethnic food market size is valued at $21227.18 million as of 2025 and is expected to reach $39578.56 million by 2032, progressing with a CAGR of 9.31% during the forecast years, 2025-2032.
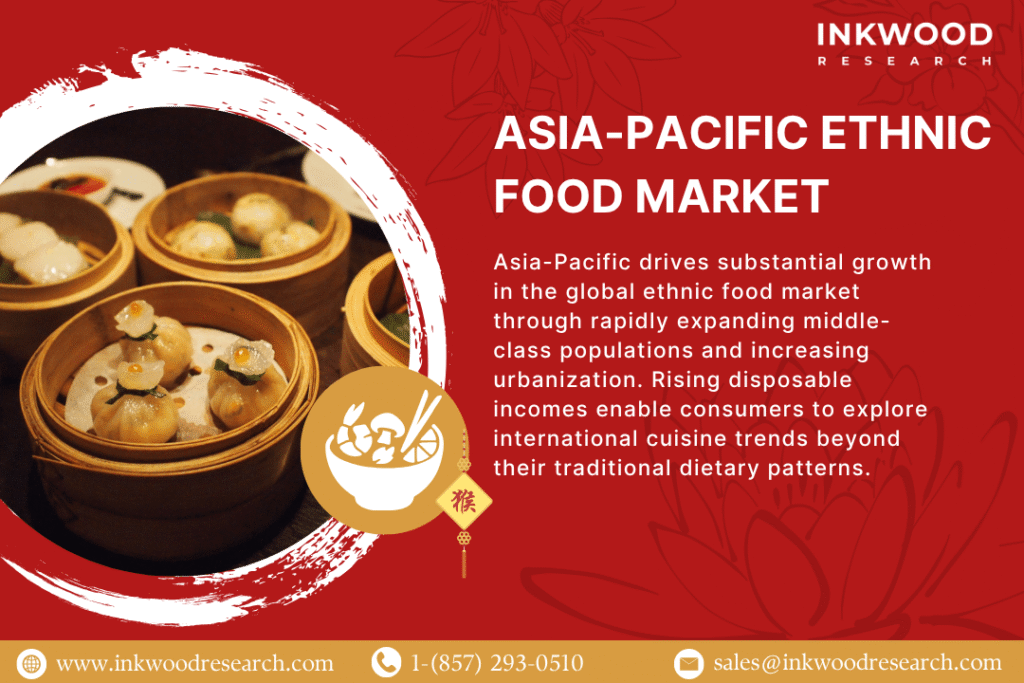
Asia-Pacific drives substantial growth in the global ethnic food market through rapidly expanding middle-class populations and increasing urbanization. Rising disposable incomes enable consumers to explore international cuisine trends beyond their traditional dietary patterns. Moreover, the region’s diverse cultural landscape creates a natural demand for packaged ethnic foods representing neighboring countries.
Digital connectivity accelerates awareness of authentic food recipes from various Asian and international cultures. E-commerce penetration facilitates access to specialty food imports previously unavailable in local markets. Additionally, busy urban lifestyles boost demand for convenient, ready-to-eat ethnic dishes among working professionals.
To Know More About This Report, Request a Free Sample Copy
Additionally, tourism within Asia introduces consumers to exotic flavors analysis from regional neighbors, subsequently driving retail purchases. Furthermore, government initiatives promoting food safety and quality standards strengthen consumer confidence in packaged ethnic foods.
The Asia-Pacific ethnic food market growth assessment includes the analysis of China, Japan, India, South Korea, Indonesia, Vietnam, Thailand, Australia & New Zealand, and Rest of Asia-Pacific.
China represents the largest market for ethnic food in Asia-Pacific, driven by urbanization and evolving consumer taste shifts. Major cities like Shanghai, Beijing, and Guangzhou showcase a growing appetite for international cuisine trends beyond traditional Chinese fare. Millennials and Gen Z consumers actively seek authentic food recipes from Japanese, Korean, Thai, and Western cultures. Rising middle-class incomes enable experimental dining behaviors and premium gourmet ethnic meals purchases. E-commerce platforms like Tmall and JD.com facilitate widespread distribution of specialty food imports across tier-1 and tier-2 cities.
Government regulations under the China Food Safety Law ensure stringent quality standards for imported packaged ethnic foods. The China Food and Drug Administration monitors specialty food imports rigorously, creating barriers for unauthenticated products. However, these regulations simultaneously build consumer trust in certified ready-to-eat ethnic dishes. Japanese and Korean cuisines show particularly strong traction, reflecting geographical proximity and cultural exchange.
Street food popularity from neighboring countries influences product development in frozen ethnic meals categories. Health-conscious ethnic food variants gain momentum as Chinese consumers prioritize nutritional value alongside taste. Consequently, organic ethnic food and plant-based ethnic meals capture growing market share among urban professionals. Restaurant ethnic menus featuring Southeast Asian, Japanese, and Western cuisines proliferate across shopping districts. Traditional food demand for regional Asian cuisines creates opportunities for authentic specialty food imports. Online retail channels enable niche brands to reach consumers in lower-tier cities efficiently.
Conversely, Japan’s ethnic food market thrives on consumer openness to international cuisine trends despite strong culinary traditions. Urban consumers demonstrate sophisticated palates shaped by extensive travel experiences and media exposure. Korean, Thai, Vietnamese, and Indian cuisines gain popularity through restaurant ethnic menus and retail products.
Convenience stores stock diverse ready-to-eat ethnic dishes catering to busy professionals seeking quick meals. Additionally, Japan’s aging population drives demand for convenient frozen ethnic meals requiring minimal preparation. Halal food expansion accelerates in major cities, accommodating growing Muslim tourist populations and residents. Government support for tourism promotes cultural dining habits awareness, subsequently boosting retail ethnic food sales.
South Korea’s ethnic food market expands rapidly, driven by globalization and international cultural exchange. Young consumers actively explore authentic food recipes from neighboring Asian countries and Western cultures. Japanese, Chinese, Thai, and Mexican cuisines show strong market penetration through specialty food imports.
Moreover, Korea’s sophisticated cold chain infrastructure supports the distribution of frozen ethnic meals nationwide. Street food popularity from Southeast Asia influences product innovation in ethnic snacks growth categories. Health-conscious ethnic food options align with Korean consumers’ wellness priorities and beauty-from-within trends. Furthermore, sustainable ethnic packaging appeals to environmentally conscious younger demographics purchasing packaged ethnic foods.
The Asia-Pacific ethnic food market is segmented into cuisine type, food type, product type, and distribution channel. The distribution channel segment is further classified into supermarkets / hypermarkets, convenience / grocery stores, specialty stores, online retail, and other distribution channels.
Online retail emerges as one of the fastest-growing distribution channels for ethnic food across Asia-Pacific markets. E-commerce platforms provide convenient access to specialty food imports unavailable in physical stores. Digital channels enable niche brands offering authentic food recipes to reach geographically dispersed consumer communities efficiently.
China’s sophisticated e-commerce ecosystem through Alibaba and JD.com facilitates seamless purchases of international cuisine trends products. India’s growing internet penetration drives online purchases of ready-to-eat ethnic dishes among urban millennials. Southeast Asian markets leverage platforms like Lazada and Shopee for cross-border specialty food imports distribution.
Social media integration with e-commerce accelerates the discovery of exotic flavors analysis through influencer recommendations. Live-streaming commerce enables brands to demonstrate cooking techniques using authentic food recipes and ingredients. Subscription services deliver curated selections of gourmet ethnic meals directly to consumers seeking convenience. Additionally, online retail provides detailed product information addressing consumer taste shifts and dietary preferences. Customer reviews and ratings build trust in packaged ethnic foods from unfamiliar brands or cuisines.
Digital payment systems and reliable logistics infrastructure support seamless transactions for frozen ethnic meals. Furthermore, online platforms offer promotional pricing, making specialty food imports accessible to price-sensitive consumers. Festival food consumption drives seasonal online sales as consumers purchase traditional ingredients for cultural celebrations. Restaurant ethnic menus inspire home cooking, subsequently driving online purchases of authentic ingredients and sauces. Consequently, brands invest heavily in digital marketing to capture the growing online ethnic food consumer base.
Some of the top players operating in the Asia-Pacific ethnic food market include Ajinomoto Co Inc, ITC Limited, Tata Consumer Products, Yeo’s Group, etc.
Ajinomoto Co Inc operates as a leading global food and biotechnology company headquartered in Tokyo, Japan. The company specializes in manufacturing amino acids, processed foods, beverages, and seasonings distributed across international markets. Ajinomoto’s product portfolio includes frozen foods, cooking oils, sweeteners, and the widely recognized umami seasoning products.
Within the ethnic food segment, Ajinomoto produces frozen ethnic meals, ready-to-eat ethnic dishes, and authentic Asian condiments. The company’s frozen dumpling range captures significant market share across Asia-Pacific through retail and food service channels. Moreover, Ajinomoto leverages extensive research and development capabilities to create authentic food recipes adapted for modern consumers.
The firm operates production facilities strategically located throughout Asia, enabling efficient distribution of packaged ethnic foods. Ajinomoto’s business model emphasizes quality, taste, and nutritional value aligned with health-conscious ethnic food trends. Strategic partnerships with retailers ensure widespread availability of ready-to-eat ethnic dishes across supermarkets and convenience stores. Furthermore, the company invests substantially in sustainable ethnic packaging initiatives addressing environmental concerns.
Ajinomoto’s expertise in flavor science positions it competitively in developing fusion food innovations blending traditional and contemporary tastes. The company actively expands its portfolio of plant-based ethnic meals, responding to growing vegetarian demand. Consequently, Ajinomoto maintains strong brand recognition supporting its leadership position in Asia-Pacific ethnic food markets.
REPORT SYNOPSIS
| REPORT SCOPE | DETAILS |
|---|---|
| Market Forecast Years | 2025-2032 |
| Base Year | 2024 |
| Market Historical Years | 2018-2023 |
| Forecast Units | Revenue ($ Million) |
| Segments Analyzed | Cuisine Type, Food Type, Product Type, and Distribution Channel |
| Country Analyzed | China, Japan, India, South Korea, Indonesia, Vietnam, Thailand, Australia & New Zealand, and Rest of Asia-Pacific |
| Companies Analyzed | Ajinomoto Co Inc, Aryzta AG, Associated British Foods plc, Capital Foods Ltd, Conagra Brands Inc, General Mills Inc, Goya Foods Inc, GraceKennedy Ltd, Halwani Bros, Huy Fong Foods Inc, ITC Limited, McCormick & Company Inc, Nestlé SA, Orkla ASA, Paulig Ltd, Tai Pei Foods, Tata Consumer Products, The Hain Celestial Group, The Spice Tailor, Yeo’s Group |
TABLE OF CONTENTS
RESEARCH SCOPE & METHODOLOGY
- STUDY OBJECTIVES
- METHODOLOGY
- ASSUMPTIONS & LIMITATIONS
EXECUTIVE SUMMARY
- MARKET SIZE & FORECAST
- MARKET OVERVIEW
- SCOPE OF STUDY
- CRISIS SCENARIO ANALYSIS
- MAJOR MARKET FINDINGS
- THE MARKET IS EXPERIENCING STRONG GROWTH DUE TO INCREASING CONSUMER INTEREST IN AUTHENTIC AND DIVERSE CUISINES
- RISING MIGRATION AND CULTURAL EXCHANGE ARE BROADENING THE CONSUMER BASE FOR MULTI-REGIONAL FOOD PRODUCTS
- PRE-PACKAGED AND READY-TO-EAT ETHNIC FOOD SEGMENTS ARE GAINING POPULARITY AMONG URBAN AND MILLENNIAL CONSUMERS
- LEADING BRANDS ARE INVESTING IN CLEAN LABEL INGREDIENTS AND HEALTHIER RECIPE VARIANTS TO APPEAL TO HEALTH-CONSCIOUS BUYERS
MARKET DYNAMICS
- KEY DRIVERS
- INCREASING GLOBALIZATION AND EXPOSURE TO INTERNATIONAL CUISINES
- RISING URBANIZATION AND BUSY LIFESTYLES BOOSTING DEMAND FOR CONVENIENT ETHNIC MEALS
- EXPANDING RETAIL CHANNELS AND ONLINE FOOD DELIVERY PLATFORMS
- GROWING TOURISM AND CULTURAL DIVERSITY IN DEVELOPED AND EMERGING MARKET
- KEY RESTRAINTS
- HIGH COSTS OF IMPORTED INGREDIENTS AND RAW MATERIALS
- LACK OF STANDARDIZATION AND AUTHENTICITY IN MASS-PRODUCED PRODUCTS
- LIMITED AWARENESS OF REGIONAL CUISINES IN CERTAIN MARKETS
- SUPPLY CHAIN CHALLENGES AND FLUCTUATIONS IN RAW MATERIAL AVAILABILITY
- KEY DRIVERS
KEY ANALYTICS
- KEY MARKET TRENDS
- INCREASING ADOPTION OF FUSION CUISINES BLENDING LOCAL AND GLOBAL FLAVORS
- GROWING DEMAND FOR PLANT-BASED AND VEGAN ETHNIC FOOD OPTIONS
- RISING POPULARITY OF ETHNIC STREET FOOD CONCEPTS IN QUICK-SERVICE RESTAURANTS
- INNOVATION IN PACKAGING AND PRESERVATION TO EXTEND SHELF LIFE AND QUALITY
- PORTER’S FIVE FORCES ANALYSIS
- BUYERS POWER
- SUPPLIERS POWER
- SUBSTITUTION
- NEW ENTRANTS
- INDUSTRY RIVALRY
- GROWTH PROSPECT MAPPING
- GROWTH PROSPECT MAPPING FOR ASIA-PACIFIC
- MARKET MATURITY ANALYSIS
- MARKET CONCENTRATION ANALYSIS
- VALUE CHAIN ANALYSIS
- RAW MATERIAL SUPPLIERS
- INGREDIENT PROCESSORS
- FOOD MANUFACTURERS
- PACKAGING COMPANIES
- DISTRIBUTORS AND RETAILERS
- FOOD SERVICE OPERATORS
- END CONSUMER
- KEY BUYING CRITERIA
- TASTE AUTHENTICITY
- HEALTH AND NUTRITION
- PRICE AFFORDABILITY
- BRAND REPUTATION
- REGULATORY FRAMEWORK
- KEY MARKET TRENDS
ETHNIC FOOD MARKET BY CUISINE TYPE
- CHINESE
- MARKET FORECAST FIGURE
- SEGMENT ANALYSIS
- JAPANESE
- MARKET FORECAST FIGURE
- SEGMENT ANALYSIS
- INDIAN
- MARKET FORECAST FIGURE
- SEGMENT ANALYSIS
- THAI
- MARKET FORECAST FIGURE
- SEGMENT ANALYSIS
- KOREAN
- MARKET FORECAST FIGURE
- SEGMENT ANALYSIS
- MEXICAN
- MARKET FORECAST FIGURE
- SEGMENT ANALYSIS
- BRAZILIAN
- MARKET FORECAST FIGURE
- SEGMENT ANALYSIS
- LEBANESE
- MARKET FORECAST FIGURE
- SEGMENT ANALYSIS
- OTHER CUISINE TYPES
- MARKET FORECAST FIGURE
- SEGMENT ANALYSIS
- CHINESE
ETHNIC FOOD MARKET BY FOOD TYPE
- VEGETARIAN/VEGAN ETHNIC FOODS
- MARKET FORECAST FIGURE
- SEGMENT ANALYSIS
- NON-VEGETARIAN ETHNIC FOODS
- MARKET FORECAST FIGURE
- SEGMENT ANALYSIS
- VEGETARIAN/VEGAN ETHNIC FOODS
ETHNIC FOOD MARKET BY PRODUCT TYPE
- READY-TO-EAT MEALS
- MARKET FORECAST FIGURE
- SEGMENT ANALYSIS
- FROZEN FOOD
- MARKET FORECAST FIGURE
- SEGMENT ANALYSIS
- PACKAGED FOOD
- MARKET FORECAST FIGURE
- SEGMENT ANALYSIS
- CANNED FOOD
- MARKET FORECAST FIGURE
- SEGMENT ANALYSIS
- DRIED MEALS
- MARKET FORECAST FIGURE
- SEGMENT ANALYSIS
- OTHER PRODUCT TYPES
- MARKET FORECAST FIGURE
- SEGMENT ANALYSIS
- READY-TO-EAT MEALS
ETHNIC FOOD MARKET BY DISTRIBUTION CHANNEL
- SUPERMARKETS / HYPERMARKETS
- MARKET FORECAST FIGURE
- SEGMENT ANALYSIS
- CONVENIENCE / GROCERY STORES
- MARKET FORECAST FIGURE
- SEGMENT ANALYSIS
- SPECIALTY STORES
- MARKET FORECAST FIGURE
- SEGMENT ANALYSIS
- ONLINE RETAIL
- MARKET FORECAST FIGURE
- SEGMENT ANALYSIS
- OTHER DISTRIBUTION CHANNELS
- MARKET FORECAST FIGURE
- SEGMENT ANALYSIS
- SUPERMARKETS / HYPERMARKETS
GEOGRAPHICAL ANALYSIS
- ASIA-PACIFIC
- MARKET SIZE & ESTIMATES
- ASIA-PACIFIC MARKET DRIVERS
- ASIA-PACIFIC MARKET CHALLENGES
- KEY PLAYERS IN ASIA-PACIFIC ETHNIC FOOD MARKET
- COUNTRY ANALYSIS
- CHINA
- CHINA MARKET SIZE & OPPORTUNITIES
- INDIA
- INDIA MARKET SIZE & OPPORTUNITIES
- JAPAN
- JAPAN MARKET SIZE & OPPORTUNITIES
- AUSTRALIA & NEW ZEALAND
- AUSTRALIA & NEW ZEALAND MARKET SIZE & OPPORTUNITIES
- SOUTH KOREA
- SOUTH KOREA MARKET SIZE & OPPORTUNITIES
- THAILAND
- THAILAND MARKET SIZE & OPPORTUNITIES
- INDONESIA
- INDONESIA MARKET SIZE & OPPORTUNITIES
- VIETNAM
- VIETNAM MARKET SIZE & OPPORTUNITIES
- REST OF ASIA-PACIFIC
- REST OF ASIA-PACIFIC MARKET SIZE & OPPORTUNITIES
- CHINA
- ASIA-PACIFIC
COMPETITIVE LANDSCAPE
- KEY STRATEGIC DEVELOPMENTS
- MERGERS & ACQUISITIONS
- PRODUCT LAUNCHES & DEVELOPMENTS
- PARTNERSHIPS & AGREEMENTS
- BUSINESS EXPANSIONS & DIVESTITURES
- COMPANY PROFILES
- AJINOMOTO CO INC
- COMPANY OVERVIEW
- PRODUCTS
- STRENGTHS & CHALLENGES
- ARYZTA AG
- COMPANY OVERVIEW
- PRODUCTS
- STRENGTHS & CHALLENGES
- ASSOCIATED BRITISH FOODS PLC
- COMPANY OVERVIEW
- PRODUCTS
- STRENGTHS & CHALLENGES
- CAPITAL FOODS LTD
- COMPANY OVERVIEW
- PRODUCTS
- STRENGTHS & CHALLENGES
- CONAGRA BRANDS INC
- COMPANY OVERVIEW
- PRODUCTS
- STRENGTHS & CHALLENGES
- GENERAL MILLS INC
- COMPANY OVERVIEW
- PRODUCTS
- STRENGTHS & CHALLENGES
- GRACEKENNEDY LTD
- COMPANY OVERVIEW
- PRODUCTS
- STRENGTHS & CHALLENGES
- HALWANI BROS
- COMPANY OVERVIEW
- PRODUCTS
- STRENGTHS & CHALLENGES
- HUY FONG FOODS INC
- COMPANY OVERVIEW
- PRODUCTS
- STRENGTHS & CHALLENGES
- ITC LIMITED
- COMPANY OVERVIEW
- PRODUCTS
- STRENGTHS & CHALLENGES
- MCCORMICK & COMPANY INC
- COMPANY OVERVIEW
- PRODUCTS
- STRENGTHS & CHALLENGES
- NESTLÉ SA
- COMPANY OVERVIEW
- PRODUCTS
- STRENGTHS & CHALLENGES
- ORKLA ASA
- COMPANY OVERVIEW
- PRODUCTS
- STRENGTHS & CHALLENGES
- PAULIG LTD
- COMPANY OVERVIEW
- PRODUCTS
- STRENGTHS & CHALLENGES
- TAI PEI FOODS
- COMPANY OVERVIEW
- PRODUCTS
- STRENGTHS & CHALLENGES
- TATA CONSUMER PRODUCTS
- COMPANY OVERVIEW
- PRODUCTS
- STRENGTHS & CHALLENGES
- THE HAIN CELESTIAL GROUP
- COMPANY OVERVIEW
- PRODUCTS
- STRENGTHS & CHALLENGES
- YEO’S GROUP
- COMPANY OVERVIEW
- PRODUCTS
- STRENGTHS & CHALLENGES
- AJINOMOTO CO INC
- KEY STRATEGIC DEVELOPMENTS
LIST OF TABLES
TABLE 1: MARKET SNAPSHOT – ETHNIC FOOD
TABLE 2: MARKET BY CUISINE TYPE, HISTORICAL YEARS, 2018-2023 (IN $ MILLION)
TABLE 3: MARKET BY CUISINE TYPE, FORECAST YEARS, 2025-2032 (IN $ MILLION)
TABLE 4: MARKET BY FOOD TYPE, HISTORICAL YEARS, 2018-2023 (IN $ MILLION)
TABLE 5: MARKET BY FOOD TYPE, FORECAST YEARS, 2025-2032 (IN $ MILLION)
TABLE 6: MARKET BY PRODUCT TYPE, HISTORICAL YEARS, 2018-2023 (IN $ MILLION)
TABLE 7: MARKET BY PRODUCT TYPE, FORECAST YEARS, 2025-2032 (IN $ MILLION)
TABLE 8: MARKET BY DISTRIBUTION CHANNEL, HISTORICAL YEARS, 2018-2023 (IN $ MILLION)
TABLE 9: MARKET BY DISTRIBUTION CHANNEL, FORECAST YEARS, 2025-2032 (IN $ MILLION)
TABLE 10: MARKET BY GEOGRAPHICAL ANALYSIS, HISTORICAL YEARS, 2018-2023 (IN $ MILLION)
TABLE 11: MARKET BY GEOGRAPHICAL ANALYSIS, FORECAST YEARS, 2025-2032 (IN $ MILLION)
TABLE 12: ASIA-PACIFIC MARKET, COUNTRY ANALYSIS, HISTORICAL YEARS, 2018-2023 (IN $ MILLION)
TABLE 13: ASIA-PACIFIC MARKET, COUNTRY ANALYSIS, FORECAST YEARS, 2025-2032 (IN $ MILLION)
TABLE 14: KEY PLAYERS OPERATING IN THE ASIA-PACIFIC MARKET
TABLE 15: LIST OF MERGERS & ACQUISITIONS
TABLE 16: LIST OF PRODUCT LAUNCHES & DEVELOPMENTS
TABLE 17: LIST OF PARTNERSHIPS & AGREEMENTS
TABLE 18: LIST OF BUSINESS EXPANSIONS & DIVESTITURES
LIST OF FIGURES
FIGURE 1: KEY MARKET TRENDS
FIGURE 2: PORTER’S FIVE FORCES ANALYSIS
FIGURE 3: GROWTH PROSPECT MAPPING FOR ASIA-PACIFIC
FIGURE 4: MARKET MATURITY ANALYSIS
FIGURE 5: MARKET CONCENTRATION ANALYSIS
FIGURE 6: VALUE CHAIN ANALYSIS
FIGURE 7: KEY BUYING CRITERIA
FIGURE 8: SEGMENT GROWTH POTENTIAL, BY CUISINE TYPE, IN 2024
FIGURE 9: CHINESE MARKET SIZE, 2025–2032 (IN $ MILLION)
FIGURE 10: JAPANESE MARKET SIZE, 2025–2032 (IN $ MILLION)
FIGURE 11: INDIAN MARKET SIZE, 2025–2032 (IN $ MILLION)
FIGURE 12: THAI MARKET SIZE, 2025–2032 (IN $ MILLION)
FIGURE 13: KOREAN MARKET SIZE, 2025–2032 (IN $ MILLION)
FIGURE 14: MEXICAN MARKET SIZE, 2025–2032 (IN $ MILLION)
FIGURE 15: BRAZILIAN MARKET SIZE, 2025–2032 (IN $ MILLION)
FIGURE 16: LEBANESE MARKET SIZE, 2025–2032 (IN $ MILLION)
FIGURE 17: OTHER CUISINE TYPES MARKET SIZE, 2025–2032 (IN $ MILLION)
FIGURE 18: SEGMENT GROWTH POTENTIAL, BY FOOD TYPE, IN 2024
FIGURE 19: VEGETARIAN/VEGAN ETHNIC FOODS MARKET SIZE, 2025–2032 (IN $ MILLION)
FIGURE 20: NON-VEGETARIAN ETHNIC FOODS MARKET SIZE, 2025–2032 (IN $ MILLION)
FIGURE 21: SEGMENT GROWTH POTENTIAL, BY PRODUCT TYPE, IN 2024
FIGURE 22: READY-TO-EAT MEALS MARKET SIZE, 2025–2032 (IN $ MILLION)
FIGURE 23: FROZEN FOOD MARKET SIZE, 2025–2032 (IN $ MILLION)
FIGURE 24: PACKAGED FOOD MARKET SIZE, 2025–2032 (IN $ MILLION)
FIGURE 25: CANNED FOOD MARKET SIZE, 2025–2032 (IN $ MILLION)
FIGURE 26: DRIED MEALS MARKET SIZE, 2025–2032 (IN $ MILLION)
FIGURE 27: OTHER FOOD TYPES MARKET SIZE, 2025–2032 (IN $ MILLION)
FIGURE 28: SEGMENT GROWTH POTENTIAL, BY DISTRIBUTION CHANNEL, IN 2024
FIGURE 29: SUPERMARKETS / HYPERMARKETS MARKET SIZE, 2025–2032 (IN $ MILLION)
FIGURE 30: CONVENIENCE / GROCERY STORES MARKET SIZE, 2025–2032 (IN $ MILLION)
FIGURE 31: SPECIALTY STORES MARKET SIZE, 2025–2032 (IN $ MILLION)
FIGURE 32: ONLINE RETAIL MARKET SIZE, 2025–2032 (IN $ MILLION)
FIGURE 33: OTHER DISTRIBUTION CHANNELS MARKET SIZE, 2025–2032 (IN $ MILLION)
FIGURE 34: ASIA-PACIFIC ETHNIC FOOD MARKET, COUNTRY OUTLOOK, 2024 & 2032 (IN %)
FIGURE 35: CHINA MARKET SIZE, 2025–2032 (IN $ MILLION)
FIGURE 36: INDIA MARKET SIZE, 2025–2032 (IN $ MILLION)
FIGURE 37: JAPAN MARKET SIZE, 2025–2032 (IN $ MILLION)
FIGURE 38: AUSTRALIA & NEW ZEALAND MARKET SIZE, 2025–2032 (IN $ MILLION)
FIGURE 39: SOUTH KOREA MARKET SIZE, 2025–2032 (IN $ MILLION)
FIGURE 40: THAILAND MARKET SIZE, 2025–2032 (IN $ MILLION)
FIGURE 41: INDONESIA MARKET SIZE, 2025–2032 (IN $ MILLION)
FIGURE 42: VIETNAM MARKET SIZE, 2025–2032 (IN $ MILLION)
FIGURE 43: REST OF ASIA-PACIFIC MARKET SIZE, 2025–2032 (IN $ MILLION)
FAQ’s
RELATED REPORTS
-

UNITED STATES AI-DRIVEN CLOUD MIGRATION SERVICES MARKET FORECAST 2026-2034
-

UNITED KINGDOM AI-DRIVEN CLOUD MIGRATION SERVICES MARKET FORECAST 2026-2034
-

UNITED ARAB EMIRATES AI-DRIVEN CLOUD MIGRATION SERVICES MARKET FORECAST 2026-2034
-

SOUTH KOREA AI-DRIVEN CLOUD MIGRATION SERVICES MARKET FORECAST 2026-2034
-

SINGAPORE AI-DRIVEN CLOUD MIGRATION SERVICES MARKET FORECAST 2026-2034
-

SAUDI ARABIA AI-DRIVEN CLOUD MIGRATION SERVICES MARKET FORECAST 2026-2034
-

AUSTRALIA AI-DRIVEN CLOUD MIGRATION SERVICES MARKET FORECAST 2026-2034
-

JAPAN AI-DRIVEN CLOUD MIGRATION SERVICES MARKET FORECAST 2026-2034
-

INDIA AI-DRIVEN CLOUD MIGRATION SERVICES MARKET FORECAST 2026-2034
-

CHINA AI-DRIVEN CLOUD MIGRATION SERVICES MARKET FORECAST 2026-2034