
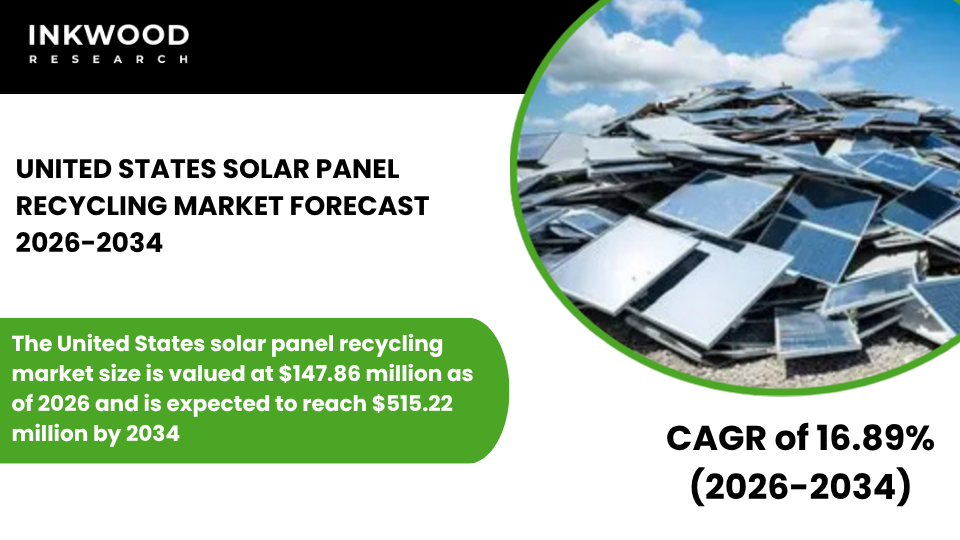
UNITED STATES SOLAR PANEL RECYCLING MARKET FORECAST 2026-2034
SCOPE OF THE REPORT
United States Solar Panel Recycling Market by Process (Thermal, Mechanical, Chemical, Laser) Market by Type (Silicon-Based C-Si, Thin-Film, Other Types) Market by Shelf Life (Early Loss, Normal Loss) Market by Material/Recoverable Components (Glass, Aluminum, Copper, Plastic, Silver, PV Silicon, Other Materials/Recoverable Components), by Geography
UNITED STATES SOLAR PANEL RECYCLING MARKET OVERVIEW
The United States solar panel recycling market size is valued at $147.86 million as of 2026 and is expected to reach $515.22 million by 2034, progressing with a CAGR of 16.89% during the forecast years, 2026-2034.
The United States solar panel recycling market represents an emerging sector characterized by significant regional variation and evolving regulatory frameworks that reflect the country’s decentralized approach to environmental policy and waste management. Rapid growth in solar installations over the past decade has created a substantial future pipeline of photovoltaic PV panels that will require proper disposal and material recovery as they reach their operational shelf life.
However, the market currently operates in an early growth stage, with landfill disposal remaining common practice due to limited federal-level recycling mandates and the absence of comprehensive national standards for solar waste management. Consequently, state-level regulations and extended producer responsibility programs are driving market development in progressive jurisdictions like California and Washington, while other states lag considerably in policy implementation.
Private sector participation has emerged as a critical growth driver, with specialized recycling startups, established waste management companies, and solar manufacturers investing in technology development and pilot projects across various regions. California leads the nation in solar panel recycling initiatives, having enacted groundbreaking legislation that requires manufacturers to establish end-of-life management programs for photovoltaic systems sold within the state.
This regulatory framework creates accountability throughout the product lifecycle while ensuring funding mechanisms exist for proper panel disposal and material recovery. Similarly, Washington has implemented extended producer responsibility requirements that mandate recycling infrastructure development and collection system establishment by solar manufacturers and importers.
These state-level actions demonstrate how regional policy innovation can accelerate market development despite federal regulatory gaps. Moreover, corporate sustainability commitments among major solar installers and utilities are encouraging voluntary recycling adoption beyond legal requirements, as companies recognize the reputational and environmental benefits of responsible waste management practices.
To Know More About This Report, Request a Free Sample Copy
The rising value of recovered metals, particularly silver and copper, has improved the economic viability of solar panel recycling operations by offsetting processing costs through material sales revenue. According to the U.S. Department of Energy, ongoing research initiatives are exploring advanced recycling technologies that maximize recovery rates while minimizing processing expenses, creating pathways toward economically sustainable operations.
Nevertheless, significant challenges persist across the market, with high transportation costs stemming from the geographic dispersion of solar assets creating substantial logistical barriers for collection and consolidation. The absence of uniform federal regulations limits market scale by preventing economies of scale that would emerge from standardized collection systems and processing requirements nationwide.
Furthermore, recycling costs often exceed landfill disposal fees in many jurisdictions, creating economic disincentives that discourage proper end-of-life management absent regulatory mandates or corporate commitments. Low awareness among small installers and consumers restricts collection rates significantly, as many solar system owners remain unaware of recycling options or end-of-life responsibilities for their photovoltaic installations.
Educational initiatives and outreach programs are gradually improving awareness levels, though substantial gaps remain, particularly in residential segments where individual panel volumes may not justify specialized collection services. The emergence of specialized solar panel recycling startups has introduced innovative business models and processing technologies specifically designed for American market conditions and panel types.
These companies typically focus on mechanical and hybrid recycling processes that balance capital requirements with material recovery efficiency, creating scalable solutions suitable for diverse facility sizes and regional markets. Expansion of take-back programs by major solar manufacturers represents a promising trend, with companies like First Solar establishing comprehensive collection networks that accept panels regardless of origin or age. These voluntary initiatives demonstrate industry leadership while creating competitive differentiation in increasingly sustainability-conscious markets.
Additionally, growing interest in policy harmonization at the federal level suggests potential future regulatory developments that could create nationwide standards for solar panel recycling, thereby accelerating infrastructure investments and market consolidation. Industry associations and environmental advocacy groups are actively engaging policymakers to develop federal frameworks that balance economic considerations with environmental protection objectives, potentially transforming market dynamics substantially within the forecast period.
Texas, Arizona, and North Carolina represent additional key markets due to substantial utility-scale solar installations that will generate significant recycling volumes as early installations approach retirement. These states currently lack comprehensive recycling regulations, creating opportunities for private sector innovation and voluntary program development that could influence future policy directions.
Meanwhile, manufacturers are increasingly incorporating design-for-recycling principles into new panel development, simplifying future material recovery while reducing processing costs and improving recovered material quality. This proactive approach recognizes that panels manufactured today will require recycling in 25-30 years, making current design decisions critical for future circular economy success.
The United States solar panel recycling market is segmented into process, type, shelf life, and material/recoverable components. The process segment is further categorized into thermal, mechanical, chemical, and laser.
Chemical recycling processes are gaining traction in the United States market, offering superior material recovery rates and higher purity outputs compared to purely mechanical approaches, particularly for valuable semiconductor materials and precious metals. This technique employs specialized solvents and reagents to selectively dissolve and separate different panel components, enabling recovery of high-purity silicon, silver, copper, and other valuable materials suitable for direct reuse in manufacturing applications.
The process typically begins with mechanical pre-treatment that removes frames and junction boxes, followed by chemical treatment that dissolves adhesives and encapsulants, releasing photovoltaic cells for further processing. Advanced chemical methods can achieve recovery rates exceeding 95% for critical materials, substantially higher than mechanical-only approaches that typically recover 80-85% of total material value.
Consequently, chemical recycling facilities can generate higher revenue per panel processed, improving overall economics despite greater capital and operational expenses compared to simpler mechanical systems. Environmental considerations around chemical recycling have driven innovation toward closed-loop solvent systems that minimize waste generation and chemical consumption throughout processing operations. These advanced systems recycle and purify solvents continuously, reducing environmental impact while lowering operating costs through decreased reagent purchasing requirements.
Furthermore, chemical processes enable the separation of materials that are difficult or impossible to segregate mechanically, including thin metal layers and semiconductor compounds embedded within cell structures. Regulatory compliance remains paramount, as chemical recycling facilities must meet stringent permitting requirements for hazardous material handling, wastewater treatment, and air emissions control.
Nevertheless, American companies are investing substantially in chemical recycling capacity, recognizing that superior material quality and recovery rates justify additional compliance and operational complexities. This segment supports overall market expansion by providing technology pathways that maximize resource recovery and economic returns, creating business models capable of competing with landfill disposal costs while delivering environmental benefits and supporting circular economy objectives across the solar energy sector.
Some of the top players operating in the United States solar panel recycling market include First Solar Inc, Envela Corporation, Canadian Solar Inc, Silrec Corporation, etc.
Envela Corporation operates as a diversified specialty materials and precious metals processor, providing comprehensive recycling services for electronic waste, including photovoltaic panels, through its specialized business units. The company leverages advanced metallurgical expertise to extract valuable materials from solar panels, focusing particularly on silver, copper, and other precious metals that represent significant economic value within decommissioned units.
Envela’s processing capabilities encompass mechanical dismantling, chemical separation, and metal refining operations that maximize recovery rates while meeting stringent environmental standards throughout the material recovery process. The company serves solar manufacturers, utilities, demolition contractors, and waste management organizations seeking compliant, economically viable solutions for photovoltaic waste streams across the United States.
Additionally, Envela maintains strategic partnerships with major electronics recyclers and waste processors, creating comprehensive collection networks that improve accessibility for customers nationwide while enabling efficient material consolidation before processing. This integrated approach positions the company as a key player in America’s emerging solar panel recycling sector, combining technical capabilities with market reach that supports industry transition toward sustainable end-of-life management practices.
REPORT SYNOPSIS
| REPORT SCOPE | DETAILS |
|---|---|
| Market Forecast Years | 2026-2034 |
| Base Year | 2025 |
| Market Historical Years | 2022-2024 |
| Forecast Units | Revenue ($ Million) |
| Segments Analyzed | Process, Type, Shelf Life, and Material / Recoverable Components |
| Country Analyzed | United States |
| Companies Analyzed | Aurubis AG, Canadian Solar Inc, Envela Corporation, First Solar Inc, Hanwha Group, SiC Processing GmbH, Silrec Corporation |
TABLE OF CONTENTS
RESEARCH SCOPE & METHODOLOGY
- STUDY OBJECTIVES
- METHODOLOGY
- ASSUMPTIONS & LIMITATIONS
EXECUTIVE SUMMARY
- MARKET SIZE & FORECAST
- MARKET OVERVIEW
- SCOPE OF STUDY
- CRISIS SCENARIO ANALYSIS
- MAJOR MARKET FINDINGS
- THE UNITED STATES SOLAR PANEL RECYCLING MARKET IS IN AN EARLY GROWTH STAGE WITH SIGNIFICANT REGIONAL VARIATION
- CALIFORNIA AND WASHINGTON LEAD IN REGULATORY INITIATIVES FOR SOLAR WASTE MANAGEMENT
- LANDFILL DISPOSAL REMAINS COMMON DUE TO LIMITED FEDERAL-LEVEL RECYCLING MANDATES
- PRIVATE SECTOR PARTICIPATION IS DRIVING TECHNOLOGY DEVELOPMENT AND PILOT PROJECTS
MARKET DYNAMICS
- KEY DRIVERS
- RAPID GROWTH IN SOLAR INSTALLATIONS IS CREATING A FUTURE PIPELINE OF END-OF-LIFE PANELS
- STATE-LEVEL REGULATIONS AND EXTENDED PRODUCER RESPONSIBILITY PROGRAMS SUPPORT MARKET DEVELOPMENT
- CORPORATE SUSTAINABILITY COMMITMENTS ARE ENCOURAGING VOLUNTARY RECYCLING
- RISING VALUE OF RECOVERED METALS IMPROVES ECONOMIC VIABILITY
- KEY RESTRAINTS
- ABSENCE OF UNIFORM FEDERAL REGULATIONS LIMITS MARKET SCALE
- HIGH TRANSPORTATION COSTS DUE TO GEOGRAPHIC DISPERSION OF SOLAR ASSETS
- LOW AWARENESS AMONG SMALL INSTALLERS AND CONSUMERS RESTRICTS COLLECTION RATES
- RECYCLING COSTS OFTEN EXCEED LANDFILL DISPOSAL FEES
- KEY DRIVERS
KEY ANALYTICS
- KEY MARKET TRENDS
- EMERGENCE OF SPECIALIZED SOLAR PANEL RECYCLING STARTUPS
- INCREASING USE OF MECHANICAL AND HYBRID RECYCLING PROCESSES
- EXPANSION OF TAKE-BACK PROGRAMS BY SOLAR MANUFACTURERS
- GROWING INTEREST IN POLICY HARMONIZATION AT THE FEDERAL LEVEL
- PORTER’S FIVE FORCES ANALYSIS
- BUYERS POWER
- SUPPLIERS POWER
- SUBSTITUTION
- NEW ENTRANTS
- INDUSTRY RIVALRY
- GROWTH PROSPECT MAPPING
- GROWTH PROSPECT MAPPING FOR THE UNITED STATES
- MARKET MATURITY ANALYSIS
- MARKET CONCENTRATION ANALYSIS
- VALUE CHAIN ANALYSIS
- RAW MATERIAL SUPPLY
- COLLECTION AND LOGISTICS
- DISMANTLING AND SHREDDING
- MATERIAL SORTING
- CHEMICAL PROCESSING
- RECOVERED MATERIAL SUPPLY
- KEY BUYING CRITERIA
- RECYCLING EFFICIENCY
- COST COMPETITIVENESS
- ENVIRONMENTAL COMPLIANCE
- TECHNOLOGICAL ADVANCEMENT
- REGULATORY FRAMEWORK
- KEY MARKET TRENDS
SOLAR PANEL RECYCLING MARKET BY PROCESS
- THERMAL
- MARKET FORECAST FIGURE
- SEGMENT ANALYSIS
- MECHANICAL
- MARKET FORECAST FIGURE
- SEGMENT ANALYSIS
- CHEMICAL
- MARKET FORECAST FIGURE
- SEGMENT ANALYSIS
- LASER
- MARKET FORECAST FIGURE
- SEGMENT ANALYSIS
- THERMAL
SOLAR PANEL RECYCLING MARKET BY TYPE
- SILICON-BASED (C-SI)
- MARKET FORECAST FIGURE
- SEGMENT ANALYSIS
- THIN-FILM
- MARKET FORECAST FIGURE
- SEGMENT ANALYSIS
- OTHER TYPES
- MARKET FORECAST FIGURE
- SEGMENT ANALYSIS
- SILICON-BASED (C-SI)
SOLAR PANEL RECYCLING MARKET BY SHELF LIFE
- EARLY LOSS
- MARKET FORECAST FIGURE
- SEGMENT ANALYSIS
- NORMAL LOSS
- MARKET FORECAST FIGURE
- SEGMENT ANALYSIS
- EARLY LOSS
SOLAR PANEL RECYCLING MARKET BY MATERIAL / RECOVERABLE COMPONENTS
- GLASS
- MARKET FORECAST FIGURE
- SEGMENT ANALYSIS
- ALUMINUM
- MARKET FORECAST FIGURE
- SEGMENT ANALYSIS
- COPPER
- MARKET FORECAST FIGURE
- SEGMENT ANALYSIS
- PLASTIC
- MARKET FORECAST FIGURE
- SEGMENT ANALYSIS
- SILVER
- MARKET FORECAST FIGURE
- SEGMENT ANALYSIS
- PV SILICON
- MARKET FORECAST FIGURE
- SEGMENT ANALYSIS
- OTHER MATERIALS / RECOVERABLE COMPONENTS
- MARKET FORECAST FIGURE
- SEGMENT ANALYSIS
- GLASS
COMPETITIVE LANDSCAPE
- KEY STRATEGIC DEVELOPMENTS
- MERGERS & ACQUISITIONS
- PRODUCT LAUNCHES & DEVELOPMENTS
- PARTNERSHIPS & AGREEMENTS
- BUSINESS EXPANSIONS & DIVESTITURES
- COMPANY PROFILES
- AURUBIS AG
- COMPANY OVERVIEW
- PRODUCTS / SERVICES LIST
- STRENGTHS & CHALLENGES
- CANADIAN SOLAR INC
- COMPANY OVERVIEW
- PRODUCTS / SERVICES LIST
- STRENGTHS & CHALLENGES
- ENVELA CORPORATION
- COMPANY OVERVIEW
- PRODUCTS / SERVICES LIST
- STRENGTHS & CHALLENGES
- FIRST SOLAR INC
- COMPANY OVERVIEW
- PRODUCTS / SERVICES LIST
- STRENGTHS & CHALLENGES
- HANWHA GROUP
- COMPANY OVERVIEW
- PRODUCTS / SERVICES LIST
- STRENGTHS & CHALLENGES
- SIC PROCESSING GMBH
- COMPANY OVERVIEW
- PRODUCTS / SERVICES LIST
- STRENGTHS & CHALLENGES
- SILREC CORPORATION
- COMPANY OVERVIEW
- PRODUCTS / SERVICES LIST
- STRENGTHS & CHALLENGES
- AURUBIS AG
- KEY STRATEGIC DEVELOPMENTS
LIST OF TABLES
TABLE 1: MARKET SNAPSHOT – SOLAR PANEL RECYCLING
TABLE 2: SOLAR PANEL RECYCLING MARKET REGULATORY FRAMEWORK
TABLE 3: MARKET BY PROCESS, HISTORICAL YEARS, 2022-2024 (IN $ MILLION)
TABLE 4: MARKET BY PROCESS, FORECAST YEARS, 2026-2034 (IN $ MILLION)
TABLE 5: MARKET BY TYPE, HISTORICAL YEARS, 2022-2024 (IN $ MILLION)
TABLE 6: MARKET BY TYPE, FORECAST YEARS, 2026-2034 (IN $ MILLION)
TABLE 7: MARKET BY SHELF LIFE, HISTORICAL YEARS, 2022-2024 (IN $ MILLION)
TABLE 8: MARKET BY SHELF LIFE, FORECAST YEARS, 2026-2034 (IN $ MILLION)
TABLE 9: MARKET BY MATERIAL / RECOVERABLE COMPONENTS, HISTORICAL YEARS, 2022-2024 (IN $ MILLION)
TABLE 10: MARKET BY MATERIAL / RECOVERABLE COMPONENTS, FORECAST YEARS, 2026-2034 (IN $ MILLION)
TABLE 11: KEY PLAYERS OPERATING IN THE UNITED STATES MARKET
TABLE 12: LIST OF MERGERS & ACQUISITIONS
TABLE 13: LIST OF PRODUCT LAUNCHES & DEVELOPMENTS
TABLE 14: LIST OF PARTNERSHIPS & AGREEMENTS
TABLE 15: LIST OF BUSINESS EXPANSIONS & DIVESTITURES
LIST OF FIGURES
FIGURE 1: KEY MARKET TRENDS
FIGURE 2: PORTER’S FIVE FORCES ANALYSIS
FIGURE 3: GROWTH PROSPECT MAPPING FOR THE UNITED STATES
FIGURE 4: MARKET MATURITY ANALYSIS
FIGURE 5: MARKET CONCENTRATION ANALYSIS
FIGURE 6: VALUE CHAIN ANALYSIS
FIGURE 7: KEY BUYING CRITERIA
FIGURE 8: SEGMENT GROWTH POTENTIAL, BY PROCESS, IN 2025
FIGURE 9: THERMAL MARKET SIZE, 2026-2034 (IN $ MILLION)
FIGURE 10: MECHANICAL MARKET SIZE, 2026-2034 (IN $ MILLION)
FIGURE 11: CHEMICAL MARKET SIZE, 2026-2034 (IN $ MILLION)
FIGURE 12: LASER MARKET SIZE, 2026-2034 (IN $ MILLION)
FIGURE 13: SEGMENT GROWTH POTENTIAL, BY TYPE, IN 2025
FIGURE 14: SILICON-BASED (C-SI) MARKET SIZE, 2026-2034 (IN $ MILLION)
FIGURE 15: THIN-FILM MARKET SIZE, 2026-2034 (IN $ MILLION)
FIGURE 16: OTHER TYPES MARKET SIZE, 2026-2034 (IN $ MILLION)
FIGURE 17: SEGMENT GROWTH POTENTIAL, BY SHELF LIFE, IN 2025
FIGURE 18: EARLY LOSS MARKET SIZE, 2026-2034 (IN $ MILLION)
FIGURE 19: NORMAL LOSS MARKET SIZE, 2026-2034 (IN $ MILLION)
FIGURE 20: SEGMENT GROWTH POTENTIAL, BY MATERIAL / RECOVERABLE COMPONENTS, IN 2025
FIGURE 21: GLASS MARKET SIZE, 2026-2034 (IN $ MILLION)
FIGURE 22: ALUMINUM MARKET SIZE, 2026-2034 (IN $ MILLION)
FIGURE 23: COPPER MARKET SIZE, 2026-2034 (IN $ MILLION)
FIGURE 24: PLASTIC MARKET SIZE, 2026-2034 (IN $ MILLION)
FIGURE 25: SILVER MARKET SIZE, 2026-2034 (IN $ MILLION)
FIGURE 26: PV SILICON MARKET SIZE, 2026-2034 (IN $ MILLION)
FIGURE 27: OTHER MATERIALS / RECOVERABLE COMPONENTS MARKET SIZE, 2026-2034 (IN $ MILLION)
FAQ’s
RELATED REPORTS
-

UNITED STATES AI-DRIVEN CLOUD MIGRATION SERVICES MARKET FORECAST 2026-2034
-

UNITED KINGDOM AI-DRIVEN CLOUD MIGRATION SERVICES MARKET FORECAST 2026-2034
-

UNITED ARAB EMIRATES AI-DRIVEN CLOUD MIGRATION SERVICES MARKET FORECAST 2026-2034
-

SOUTH KOREA AI-DRIVEN CLOUD MIGRATION SERVICES MARKET FORECAST 2026-2034
-

SINGAPORE AI-DRIVEN CLOUD MIGRATION SERVICES MARKET FORECAST 2026-2034
-

SAUDI ARABIA AI-DRIVEN CLOUD MIGRATION SERVICES MARKET FORECAST 2026-2034
-

AUSTRALIA AI-DRIVEN CLOUD MIGRATION SERVICES MARKET FORECAST 2026-2034
-

JAPAN AI-DRIVEN CLOUD MIGRATION SERVICES MARKET FORECAST 2026-2034
-

INDIA AI-DRIVEN CLOUD MIGRATION SERVICES MARKET FORECAST 2026-2034
-

CHINA AI-DRIVEN CLOUD MIGRATION SERVICES MARKET FORECAST 2026-2034