United States Liquefied Natural Gas (LNG) Market by LNG Infrastructure (LNG Liquefaction Plants, LNG Regasification Facilities, LNG Shipping & Transportation) Market by Application (Transportation, Industrial Feedstock, Power Generation, Other Applications) Market by Mode of Supply (Truck, Transshipment and Bunkering, Pipeline and Rail)
UNITED STATES LIQUEFIED NATURAL GAS (LNG) MARKET OVERVIEW
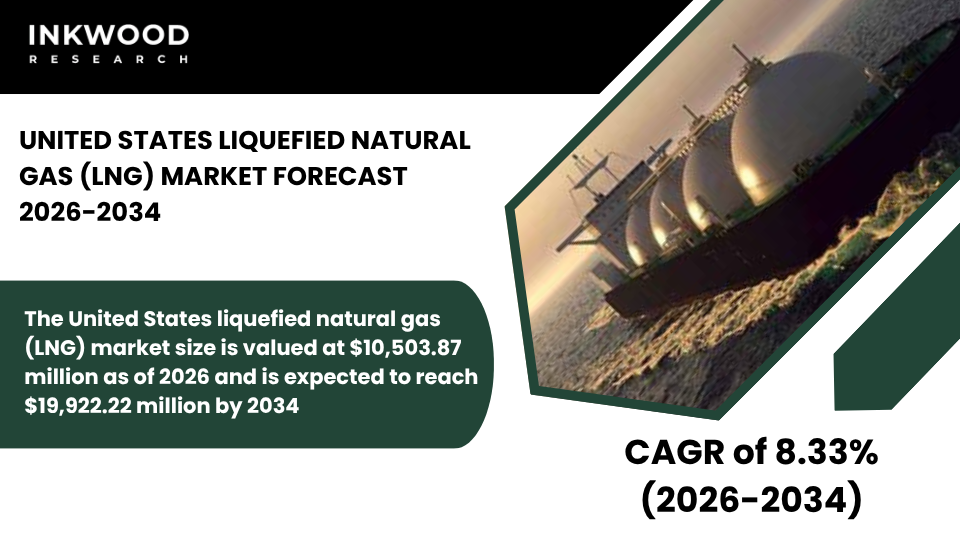
The United States liquefied natural gas (LNG) market size is valued at $10,503.87 million as of 2026 and is expected to reach $19,922.22 million by 2034, progressing with a CAGR of 8.33% during the forecast years, 2026-2034.
The United States has rapidly ascended to become the world’s leading liquefied natural gas exporter through an unprecedented buildout of export infrastructure that capitalizes on abundant shale gas production from prolific basins across Texas, Louisiana, and Pennsylvania. This transformation reflects decades of technological innovation in hydraulic fracturing and horizontal drilling techniques that opened up massive unconventional gas resources, fundamentally altering global energy trade patterns.
According to the U.S. Energy Information Administration, American LNG exports continue to set records as new liquefaction capacity comes online, and existing facilities optimize operations to maximize throughput. Consequently, the United States now serves as a critical supplier to both European and Asian markets seeking to diversify their energy sources and enhance supply security amid evolving geopolitical dynamics.
Export infrastructure development concentrates along the Gulf Coast, where proximity to major shale production regions minimizes pipeline transportation costs, while deepwater ports accommodate the world’s largest LNG carriers. Liquefaction facilities in Louisiana and Texas process enormous gas volumes, converting pipeline-quality natural gas into cryogenic liquid suitable for international shipping.
Furthermore, these terminals benefit from well-established pipeline networks, marine infrastructure, and industrial support services that enable efficient operations and rapid project execution. The concentration of facilities creates synergies through shared labor pools, equipment suppliers, and technical expertise that reduce development risks and operational costs compared to more remote locations.
To Know More About This Report, Request a Free Sample Copy
International demand dynamics strongly influence the United States liquefied natural gas export patterns as European buyers increasingly replace Russian pipeline supplies with American cargoes, while Asian markets maintain steady purchases to fuel economic growth. European energy security concerns following geopolitical disruptions accelerated contract negotiations and cargo deliveries, positioning US LNG as a cornerstone of transatlantic energy cooperation.
Meanwhile, traditional Asian buyers in Japan, South Korea, and China continue purchasing substantial volumes to support power generation and industrial applications. This geographic diversification across multiple markets enhances the resilience of US export operations against regional demand fluctuations or market-specific disruptions.
Domestic consumption of liquefied natural gas remains relatively modest compared to export volumes, though power generation represents the primary application within the United States as gas-fired plants provide flexible capacity that complements expanding renewable energy installations. Combined-cycle facilities deliver efficient baseload generation while offering rapid response capabilities during peak demand periods or when intermittent renewables experience production gaps.
Additionally, industrial sectors utilize natural gas extensively for process heat, steam generation, and chemical feedstock applications across manufacturing, refining, and petrochemical operations. Residential and commercial consumers similarly depend on gas distribution networks for space heating, water heating, and cooking applications throughout much of the country.
The shale revolution fundamentally transformed the United States from a prospective LNG importer into the world’s dominant exporter within less than two decades. Abundant feedstock availability from the Permian Basin, Marcellus Shale, and Haynesville formation ensures cost-competitive supply that underpins export economics and long-term contract viability.
According to the U.S. Geological Survey, proven natural gas reserves continue growing as improved recovery techniques and new discoveries expand the resource base supporting sustained production growth. This supply abundance creates pricing advantages that make US LNG competitive globally despite longer shipping distances compared to suppliers closer to Asian markets.
Contract flexibility represents a distinctive competitive advantage for United States liquefied natural gas exports compared to traditional suppliers who historically required destination restrictions and rigid delivery terms. American exporters pioneered more flexible commercial structures that allow buyers to redirect cargoes, participate in portfolio optimization, and respond dynamically to changing market conditions.
These innovative approaches attracted buyers seeking greater commercial flexibility while accelerating project development by enabling diverse customer bases. Furthermore, the flexibility aligns with spot market participation that has become increasingly prevalent as traditional long-term contracting models evolve alongside changing natural gas market dynamics.
Environmental considerations increasingly influence United States liquefied natural gas development as producers and exporters respond to buyer preferences for lower-carbon cargoes that support downstream decarbonization objectives. Operators invest in methane emission reduction programs, electrification of compression equipment, and carbon capture technologies that minimize the greenhouse gas intensity of LNG production.
Additionally, certification programs verify emission performance through third-party audits, enabling premium pricing for differentiated products. These sustainability initiatives position US LNG competitively as global markets prioritize cleaner energy solutions during the transition toward net-zero emissions targets.
The United States liquefied natural gas (LNG) market is segmented into LNG infrastructure, application, and mode of supply. The LNG infrastructure segment is further categorized into LNG liquefaction plants and LNG regasification facilities.
Liquefaction plants thoroughly dominate the United States infrastructure landscape as the country focuses overwhelmingly on export-oriented capacity rather than import facilities or domestic regasification requirements. The Gulf Coast hosts numerous large-scale liquefaction facilities featuring multiple processing trains that collectively handle billions of cubic feet of natural gas daily.
These installations incorporate modular construction techniques and standardized equipment packages that accelerate project execution while maintaining operational reliability essential for satisfying long-term contract obligations. Furthermore, operators continuously pursue efficiency improvements through advanced process controls, equipment upgrades, and operational optimization programs that maximize output while minimizing energy consumption and emissions.
The infrastructure represents tens of billions of dollars in capital investment, creating substantial construction employment during development phases while establishing permanent operational positions that support skilled workforce development across Gulf Coast communities. Additionally, ongoing expansion projects and new facility developments ensure sustained capacity growth that enables the United States to maintain its leadership position in global LNG trade despite growing competition from emerging suppliers.
Some of the top players operating in the United States liquefied natural gas (LNG) market include Cheniere Energy, Venture Global, Sempra Energy, and ExxonMobil, etc.
Cheniere Energy operates as the leading United States liquefied natural gas producer and exporter, headquartered in Houston with major facilities including the Sabine Pass terminal in Louisiana and the Corpus Christi terminal in Texas. The company pioneered the US LNG export industry through early infrastructure development and innovative contract structures that attracted diverse international buyers.
Cheniere’s business model integrates liquefaction services with natural gas procurement and global marketing capabilities, enabling end-to-end value capture from feedstock acquisition through cargo delivery. The company maintains long-term agreements with buyers spanning Europe, Asia, and Latin America while also participating actively in spot markets to optimize facility utilization.
Furthermore, Cheniere pursues expansion opportunities and sustainability initiatives, including carbon capture integration and methane emission reduction programs that enhance the environmental profile of its operations and position the company favorably in increasingly climate-conscious markets.
REPORT SYNOPSIS
| REPORT SCOPE | DETAILS |
|---|---|
| Market Forecast Years | 2026-2034 |
| Base Year | 2025 |
| Market Historical Years | 2022-2024 |
| Forecast Units | Revenue ($ Million) |
| Segments Analyzed | LNG Infrastructure, Application, and Mode of Supply |
| Country Analyzed | The United States |
| Companies Analyzed | Cheniere Energy, ExxonMobil, ConocoPhillips, Shell, TotalEnergies, Venture Global, Sempra Energy |
TABLE OF CONTENTS
RESEARCH SCOPE & METHODOLOGY
- STUDY OBJECTIVES
- METHODOLOGY
- ASSUMPTIONS & LIMITATIONS
EXECUTIVE SUMMARY
- MARKET SIZE, SHARE & ESTIMATES
- MARKET OVERVIEW
- SCOPE OF STUDY
- CRISIS SCENARIO ANALYSIS
- MAJOR MARKET FINDINGS
- THE UNITED STATES MAINTAINS ITS POSITION AS THE WORLD’S LEADING LNG EXPORTER THROUGH ONGOING FACILITY EXPANSIONS
- NEW LIQUEFACTION PROJECTS SIGNIFICANTLY INCREASE EXPORT CAPACITY AND SUPPORT RECORD EXPORT VOLUMES
- US LNG SERVES AS A KEY SUPPLY SOURCE FOR EUROPE AND ASIA AMID GEOPOLITICAL ENERGY SHIFTS
- SHALE GAS PRODUCTION PROVIDES ABUNDANT FEEDSTOCK FOR SUSTAINED LNG EXPORT GROWTH
MARKET DYNAMICS
- KEY DRIVERS
- STRONG INTERNATIONAL DEMAND FOR NATURAL GAS DRIVES EXPANSION OF US LNG EXPORT INFRASTRUCTURE
- POLICY SUPPORT AND FAST-TRACKED PERMITTING ACCELERATE PROJECT DEVELOPMENT AND OPERATIONS
- ABUNDANT SHALE RESOURCES ENSURE COST-COMPETITIVE FEEDSTOCK AVAILABILITY
- FLEXIBLE CONTRACT STRUCTURES ENHANCE US LNG COMPETITIVENESS IN GLOBAL MARKETS
- KEY RESTRAINTS
- POTENTIAL OVERSUPPLY FROM NEW GLOBAL CAPACITY ADDITIONS PRESSURES EXPORT MARGINS
- CONSTRUCTION DELAYS AND COST INCREASES IMPACT PROJECT TIMELINES AND ECONOMICS
- GEOPOLITICAL UNCERTAINTIES AND TRADE DYNAMICS AFFECT LONG-TERM CONTRACTING
- ENVIRONMENTAL AND REGULATORY SCRUTINY CREATES UNCERTAINTY FOR FUTURE DEVELOPMENTS
- KEY DRIVERS
STRATEGIC MARKET ANALYTICS
- KEY MARKET TRENDS
- US LNG EXPORTS CONTINUE TO RESHAPE GLOBAL TRADE FLOWS AND MARKET DYNAMICS
- INCREASED FOCUS ON DESTINATION FLEXIBILITY AND SPOT MARKET PARTICIPATION EMERGES
- INTEGRATION OF LOW-CARBON TECHNOLOGIES SUPPORTS SUSTAINABLE EXPORT GROWTH
- CONSOLIDATION IN THE UPSTREAM SECTOR ENHANCES OPERATIONAL EFFICIENCY AND RESILIENCE
- PORTER’S FIVE FORCES ANALYSIS
- BUYERS POWER
- SUPPLIERS POWER
- SUBSTITUTION
- NEW ENTRANTS
- INDUSTRY RIVALRY
- GROWTH PROSPECT MAPPING
- GROWTH PROSPECT MAPPING FOR THE UNITED STATES
- MARKET MATURITY ANALYSIS
- MARKET CONCENTRATION ANALYSIS
- VALUE CHAIN ANALYSIS
- EXPLORATION AND EXTRACTION
- LIQUEFACTION AND PROCESSING
- STORAGE AND TRANSPORTATION
- EXPORT AND DISTRIBUTION
- MARKETING AND SALES
- AFTER-SALES SERVICES
- KEY BUYING CRITERIA
- PRICE COMPETITIVENESS
- SUPPLY RELIABILITY
- QUALITY STANDARDS
- CONTRACT FLEXIBILITY
- FUTURE PROSPECTS OF LNG IN THE UNITED STATES
- TRADE
- EXPORTS
- IMPORTS
- LNG TERMINALS
- LIST OF LNG EXPORT TERMINALS
- REGULATORY FRAMEWORK AND COMPLIANCE BODIES
- KEY MARKET TRENDS
LIQUEFIED NATURAL GAS (LNG) MARKET BY LNG INFRASTRUCTURE
- LNG LIQUEFACTION PLANTS
- MARKET FORECAST FIGURE
- SEGMENT ANALYSIS
- LNG REGASIFICATION FACILITIES
- MARKET FORECAST FIGURE
- SEGMENT ANALYSIS
- LNG LIQUEFACTION PLANTS
LIQUEFIED NATURAL GAS (LNG) MARKET BY APPLICATION
- TRANSPORTATION
- MARKET FORECAST FIGURE
- SEGMENT ANALYSIS
- INDUSTRIAL FEEDSTOCK
- MARKET FORECAST FIGURE
- SEGMENT ANALYSIS
- POWER GENERATION
- MARKET FORECAST FIGURE
- SEGMENT ANALYSIS
- OTHER APPLICATIONS
- MARKET FORECAST FIGURE
- SEGMENT ANALYSIS
- TRANSPORTATION
LIQUEFIED NATURAL GAS (LNG) MARKET BY MODE OF SUPPLY
- TRUCK
- MARKET FORECAST FIGURE
- SEGMENT ANALYSIS
- TRANSSHIPMENT AND BUNKERING
- MARKET FORECAST FIGURE
- SEGMENT ANALYSIS
- PIPELINE AND RAIL
- MARKET FORECAST FIGURE
- SEGMENT ANALYSIS
- TRUCK
COMPETITIVE LANDSCAPE
- KEY STRATEGIC DEVELOPMENTS
- MERGERS & ACQUISITIONS
- PRODUCT LAUNCHES & DEVELOPMENTS
- PARTNERSHIPS & AGREEMENTS
- BUSINESS EXPANSIONS & DIVESTITURES
- COMPANY PROFILES
- CHENIERE ENERGY
- COMPANY OVERVIEW
- PRODUCT LIST
- STRENGTHS & CHALLENGES
- EXXONMOBIL
- COMPANY OVERVIEW
- PRODUCT LIST
- STRENGTHS & CHALLENGES
- CONOCOPHILLIPS
- COMPANY OVERVIEW
- PRODUCT LIST
- STRENGTHS & CHALLENGES
- SHELL
- COMPANY OVERVIEW
- PRODUCT LIST
- STRENGTHS & CHALLENGES
- TOTALENERGIES
- COMPANY OVERVIEW
- PRODUCT LIST
- STRENGTHS & CHALLENGES
- VENTURE GLOBAL
- COMPANY OVERVIEW
- PRODUCT LIST
- STRENGTHS & CHALLENGES
- SEMPRA ENERGY
- COMPANY OVERVIEW
- PRODUCT LIST
- STRENGTHS & CHALLENGES
- CHENIERE ENERGY
- KEY STRATEGIC DEVELOPMENTS
LIST OF TABLES
TABLE 1: MARKET SNAPSHOT – LIQUEFIED NATURAL GAS (LNG)
TABLE 2: LIQUEFIED NATURAL GAS (LNG) MARKET REGULATORY FRAMEWORK
TABLE 3: UNITED STATES NATURAL GAS PRODUCTION, 2022-2024 (IN EXAJOULES)
TABLE 4: UNITED STATES NATURAL GAS CONSUMPTION, 2022-2024 (IN EXAJOULES)
TABLE 5: UNITED STATES LNG EXPORTS, 2022-2024 (IN BILLION CUBIC METERS)
TABLE 6: UNITED STATES LNG IMPORTS, 2022-2024 (IN BILLION CUBIC METERS)
TABLE 7: MARKET BY LNG INFRASTRUCTURE, HISTORICAL YEARS, 2022-2024 (IN $ MILLION)
TABLE 8: MARKET BY LNG INFRASTRUCTURE, FORECAST YEARS, 2026-2034 (IN $ MILLION)
TABLE 9: MARKET BY APPLICATION, HISTORICAL YEARS, 2022-2024 (IN $ MILLION)
TABLE 10: MARKET BY APPLICATION, FORECAST YEARS, 2026-2034 (IN $ MILLION)
TABLE 11: MARKET BY MODE OF SUPPLY, HISTORICAL YEARS, 2022-2024 (IN $ MILLION)
TABLE 12: MARKET BY MODE OF SUPPLY, FORECAST YEARS, 2026-2034 (IN $ MILLION)
TABLE 13: KEY PLAYERS OPERATING IN THE UNITED STATES MARKET
TABLE 14: LIST OF MERGERS & ACQUISITIONS
TABLE 15: LIST OF PRODUCT LAUNCHES & DEVELOPMENTS
TABLE 16: LIST OF PARTNERSHIPS & AGREEMENTS
TABLE 17: LIST OF BUSINESS EXPANSIONS & DIVESTITURES
LIST OF FIGURES
FIGURE 1: KEY MARKET TRENDS
FIGURE 2: PORTER’S FIVE FORCES ANALYSIS
FIGURE 3: GROWTH PROSPECT MAPPING FOR THE UNITED STATES
FIGURE 4: MARKET MATURITY ANALYSIS
FIGURE 5: MARKET CONCENTRATION ANALYSIS
FIGURE 6: VALUE CHAIN ANALYSIS
FIGURE 7: KEY BUYING CRITERIA
FIGURE 8: SEGMENT GROWTH POTENTIAL, BY LNG INFRASTRUCTURE, IN 2025
FIGURE 9: LNG LIQUEFACTION PLANTS MARKET SIZE, 2026-2034 (IN $ MILLION)
FIGURE 10: LNG REGASIFICATION FACILITIES MARKET SIZE, 2026-2034 (IN $ MILLION)
FIGURE 11: SEGMENT GROWTH POTENTIAL, BY APPLICATION, IN 2025
FIGURE 12: TRANSPORTATION MARKET SIZE, 2026-2034 (IN $ MILLION)
FIGURE 13: INDUSTRIAL FEEDSTOCK MARKET SIZE, 2026-2034 (IN $ MILLION)
FIGURE 14: POWER GENERATION MARKET SIZE, 2026-2034 (IN $ MILLION)
FIGURE 15: OTHER APPLICATIONS MARKET SIZE, 2026-2034 (IN $ MILLION)
FIGURE 16: SEGMENT GROWTH POTENTIAL, BY MODE OF SUPPLY, IN 2025
FIGURE 17: TRUCK MARKET SIZE, 2026-2034 (IN $ MILLION)
FIGURE 18: TRANSSHIPMENT AND BUNKERING MARKET SIZE, 2026-2034 (IN $ MILLION)
FIGURE 19: PIPELINE AND RAIL MARKET SIZE, 2026-2034 (IN $ MILLION)
FAQ’s
RELATED REPORTS
-

UNITED STATES AI-DRIVEN CLOUD MIGRATION SERVICES MARKET FORECAST 2026-2034
-

UNITED KINGDOM AI-DRIVEN CLOUD MIGRATION SERVICES MARKET FORECAST 2026-2034
-

UNITED ARAB EMIRATES AI-DRIVEN CLOUD MIGRATION SERVICES MARKET FORECAST 2026-2034
-

SOUTH KOREA AI-DRIVEN CLOUD MIGRATION SERVICES MARKET FORECAST 2026-2034
-

SINGAPORE AI-DRIVEN CLOUD MIGRATION SERVICES MARKET FORECAST 2026-2034
-

SAUDI ARABIA AI-DRIVEN CLOUD MIGRATION SERVICES MARKET FORECAST 2026-2034
-

AUSTRALIA AI-DRIVEN CLOUD MIGRATION SERVICES MARKET FORECAST 2026-2034
-

JAPAN AI-DRIVEN CLOUD MIGRATION SERVICES MARKET FORECAST 2026-2034
-

INDIA AI-DRIVEN CLOUD MIGRATION SERVICES MARKET FORECAST 2026-2034
-

CHINA AI-DRIVEN CLOUD MIGRATION SERVICES MARKET FORECAST 2026-2034