United States Computer Vision Applications in Mobility Market by Component (Hardware, Vision Processing & Compute, Software, Services), Market by Application (Advanced Driver Assistance Systems (ADAS), Autonomous Driving, Driver & Occupant Monitoring, Surround View & Parking Assistance, Other Applications), Market by Vehicle Type (Passenger Vehicles, Light Commercial Vehicles, Heavy Commercial Vehicles), by Geography
UNITED STATES COMPUTER VISION APPLICATIONS IN MOBILITY MARKET OVERVIEW
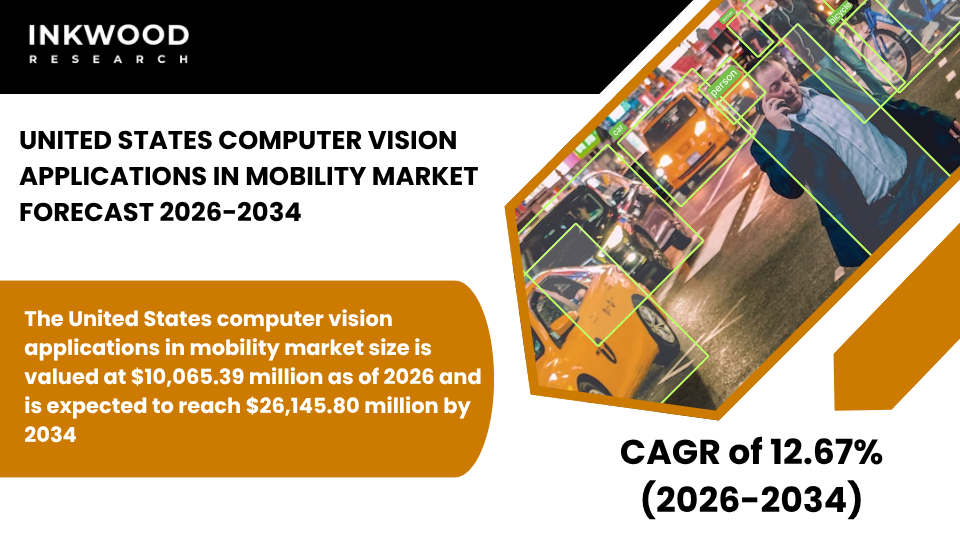
The United States computer vision applications in mobility market size is valued at $10,065.39 million as of 2026 and is expected to reach $26,145.80 million by 2034, progressing with a CAGR of 12.67% during the forecast years, 2026–2034.
MARKET INSIGHTS
The United States is a leading national market within the global computer vision in transportation market, distinguished by its unmatched concentration of autonomous vehicle developers, AI technology platforms, and automotive OEM investment activity. Companies such as Tesla, Waymo, Cruise, and Mobileye are headquartered or maintain their primary R&D operations in the country, collectively driving billions of dollars in annual investment into computer vision algorithms, sensor hardware, and edge computing platforms.
Furthermore, major Detroit-based OEMs, including General Motors and Ford, alongside international manufacturers with significant U.S. operations, are embedding advanced ADAS and perception technologies across their domestic vehicle lineups at an accelerating pace. This convergence of technology leadership and manufacturing scale positions the United States as both the innovation epicenter and the largest commercial deployment market for computer vision mobility solutions globally.
Federal and state-level regulatory frameworks are actively shaping demand across the United States computer vision automotive market. The National Highway Traffic Safety Administration (NHTSA) has mandated rear-view cameras in all new light vehicles since 2018 and is progressively advancing rulemaking on automatic emergency braking (AEB), with a final rule requiring AEB on new passenger cars and light trucks published in 2024.
Additionally, the U.S. Department of Transportation’s (DOT) Automated Vehicles Comprehensive Plan provides a structured federal framework for the testing and deployment of self-driving technologies, reducing regulatory ambiguity for technology vendors and OEM partners. At the state level, California, Arizona, Texas, and several other states have established dedicated autonomous vehicle testing and deployment corridors, creating real-world validation environments that are generating rich perception data and accelerating the commercial maturation of AI computer vision mobility market solutions.
These layered regulatory signals, therefore, are providing both a compliance-driven baseline and an innovation-enabling structure that together reinforce sustained market growth. The United States also benefits from a deeply developed smart city and intelligent transportation infrastructure ecosystem. The Federal Highway Administration (FHWA) has been funding intelligent transportation system deployments across major urban corridors, integrating computer vision-based traffic monitoring, incident detection, and pedestrian safety systems into public road networks.
Moreover, the growing commercialization of robotaxi and autonomous freight services, with Waymo operating fully driverless paid rides in multiple U.S. cities, is demonstrating the real-world viability of computer vision for autonomous vehicles market applications at scale. Additionally, the rapid expansion of fleet management and commercial logistics sectors is creating parallel demand for in-cab driver monitoring and exterior vision systems, broadening the addressable market well beyond passenger vehicles. Together, these dynamics are firmly set to sustain strong and broad-based growth in the United States computer vision applications in mobility market throughout the forecast period.
To Know More About This Report, Request a Free Sample Copy
SEGMENTATION ANALYSIS
The United States computer vision applications in mobility market is segmented by component, application, and vehicle type. The vehicle type segment is further categorized into passenger vehicles, light commercial vehicles, and heavy commercial vehicles.
The heavy commercial vehicles segment is emerging as a particularly high-growth and strategically important category within the United States computer vision in transportation market. Heavy commercial vehicles, including long-haul trucks, freight carriers, and large fleet operators, present a compelling commercial case for computer vision deployment, driven by the dual pressures of road safety liability and operational efficiency.
The Federal Motor Carrier Safety Administration (FMCSA) has been progressively tightening safety requirements for commercial truck operators, and camera-based systems for lane departure warning, forward collision detection, and driver monitoring are increasingly being adopted by fleet operators to meet compliance standards and reduce accident-related costs. Furthermore, the rapid commercialization of autonomous freight programs, with companies such as Aurora and Kodiak deploying self-driving trucks on U.S. highway corridors, is accelerating the integration of advanced multi-camera computer vision architectures into heavy vehicle platforms.
Additionally, large logistics operators, including Amazon and UPS, are deploying in-cab driver monitoring systems across their commercial fleets to manage driver fatigue risk, reduce insurance premiums, and improve overall fleet safety performance. As a result, the heavy commercial vehicles segment is becoming one of the most active and investment-intensive growth areas within the broader computer vision mobility solutions market in the United States, offering significant near-term revenue opportunities for hardware suppliers, AI software developers, and system integrators alike.
COMPETITIVE INSIGHTS
Some of the top players operating in the United States computer vision applications in mobility market include NVIDIA Corporation, Tesla Inc, Waymo (Alphabet Inc), Mobileye, Qualcomm Technologies Inc, Netradyne, Robert Bosch GmbH, Continental AG, and Magna International Inc, among others.
Waymo, operating as a subsidiary of Alphabet Inc, is the most strategically prominent and commercially advanced company in the United States computer vision for autonomous vehicles market. Headquartered in Mountain View, California, Waymo develops a fully integrated autonomous driving technology stack that places multi-camera computer vision at the core of its perception architecture, complemented by LiDAR, radar, and proprietary AI software.
The company’s Waymo One robotaxi service is among the first fully driverless commercial mobility services operating at scale in the U.S., making it a landmark reference point for the real-world viability of advanced computer vision mobility solutions. Furthermore, Waymo’s ongoing expansion into new cities, its Waymo Via autonomous freight program, and its technology licensing discussions with automotive OEM partners collectively position it as both an operator and a platform provider within the broader intelligent mobility computer vision market.
REPORT SYNOPSIS
| REPORT SCOPE | DETAILS |
|---|---|
| Market Forecast Years | 2026-2034 |
| Base Year | 2025 |
| Market Historical Years | 2022-2024 |
| Forecast Units | Revenue ($ Million) |
| Segments Analyzed | Component, Application, Vehicle Type |
| Country Analyzed | The United States |
| Companies Analyzed | NVIDIA Corporation, Tesla Inc, Qualcomm Technologies Inc, Mobileye, Netradyne, Robert Bosch GmbH, Continental AG, Magna International Inc, Waymo (Alphabet Inc) |
TABLE OF CONTENTS
RESEARCH SCOPE & METHODOLOGY
- STUDY OBJECTIVES
- METHODOLOGY
- ASSUMPTIONS & LIMITATIONS
EXECUTIVE SUMMARY
- MARKET SIZE, SHARE & ESTIMATES
- MARKET OVERVIEW
- SCOPE OF STUDY
- MAJOR MARKET FINDINGS
- THE UNITED STATES LEADS IN THE ADOPTION OF COMPUTER VISION IN MOBILITY DUE TO STRONG INVESTMENTS BY AUTOMOTIVE OEMS, TECHNOLOGY COMPANIES, AND AUTONOMOUS VEHICLE STARTUPS
- ADVANCED DRIVER ASSISTANCE SYSTEMS AND DRIVER MONITORING TECHNOLOGIES ARE RAPIDLY INTEGRATING INTO PASSENGER VEHICLES TO MEET SAFETY AND REGULATORY REQUIREMENTS
- STRONG COLLABORATION BETWEEN AUTOMOTIVE MANUFACTURERS AND AI TECHNOLOGY PROVIDERS IS ACCELERATING THE DEPLOYMENT OF COMPUTER VISION-BASED MOBILITY SOLUTIONS
- GROWING PILOT PROGRAMS FOR AUTONOMOUS VEHICLES AND ROBOTAXI SERVICES ARE EXPANDING REAL-WORLD APPLICATIONS OF COMPUTER VISION SYSTEMS
MARKET DYNAMICS
- KEY DRIVERS
- INCREASING FEDERAL AND STATE LEVEL ROAD SAFETY REGULATIONS ARE ENCOURAGING THE ADOPTION OF CAMERA-BASED DRIVER ASSISTANCE SYSTEMS
- HIGH INVESTMENT LEVELS FROM TECHNOLOGY COMPANIES AND AUTOMOTIVE OEMS ARE DRIVING INNOVATION IN COMPUTER VISION ALGORITHMS AND HARDWARE
- EXPANDING AUTONOMOUS VEHICLE TESTING PROGRAMS ARE INCREASING DEMAND FOR ADVANCED PERCEPTION AND OBJECT DETECTION SYSTEMS
- RAPID DEVELOPMENT OF SMART CITY INFRASTRUCTURE IS SUPPORTING THE USE OF COMPUTER VISION IN TRAFFIC MONITORING AND MOBILITY MANAGEMENT
- KEY RESTRAINTS
- HIGH DEVELOPMENT AND DEPLOYMENT COSTS OF AUTONOMOUS AND VISION-BASED MOBILITY SYSTEMS CAN LIMIT WIDESPREAD COMMERCIALIZATION
- REGULATORY UNCERTAINTY AROUND FULLY AUTONOMOUS VEHICLE OPERATIONS MAY DELAY MARKET SCALE-UP
- DATA PRIVACY CONCERNS RELATED TO VIDEO-BASED MONITORING SYSTEMS MAY CREATE COMPLIANCE AND PUBLIC ACCEPTANCE CHALLENGES
- TECHNICAL LIMITATIONS IN HANDLING COMPLEX URBAN TRAFFIC CONDITIONS CAN IMPACT COMPUTER VISION SYSTEM PERFORMANCE
- KEY DRIVERS
STRATEGIC MARKET ANALYTICS
- GROWTH METRICS
- TAM, SAM & SOM OPPORTUNITY ANALYSIS
- EMERGING MARKET TRENDS & PARADIGM SHIFTS
- RISING ADOPTION OF AI-POWERED DRIVER MONITORING SYSTEMS TO DETECT FATIGUE AND DISTRACTION IN REAL TIME
- INCREASING DEPLOYMENT OF EDGE AI PROCESSORS IN VEHICLES TO ENABLE LOW LATENCY COMPUTER VISION APPLICATIONS
- GROWING PARTNERSHIPS BETWEEN AUTOMOTIVE OEMS AND TECHNOLOGY COMPANIES TO DEVELOP AUTONOMOUS DRIVING PLATFORMS
- EXPANSION OF COMPUTER VISION IN MOBILITY SERVICES INCLUDING FLEET MANAGEMENT AND TRAFFIC ANALYTICS
- PORTER’S FIVE FORCES ANALYSIS
- BUYERS POWER
- SUPPLIERS POWER
- SUBSTITUTION
- NEW ENTRANTS
- INDUSTRY RIVALRY
- PESTLE ANALYSIS
- POLITICAL
- ECONOMIC
- SOCIAL LANDSCAPE
- TECHNOLOGY
- LEGAL
- ENVIRONMENTAL
- GROWTH OPPORTUNITY MAPPING & HEATMAP
- GROWTH PROSPECT MAPPING FOR THE UNITED STATES
- MARKET MATURITY & LIFECYCLE ANALYSIS
- MARKET CONCENTRATION ANALYSIS
- GROWTH METRICS
COMPUTER VISION APPLICATIONS IN MOBILITY VALUE CHAIN & DECISION FRAMEWORK
- VALUE CHAIN ANALYSIS
- IMAGE SENSOR MANUFACTURING
- VISION HARDWARE DESIGN
- AI MODEL DEVELOPMENT
- AUTOMOTIVE SYSTEM INTEGRATION
- SOFTWARE PLATFORM DEVELOPMENT
- OEM VEHICLE DEPLOYMENT
- AFTERMARKET MOBILITY SOLUTIONS
- KEY BUYING CRITERIA
- VISION ACCURACY
- REAL TIME PROCESSING
- SYSTEM INTEGRATION
- REGULATORY COMPLIANCE
- PRICING MODELS, PLATFORM LICENSING FRAMEWORKS & AI SOFTWARE MONETIZATION STRATEGIES
- REGULATORY & POLICY LANDSCAPE ANALYSIS
- VALUE CHAIN ANALYSIS
COMPUTER VISION APPLICATIONS IN MOBILITY MARKET BY COMPONENT
- HARDWARE
- MARKET SIZE, FORECAST & SHARE (2022–2034)
- VISION PROCESSING & COMPUTE
- MARKET SIZE, FORECAST & SHARE (2022–2034)
- SOFTWARE
- MARKET SIZE, FORECAST & SHARE (2022–2034)
- SERVICES
- MARKET SIZE, FORECAST & SHARE (2022–2034)
- HARDWARE
COMPUTER VISION APPLICATIONS IN MOBILITY MARKET BY APPLICATION
- ADVANCED DRIVER ASSISTANCE SYSTEMS (ADAS)
- MARKET SIZE, FORECAST & SHARE (2022–2034)
- AUTONOMOUS DRIVING
- MARKET SIZE, FORECAST & SHARE (2022–2034)
- DRIVER & OCCUPANT MONITORING
- MARKET SIZE, FORECAST & SHARE (2022–2034)
- SURROUND VIEW & PARKING ASSISTANCE
- MARKET SIZE, FORECAST & SHARE (2022–2034)
- OTHER APPLICATIONS
- MARKET SIZE, FORECAST & SHARE (2022–2034)
- ADVANCED DRIVER ASSISTANCE SYSTEMS (ADAS)
COMPUTER VISION APPLICATIONS IN MOBILITY MARKET BY VEHICLE TYPE
- PASSENGER VEHICLES
- MARKET SIZE, FORECAST & SHARE (2022–2034)
- LIGHT COMMERCIAL VEHICLES
- MARKET SIZE, FORECAST & SHARE (2022–2034)
- HEAVY COMMERCIAL VEHICLES
- MARKET SIZE, FORECAST & SHARE (2022–2034)
- PASSENGER VEHICLES
COMPETITIVE LANDSCAPE
- KEY STRATEGIC DEVELOPMENTS
- MERGERS & ACQUISITIONS
- PRODUCT LAUNCHES & DEVELOPMENTS
- PARTNERSHIPS & AGREEMENTS
- BUSINESS EXPANSIONS & DIVESTITURES
- COMPETITOR POSITIONING & DIFFERENTIATION MAP
- COMPANY PROFILES
- NVIDIA CORPORATION
- COMPANY OVERVIEW
- PRODUCT LIST
- STRENGTHS & CHALLENGES
- TESLA INC
- COMPANY OVERVIEW
- PRODUCT LIST
- STRENGTHS & CHALLENGES
- QUALCOMM TECHNOLOGIES INC
- COMPANY OVERVIEW
- PRODUCT LIST
- STRENGTHS & CHALLENGES
- MOBILEYE
- COMPANY OVERVIEW
- PRODUCT LIST
- STRENGTHS & CHALLENGES
- NETRADYNE
- COMPANY OVERVIEW
- PRODUCT LIST
- STRENGTHS & CHALLENGES
- ROBERT BOSCH GMBH
- COMPANY OVERVIEW
- PRODUCT LIST
- STRENGTHS & CHALLENGES
- CONTINENTAL AG
- COMPANY OVERVIEW
- PRODUCT LIST
- STRENGTHS & CHALLENGES
- MAGNA INTERNATIONAL INC
- COMPANY OVERVIEW
- PRODUCT LIST
- STRENGTHS & CHALLENGES
- WAYMO (ALPHABET INC)
- COMPANY OVERVIEW
- PRODUCT LIST
- STRENGTHS & CHALLENGES
- NVIDIA CORPORATION
- KEY STRATEGIC DEVELOPMENTS
LIST OF TABLES
TABLE 1: MARKET SNAPSHOT – COMPUTER VISION APPLICATIONS IN MOBILITY MARKET
TABLE 2: PRICING MODELS, PLATFORM LICENSING FRAMEWORKS & AI SOFTWARE MONETIZATION STRATEGIES
TABLE 3: REGULATORY & POLICY LANDSCAPE ANALYSIS
TABLE 4: MARKET BY COMPONENT, HISTORICAL YEARS, 2022-2024 (IN $ MILLION)
TABLE 5: MARKET BY COMPONENT, FORECAST YEARS, 2026-2034 (IN $ MILLION)
TABLE 6: MARKET BY APPLICATION, HISTORICAL YEARS, 2022-2024 (IN $ MILLION)
TABLE 7: MARKET BY APPLICATION, FORECAST YEARS, 2026-2034 (IN $ MILLION)
TABLE 8: MARKET BY VEHICLE TYPE, HISTORICAL YEARS, 2022-2024 (IN $ MILLION)
TABLE 9: MARKET BY VEHICLE TYPE, FORECAST YEARS, 2026-2034 (IN $ MILLION)
TABLE 10: KEY PLAYERS OPERATING IN THE UNITED STATES MARKET
TABLE 11: LIST OF MERGERS & ACQUISITIONS
TABLE 12: LIST OF PRODUCT LAUNCHES & DEVELOPMENTS
TABLE 13: LIST OF PARTNERSHIPS & AGREEMENTS
TABLE 14: LIST OF BUSINESS EXPANSIONS & DIVESTITURES
LIST OF FIGURES
FIGURE 1: MAJOR MARKET FINDINGS
FIGURE 2: MARKET DYNAMICS
FIGURE 3: KEY MARKET TRENDS
FIGURE 4: PORTER’S FIVE FORCES ANALYSIS
FIGURE 5: GROWTH PROSPECT MAPPING FOR THE UNITED STATES
FIGURE 6: MARKET MATURITY ANALYSIS
FIGURE 7: MARKET CONCENTRATION ANALYSIS
FIGURE 8: VALUE CHAIN ANALYSIS
FIGURE 9: KEY BUYING CRITERIA
FIGURE 10: SEGMENT GROWTH POTENTIAL, BY COMPONENT, IN 2025
FIGURE 11: HARDWARE MARKET SIZE, 2026-2034 (IN $ MILLION)
FIGURE 12: VISION PROCESSING & COMPUTE MARKET SIZE, 2026-2034 (IN $ MILLION)
FIGURE 13: SOFTWARE MARKET SIZE, 2026-2034 (IN $ MILLION)
FIGURE 14: SERVICES MARKET SIZE, 2026-2034 (IN $ MILLION)
FIGURE 15: SEGMENT GROWTH POTENTIAL, BY APPLICATION, IN 2025
FIGURE 16: ADVANCED DRIVER ASSISTANCE SYSTEMS (ADAS) MARKET SIZE, 2026-2034 (IN $ MILLION)
FIGURE 17: AUTONOMOUS DRIVING MARKET SIZE, 2026-2034 (IN $ MILLION)
FIGURE 18: DRIVER & OCCUPANT MONITORING MARKET SIZE, 2026-2034 (IN $ MILLION)
FIGURE 19: SURROUND VIEW & PARKING ASSISTANCE MARKET SIZE, 2026-2034 (IN $ MILLION)
FIGURE 20: OTHER APPLICATIONS MARKET SIZE, 2026-2034 (IN $ MILLION)
FIGURE 21: SEGMENT GROWTH POTENTIAL, BY VEHICLE TYPE, IN 2025
FIGURE 22: PASSENGER VEHICLES MARKET SIZE, 2026-2034 (IN $ MILLION)
FIGURE 23: LIGHT COMMERCIAL VEHICLES MARKET SIZE, 2026-2034 (IN $ MILLION)
FIGURE 24: HEAVY COMMERCIAL VEHICLES MARKET SIZE, 2026-2034 (IN $ MILLION)
FAQ’s
RELATED REPORTS
-

LATIN AMERICA FACIAL RECOGNITION MARKET FORECAST 2019-2028
-

UNITED STATES AI-DRIVEN CLOUD MIGRATION SERVICES MARKET FORECAST 2026-2034
-

UNITED KINGDOM AI-DRIVEN CLOUD MIGRATION SERVICES MARKET FORECAST 2026-2034
-

UNITED ARAB EMIRATES AI-DRIVEN CLOUD MIGRATION SERVICES MARKET FORECAST 2026-2034
-

SOUTH KOREA AI-DRIVEN CLOUD MIGRATION SERVICES MARKET FORECAST 2026-2034
-

SINGAPORE AI-DRIVEN CLOUD MIGRATION SERVICES MARKET FORECAST 2026-2034
-

SAUDI ARABIA AI-DRIVEN CLOUD MIGRATION SERVICES MARKET FORECAST 2026-2034
-

AUSTRALIA AI-DRIVEN CLOUD MIGRATION SERVICES MARKET FORECAST 2026-2034
-

JAPAN AI-DRIVEN CLOUD MIGRATION SERVICES MARKET FORECAST 2026-2034
-

INDIA AI-DRIVEN CLOUD MIGRATION SERVICES MARKET FORECAST 2026-2034