South Korea Optical Imaging Systems Market by Technology (Photoacoustic Tomography, Optical Coherence Tomography, Hyperspectral Imaging, Near-Infrared Spectroscopy) Market by Product (Imaging Systems, Optical Imaging Software, Illumination Systems, Other Products) Market by Application (Pathological, Intraoperative) Market by Therapeutic Area (Ophthalmology, Cardiology, Oncology, Dermatology, Neurology), by Geography
SOUTH KOREA OPTICAL IMAGING SYSTEMS MARKET OVERVIEW
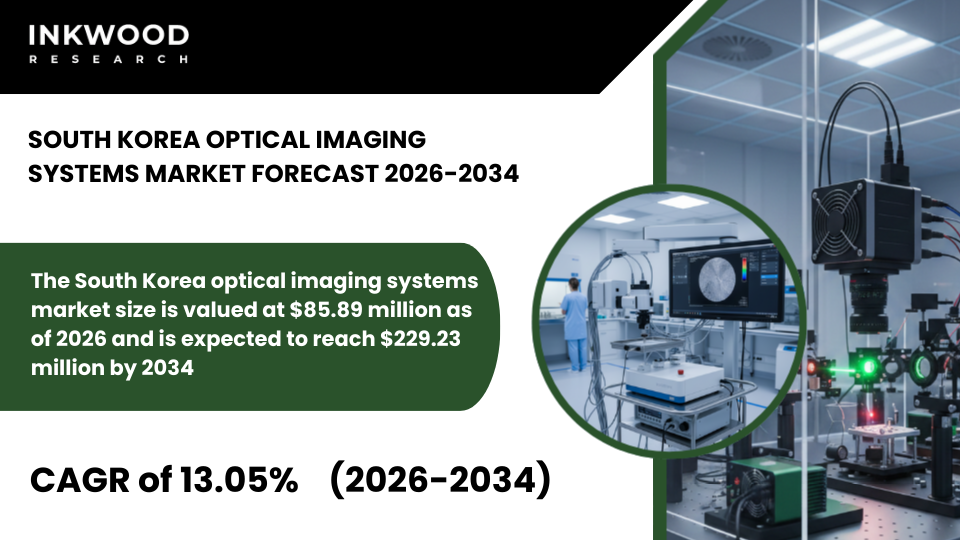
The South Korea optical imaging systems market size is valued at $85.89 million as of 2026 and is expected to reach $229.23 million by 2034, progressing with a CAGR of 13.05% during the forecast years, 2026-2034.
South Korea emerges as one of Asia’s most dynamic optical imaging systems markets, propelled by aggressive digital health transformation initiatives and smart hospital development programs. The government actively supports medical device innovation through substantial research funding and export promotion policies that encourage domestic manufacturers to compete globally.
Moreover, South Korea’s exceptionally high technology adoption rates enable rapid commercialization of novel optical imaging platforms once regulatory approval is secured. The nation’s advanced digital infrastructure facilitates seamless integration of artificial intelligence and software-driven imaging analytics into clinical workflows.
Additionally, South Korea demonstrates remarkable healthcare accessibility, with universal coverage encouraging regular diagnostic screenings that drive imaging equipment utilization rates. Private hospitals throughout Seoul, Busan, and other major cities invest heavily in premium diagnostic technologies to attract patients seeking cutting-edge medical care. Furthermore, the country’s growing elderly population increases demand for optical imaging devices across ophthalmology, cardiology, and neurology specialties.
To Know More About This Report, Request a Free Sample Copy
South Korea’s medical tourism sector also contributes to market growth, as international patients seek advanced diagnostic services combined with therapeutic procedures. Consequently, both established international manufacturers and emerging domestic players find South Korea exceptionally attractive for launching innovative optical imaging solutions that leverage the nation’s technological sophistication.
The South Korea optical imaging systems market is segmented into technology, product, application, and therapeutic area. The product segment is further categorized into imaging systems, optical imaging software, illumination systems, and other products.
Optical imaging software represents the fastest-growing product segment throughout South Korea, reflecting the nation’s exceptional strength in software engineering and artificial intelligence development. Korean technology companies excel at creating sophisticated image analysis algorithms that enhance diagnostic accuracy while reducing interpretation time significantly.
These software solutions integrate seamlessly with various optical imaging hardware platforms, providing clinicians with advanced tools for automated disease detection and quantitative tissue analysis. Moreover, South Korea’s 5G network infrastructure enables cloud-based imaging software that facilitates remote diagnostics and specialist consultations across geographic distances. According to the Korea Institute of Science and Technology Information, the nation prioritizes developing AI-powered medical imaging technologies as strategic national initiatives.
Healthcare providers particularly value software platforms that support workflow efficiency in high-volume clinical settings common throughout urban Korean hospitals. Furthermore, local software developers customize solutions specifically for Korean clinical practices and integrate seamlessly with electronic health record systems widely deployed nationwide. The software segment benefits from strong collaboration between technology giants like Samsung and LG with medical institutions, accelerating innovation cycles substantially.
Additionally, Korean medical imaging software companies increasingly export their solutions to regional markets, establishing South Korea as an emerging hub for medical imaging analytics development. These platforms often incorporate machine learning models trained on diverse Asian patient populations, improving diagnostic accuracy for regional demographics compared to Western-developed alternatives. Consequently, hospitals investing in comprehensive optical imaging software suites gain competitive advantages through enhanced diagnostic capabilities and improved operational efficiency that translate directly into better patient outcomes and reduced costs.
Some of the top players operating in the South Korea optical imaging systems market include Topcon Corporation, Canon Medical Systems Corporation, Carl Zeiss Meditec AG, Abbott Laboratories, etc.
Topcon Corporation maintains a significant presence throughout South Korea’s optical imaging systems market as a leading Japanese manufacturer of precision optical and imaging equipment, headquartered in Tokyo. The company delivers comprehensive solutions spanning ophthalmology, optometry, and healthcare imaging applications with particular expertise in retinal diagnostic platforms and surgical visualization systems.
Topcon’s product portfolio includes advanced optical coherence tomography devices, fundus cameras, automated refraction systems, and integrated diagnostic workstations that streamline eye examination workflows efficiently. The company established strong distribution networks throughout South Korea, partnering with local medical equipment distributors who provide technical support and training services in the Korean language.
Moreover, Topcon operates regional service centers ensuring rapid response times for equipment maintenance and software updates crucial for busy clinical practices. Its business model emphasizes building long-term relationships with ophthalmology clinics and hospitals through comprehensive service contracts and technology upgrade programs. Topcon particularly resonates with Korean healthcare providers due to its reputation for precision engineering and reliability, qualities highly valued in Korean medical culture.
Additionally, the company invests substantially in developing AI-powered diagnostic aids that align perfectly with South Korea’s digital health priorities and technological sophistication. Korean ophthalmologists appreciate Topcon’s continuous innovation in imaging speed and resolution, enabling efficient patient throughput essential in high-volume urban practices.
REPORT SYNOPSIS
| REPORT SCOPE | DETAILS |
|---|---|
| Market Forecast Years | 2026-2034 |
| Base Year | 2025 |
| Market Historical Years | 2022-2024 |
| Forecast Units | Revenue ($ Million) |
| Segments Analyzed | Technology, Product, Application, and Therapeutic Area |
| Country Analyzed | South Korea |
| Companies Analyzed | Abbott Laboratories, Canon Medical Systems Corporation, Topcon Corporation, Carl Zeiss Meditec AG, Heidelberg Engineering GmbH, PerkinElmer Inc |
TABLE OF CONTENTS
RESEARCH SCOPE & METHODOLOGY
- STUDY OBJECTIVES
- METHODOLOGY
- ASSUMPTIONS & LIMITATIONS
EXECUTIVE SUMMARY
- MARKET SIZE & FORECAST
- MARKET OVERVIEW
- SCOPE OF STUDY
- CRISIS SCENARIO ANALYSIS
- MAJOR MARKET FINDINGS
- SOUTH KOREA IS EMERGING AS A FAST-GROWING OPTICAL IMAGING SYSTEMS MARKET DRIVEN BY DIGITAL HEALTH AND SMART HOSPITAL INITIATIVES
- STRONG DEMAND IS OBSERVED IN OPHTHALMOLOGY AND DERMATOLOGY DUE TO HIGH HEALTHCARE ACCESS AND AESTHETIC PROCEDURE VOLUMES
- LOCAL MANUFACTURERS ARE INCREASINGLY COMPETING WITH GLOBAL PLAYERS THROUGH COST EFFECTIVE AND INNOVATIVE SOLUTIONS
- HIGH TECHNOLOGY ADOPTION RATES ENABLE RAPID COMMERCIALIZATION OF NEW OPTICAL IMAGING PLATFORMS
MARKET DYNAMICS
- KEY DRIVERS
- GOVERNMENT SUPPORT FOR MEDICAL DEVICE INNOVATION AND EXPORT PROMOTION IS FUELING MARKET GROWTH
- RISING INCIDENCE OF CHRONIC DISEASES AND AGE-RELATED DISORDERS IS DRIVING DIAGNOSTIC IMAGING NEEDS
- ADVANCED DIGITAL INFRASTRUCTURE FACILITATES INTEGRATION OF AI AND SOFTWARE-DRIVEN IMAGING SYSTEMS
- INCREASING PRIVATE HOSPITAL INVESTMENTS IN HIGH-END DIAGNOSTIC TECHNOLOGIES SUPPORTS MARKET EXPANSION
- KEY RESTRAINTS
- INTENSE PRICE COMPETITION FROM DOMESTIC AND REGIONAL PLAYERS CAN PRESSURE PROFIT MARGINS
- REGULATORY APPROVAL PROCESSES MAY DELAY INTRODUCTION OF NOVEL IMAGING TECHNOLOGIES
- DEPENDENCE ON IMPORTED HIGH-END COMPONENTS CAN INCREASE SYSTEM COSTS
- LIMITED ADOPTION IN SMALLER CLINICS DUE TO CAPITAL INVESTMENT REQUIREMENTS
- KEY DRIVERS
KEY ANALYTICS
- KEY MARKET TRENDS
- GROWING USE OF AI ASSISTED OPTICAL IMAGING FOR EARLY DISEASE DETECTION IS TRANSFORMING CLINICAL PRACTICE
- INCREASING DEMAND FOR COMPACT AND PORTABLE SYSTEMS IS SUPPORTING POINT-OF-CARE DIAGNOSTICS
- EXPANSION OF OPTICAL IMAGING IN COSMETIC AND AESTHETIC APPLICATIONS IS DIVERSIFYING MARKET USE CASES
- STRATEGIC PARTNERSHIPS BETWEEN TECHNOLOGY FIRMS AND HOSPITALS ARE ACCELERATING ADOPTION
- PORTER’S FIVE FORCES ANALYSIS
- BUYERS POWER
- SUPPLIERS POWER
- SUBSTITUTION
- NEW ENTRANTS
- INDUSTRY RIVALRY
- GROWTH PROSPECT MAPPING
- GROWTH PROSPECT MAPPING FOR SOUTH KOREA
- MARKET MATURITY ANALYSIS
- MARKET CONCENTRATION ANALYSIS
- VALUE CHAIN ANALYSIS
- RAW MATERIAL SUPPLIERS
- OPTICAL COMPONENT MANUFACTURING
- SENSOR AND DETECTOR PRODUCTION
- SYSTEM INTEGRATION
- SOFTWARE DEVELOPMENT
- DISTRIBUTION AND SALES
- END-USER APPLICATION
- KEY BUYING CRITERIA
- IMAGE RESOLUTION
- SYSTEM RELIABILITY
- REGULATORY COMPLIANCE
- TOTAL COST OWNERSHIP
- REGULATORY FRAMEWORK
- KEY MARKET TRENDS
OPTICAL IMAGING SYSTEMS MARKET BY TECHNOLOGY
- PHOTOACOUSTIC TOMOGRAPHY
- OPTICAL COHERENCE TOMOGRAPHY
- HYPERSPECTRAL IMAGING
- NEAR-INFRARED SPECTROSCOPY
OPTICAL IMAGING SYSTEMS MARKET BY PRODUCT
- IMAGING SYSTEMS
- OPTICAL
- SPECTRAL
- OPTICAL IMAGING SOFTWARE
- ILLUMINATION SYSTEMS
- OTHER PRODUCTS
- IMAGING SYSTEMS
OPTICAL IMAGING SYSTEMS MARKET BY APPLICATION
- PATHOLOGICAL
- INTRAOPERATIVE
OPTICAL IMAGING SYSTEMS MARKET BY THERAPEUTIC AREA
- OPHTHALMOLOGY
- CARDIOLOGY
- ONCOLOGY
- DERMATOLOGY
COMPETITIVE LANDSCAPE
- KEY STRATEGIC DEVELOPMENTS
- MERGERS & ACQUISITIONS
- PRODUCT LAUNCHES & DEVELOPMENTS
- PARTNERSHIPS & AGREEMENTS
- BUSINESS EXPANSIONS & DIVESTITURES
- COMPANY PROFILES
- ABBOTT LABORATORIES
- COMPANY OVERVIEW
- PRODUCT LIST
- STRENGTHS & CHALLENGES
- CANON MEDICAL SYSTEMS CORPORATION
- COMPANY OVERVIEW
- PRODUCT LIST
- STRENGTHS & CHALLENGES
- TOPCON CORPORATION
- COMPANY OVERVIEW
- PRODUCT LIST
- STRENGTHS & CHALLENGES
- CARL ZEISS MEDITEC AG
- COMPANY OVERVIEW
- PRODUCT LIST
- STRENGTHS & CHALLENGES
- HEIDELBERG ENGINEERING GMBH
- COMPANY OVERVIEW
- PRODUCT LIST
- STRENGTHS & CHALLENGES
- PERKINELMER INC
- COMPANY OVERVIEW
- PRODUCT LIST
- STRENGTHS & CHALLENGES
- ABBOTT LABORATORIES
- KEY STRATEGIC DEVELOPMENTS
LIST OF TABLES
TABLE 1: MARKET SNAPSHOT – OPTICAL IMAGING SYSTEMS
TABLE 2: OPTICAL IMAGING SYSTEMS MARKET REGULATORY FRAMEWORK
TABLE 3: MARKET BY TECHNOLOGY, BY REGION, HISTORICAL YEARS, 2022-2024 (IN $ MILLION)
TABLE 4: MARKET BY TECHNOLOGY, BY REGION, FORECAST YEARS, 2026-2034 (IN $ MILLION)
TABLE 5: MARKET BY PRODUCT, BY REGION, HISTORICAL YEARS, 2022-2024 (IN $ MILLION)
TABLE 6: MARKET BY PRODUCT, BY REGION, FORECAST YEARS, 2026-2034 (IN $ MILLION)
TABLE 7: MARKET BY IMAGING SYSTEMS, BY REGION, HISTORICAL YEARS, 2022-2024 (IN $ MILLION)
TABLE 8: MARKET BY IMAGING SYSTEMS, BY REGION, FORECAST YEARS, 2026-2034 (IN $ MILLION)
TABLE 9: MARKET BY APPLICATION, BY REGION, HISTORICAL YEARS, 2022-2024 (IN $ MILLION)
TABLE 10: MARKET BY APPLICATION, BY REGION, FORECAST YEARS, 2026-2034 (IN $ MILLION)
TABLE 11: MARKET BY THERAPEUTIC AREA, BY REGION, HISTORICAL YEARS, 2022-2024 (IN $ MILLION)
TABLE 12: MARKET BY THERAPEUTIC AREA, BY REGION, FORECAST YEARS, 2026-2034 (IN $ MILLION)
TABLE 13: KEY PLAYERS OPERATING IN THE SOUTH KOREAN MARKET
TABLE 14: LIST OF MERGERS & ACQUISITIONS
TABLE 15: LIST OF PRODUCT LAUNCHES & DEVELOPMENTS
TABLE 16: LIST OF PARTNERSHIPS & AGREEMENTS
TABLE 17: LIST OF BUSINESS EXPANSIONS & DIVESTITURES
LIST OF FIGURES
FIGURE 1: KEY MARKET TRENDS
FIGURE 2: PORTER’S FIVE FORCES ANALYSIS
FIGURE 3: GROWTH PROSPECT MAPPING FOR SOUTH KOREA
FIGURE 4: MARKET MATURITY ANALYSIS
FIGURE 5: MARKET CONCENTRATION ANALYSIS
FIGURE 6: VALUE CHAIN ANALYSIS
FIGURE 7: KEY BUYING CRITERIA
FIGURE 8: SEGMENT GROWTH POTENTIAL, BY TECHNOLOGY, IN 2025
FIGURE 9: PHOTOACOUSTIC TOMOGRAPHY MARKET SIZE, 2026-2034 (IN $ MILLION)
FIGURE 10: OPTICAL COHERENCE TOMOGRAPHY MARKET SIZE, 2026-2034 (IN $ MILLION)
FIGURE 11: HYPERSPECTRAL IMAGING MARKET SIZE, 2026-2034 (IN $ MILLION)
FIGURE 12: NEAR-INFRARED SPECTROSCOPY MARKET SIZE, 2026-2034 (IN $ MILLION)
FIGURE 13: SEGMENT GROWTH POTENTIAL, BY PRODUCT, IN 2025
FIGURE 14: IMAGING SYSTEMS MARKET SIZE, 2026-2034 (IN $ MILLION)
FIGURE 15: SEGMENT GROWTH POTENTIAL, BY IMAGING SYSTEMS, IN 2025
FIGURE 16: OPTICAL IMAGING SYSTEMS MARKET SIZE, 2026-2034 (IN $ MILLION)
FIGURE 17: SPECTRAL IMAGING SYSTEMS MARKET SIZE, 2026-2034 (IN $ MILLION)
FIGURE 18: OPTICAL IMAGING SOFTWARE MARKET SIZE, 2026-2034 (IN $ MILLION)
FIGURE 19: ILLUMINATION SYSTEMS MARKET SIZE, 2026-2034 (IN $ MILLION)
FIGURE 20: OTHER PRODUCTS MARKET SIZE, 2026-2034 (IN $ MILLION)
FIGURE 21: SEGMENT GROWTH POTENTIAL, BY APPLICATION, IN 2025
FIGURE 22: PATHOLOGICAL MARKET SIZE, 2026-2034 (IN $ MILLION)
FIGURE 23: INTRAOPERATIVE MARKET SIZE, 2026-2034 (IN $ MILLION)
FIGURE 24: SEGMENT GROWTH POTENTIAL, BY THERAPEUTIC AREA, IN 2025
FIGURE 25: OPHTHALMOLOGY MARKET SIZE, 2026-2034 (IN $ MILLION)
FIGURE 26: CARDIOLOGY MARKET SIZE, 2026-2034 (IN $ MILLION)
FIGURE 27: ONCOLOGY MARKET SIZE, 2026-2034 (IN $ MILLION)
FIGURE 28: DERMATOLOGY MARKET SIZE, 2026-2034 (IN $ MILLION)
FIGURE 29: NEUROLOGY MARKET SIZE, 2026-2034 (IN $ MILLION)
FAQ’s
RELATED REPORTS
-
GLOBAL 3D CELL CULTURE MARKET FORECAST 2026
-
NORTH AMERICA 3D CELL CULTURE MARKET FORECAST 2026
-
GLOBAL BIOLOGICAL IMAGING REAGENT MARKET FORECAST 2026
-

UNITED STATES AI-DRIVEN CLOUD MIGRATION SERVICES MARKET FORECAST 2026-2034
-

UNITED KINGDOM AI-DRIVEN CLOUD MIGRATION SERVICES MARKET FORECAST 2026-2034
-

UNITED ARAB EMIRATES AI-DRIVEN CLOUD MIGRATION SERVICES MARKET FORECAST 2026-2034
-

SOUTH KOREA AI-DRIVEN CLOUD MIGRATION SERVICES MARKET FORECAST 2026-2034
-

SINGAPORE AI-DRIVEN CLOUD MIGRATION SERVICES MARKET FORECAST 2026-2034
-

SAUDI ARABIA AI-DRIVEN CLOUD MIGRATION SERVICES MARKET FORECAST 2026-2034
-

AUSTRALIA AI-DRIVEN CLOUD MIGRATION SERVICES MARKET FORECAST 2026-2034