Qatar Liquefied Natural Gas (LNG) Market by LNG Infrastructure (LNG Liquefaction Plants, LNG Regasification Facilities, LNG Shipping & Transportation) Market by Application (Transportation, Industrial Feedstock, Power Generation, Other Applications) Market by Mode of Supply (Truck, Transshipment and Bunkering, Pipeline and Rail)
QATAR LIQUEFIED NATURAL GAS (LNG) MARKET OVERVIEW
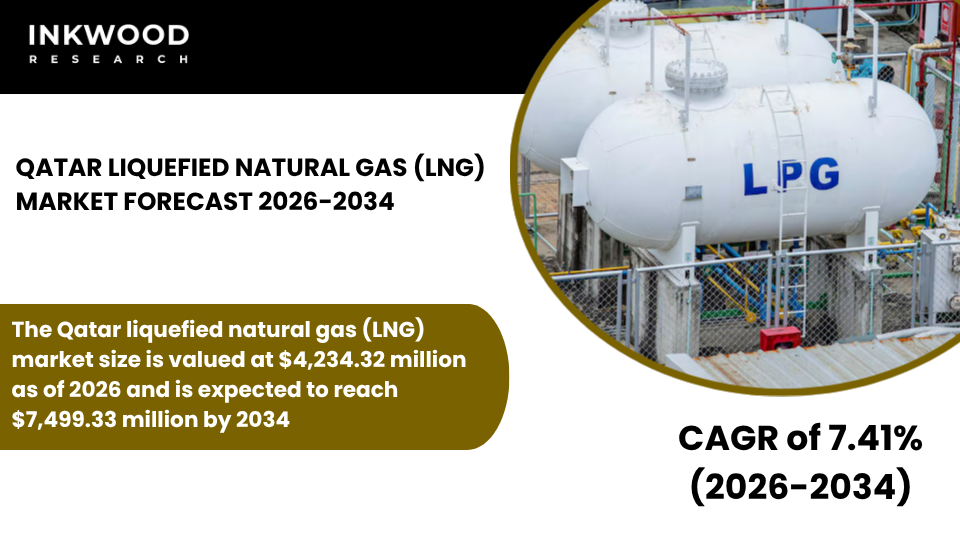
The Qatar liquefied natural gas (LNG) market size is valued at $4,234.32 million as of 2026 and is expected to reach $7,499.33 million by 2034, progressing with a CAGR of 7.41% during the forecast years, 2026-2034.
Qatar’s position as a premier global liquefied natural gas supplier continues to strengthen through the massive North Field expansion project that will fundamentally reshape international supply dynamics for decades to come. This ambitious development leverages the world’s largest non-associated gas field to deliver unprecedented production capacity increases that position Qatar to reclaim its status as the leading LNG exporter globally.
According to QatarEnergy, the North Field expansion comprises multiple phases designed to boost the country’s annual liquefaction capacity substantially while incorporating advanced technologies that enhance efficiency and environmental performance. These infrastructure investments reflect Qatar’s strategic commitment to maintaining its competitive advantage in the evolving natural gas market despite growing competition from other producing regions.
The North Field East phase represents the initial component of Qatar’s expansion strategy, featuring state-of-the-art liquefaction trains that embody cutting-edge engineering and operational excellence. Construction activities progressed significantly throughout recent years, with facilities moving toward commissioning stages that will enable production startup and initial cargo deliveries to long-term contract holders.
Furthermore, the project incorporates carbon capture and storage capabilities from inception, demonstrating Qatar’s dedication to producing cleaner energy solutions that meet increasingly stringent buyer requirements. International energy companies participate as development partners, bringing technical expertise and financial resources that accelerate project execution while distributing commercial risks among multiple stakeholders.
To Know More About This Report, Request a Free Sample Copy
Qatar’s natural gas reserves provide the foundation for sustained production growth spanning multiple decades, ensuring the country can reliably fulfill long-term supply commitments to buyers across Asia, Europe, and emerging markets. The North Field contains an estimated resource base sufficient to support current and planned export volumes well beyond mid-century, creating confidence among buyers seeking stable partnerships.
Consequently, Qatar successfully negotiates contracts extending 15 to 25 years with major utilities and energy companies worldwide. These agreements typically incorporate price mechanisms linked to crude oil benchmarks or regional gas indices, providing revenue predictability while maintaining competitiveness against alternative suppliers.
Export infrastructure development accompanies upstream capacity expansion to ensure efficient cargo handling and vessel loading operations that minimize turnaround times and maximize throughput. Qatar operates dedicated LNG terminals equipped with multiple berths capable of serving the world’s largest LNG carriers simultaneously, reducing congestion and improving operational flexibility.
Additionally, the country maintains one of the largest LNG shipping fleets globally through Nakilat, enabling control over cargo delivery logistics and reducing dependence on third-party vessel operators. This vertical integration from production through transportation enhances Qatar’s ability to meet contractual obligations reliably while capturing additional value chain margins.
Domestic consumption of liquefied natural gas remains relatively modest compared to export volumes, though power generation applications drive the majority of local utilization as Qatar meets its own growing electricity requirements. Gas-fired plants provide reliable baseload capacity that supports economic development, urban expansion, and quality-of-life improvements for the population.
Moreover, industrial facilities, including petrochemical complexes and aluminum smelters, depend on natural gas supplies for both energy and feedstock applications. The government balances domestic allocation requirements against export opportunities, ensuring adequate local supplies while maximizing revenue from international sales that fund national development priorities.
Strategic partnerships with international oil and gas majors bring critical capabilities that accelerate project development timelines while managing the substantial capital requirements associated with megaproject construction. Companies like ExxonMobil, ConocoPhillips, and TotalEnergies contribute decades of LNG experience alongside financial resources that enable simultaneous development of multiple liquefaction trains.
These collaborations distribute commercial risks while providing Qatar access to global marketing networks and technical innovations that enhance project economics. Furthermore, partnership structures align incentives between QatarEnergy and international participants, ensuring commitment to operational excellence and long-term value creation.
Qatar’s competitive advantages extend beyond abundant reserves to encompass favorable production economics enabled by low extraction costs and proximity to key Asian markets that reduce shipping expenses and delivery times. The country’s geographic position along critical maritime routes connecting the Middle East with consumption centers in China, Japan, and South Korea creates natural logistics advantages over more distant suppliers.
Additionally, Qatar’s political stability and proven track record of contract performance make it a preferred supplier for buyers prioritizing supply security alongside price competitiveness. These factors collectively reinforce Qatar’s position even as new supply sources emerge globally, playing a pivotal role in the growth of the Qatar liquefied natural gas market.
The Qatar liquefied natural gas (LNG) market is segmented into LNG infrastructure, application, and mode of supply. The LNG infrastructure segment is further categorized into LNG liquefaction plants and LNG regasification facilities.
Liquefaction plants dominate Qatar’s infrastructure landscape as the country focuses overwhelmingly on export-oriented production rather than import activities or domestic regasification requirements. The North Field expansion adds massive new liquefaction capacity through mega-trains employing the latest process technologies that maximize thermal efficiency while minimizing environmental footprint.
Each train processes enormous gas volumes from offshore platforms, removing impurities and cooling the gas to cryogenic temperatures where it transitions into liquid form suitable for shipping. These facilities incorporate modular construction techniques that accelerate installation while maintaining quality standards essential for safe, reliable operations over multi-decade service lives. Furthermore, liquefaction plant operators implement digital monitoring systems that optimize performance, predict maintenance requirements, and enhance overall operational efficiency.
The expansion project creates significant construction employment while establishing long-term operational positions that support skills development and technology transfer within Qatar’s workforce. Additionally, plant designs incorporate flexibility to handle varying gas compositions and throughput requirements, ensuring operational resilience against changing field conditions or market demands throughout the facilities’ operational lifespan.
Some of the top players operating in the Qatar liquefied natural gas (LNG) market include QatarEnergy LNG, Qatargas, TotalEnergies, and ExxonMobil, etc.
QatarEnergy operates as Qatar’s national energy company, headquartered in Doha with comprehensive responsibilities spanning upstream exploration and production, midstream liquefaction and transportation, and downstream marketing activities. The company manages the North Field expansion program while maintaining existing production facilities that have established Qatar’s reputation for operational reliability and contract performance excellence. QatarEnergy’s business model integrates resource ownership with infrastructure development and global marketing capabilities, enabling end-to-end value capture from wellhead to final customer delivery.
The company actively pursues international partnerships that bring technical expertise and financial resources while maintaining strategic control over resource development decisions and national energy policy implementation. Additionally, QatarEnergy invests in sustainability initiatives, including carbon capture integration and methane emission reduction programs, that position Qatar’s LNG exports competitively as markets increasingly demand cleaner energy solutions.
REPORT SYNOPSIS
| REPORT SCOPE | DETAILS |
|---|---|
| Market Forecast Years | 2026-2034 |
| Base Year | 2025 |
| Market Historical Years | 2022-2024 |
| Forecast Units | Revenue ($ Million) |
| Segments Analyzed | LNG Infrastructure, Application, and Mode of Supply |
| Country Analyzed | Qatar |
| Companies Analyzed | QatarEnergy LNG, Qatargas, ExxonMobil, ConocoPhillips, TotalEnergies, Nakilat, RasGas |
TABLE OF CONTENTS
RESEARCH SCOPE & METHODOLOGY
- STUDY OBJECTIVES
- METHODOLOGY
- ASSUMPTIONS & LIMITATIONS
EXECUTIVE SUMMARY
- MARKET SIZE, SHARE & ESTIMATES
- MARKET OVERVIEW
- SCOPE OF STUDY
- CRISIS SCENARIO ANALYSIS
- MAJOR MARKET FINDINGS
- QATAR ADVANCES AS A PREMIER GLOBAL LNG SUPPLIER THROUGH THE NORTH FIELD EXPANSION PROJECT
- THE NORTH FIELD EAST PHASE PREPARES FOR INITIAL PRODUCTION, CONTRIBUTING TO CAPACITY GROWTH
- QATAR MAINTAINS STRONG MARKET POSITION WITH LONG-TERM CONTRACTS AND RELIABLE SUPPLY
- EXPANSION INITIATIVES POSITION QATAR FOR INCREASED GLOBAL LNG MARKET SHARE
MARKET DYNAMICS
- KEY DRIVERS
- NORTH FIELD EXPANSION SIGNIFICANTLY BOOSTS LIQUEFACTION CAPACITY AND EXPORT VOLUMES
- STRONG INTERNATIONAL DEMAND SUPPORTS LONG-TERM SALES AGREEMENTS AND MARKET STABILITY
- STRATEGIC PARTNERSHIPS WITH MAJOR ENERGY COMPANIES FACILITATE PROJECT DEVELOPMENT
- ABUNDANT RESERVES ENABLE SUSTAINED PRODUCTION GROWTH AND EXPORT EXPANSION
- KEY RESTRAINTS
- POTENTIAL DELAYS IN COMMISSIONING TIMELINES IMPACT INITIAL CAPACITY ADDITIONS
- GLOBAL SUPPLY INCREASES FROM MULTIPLE SOURCES, CREATING COMPETITIVE PRESSURES
- GEOPOLITICAL UNCERTAINTIES AFFECT TRADE ROUTES AND MARKET ACCESS
- HIGH CAPITAL INVESTMENTS REQUIRE CAREFUL MANAGEMENT OF FINANCIAL RISKS
- KEY DRIVERS
STRATEGIC MARKET ANALYTICS
- KEY MARKET TRENDS
- QATAR INTEGRATES CARBON CAPTURE TECHNOLOGIES IN EXPANSION PROJECTS FOR SUSTAINABILITY
- FOCUS ON LONG-TERM CONTRACTING ENSURES STABLE DEMAND AMID MARKET SHIFTS
- EXPANSION ENHANCES QATAR’S ROLE IN RESHAPING GLOBAL LNG TRADE PATTERNS
- STRATEGIC INFRASTRUCTURE DEVELOPMENTS SUPPORT EFFICIENT EXPORT OPERATIONS
- PORTER’S FIVE FORCES ANALYSIS
- BUYERS POWER
- SUPPLIERS POWER
- SUBSTITUTION
- NEW ENTRANTS
- INDUSTRY RIVALRY
- GROWTH PROSPECT MAPPING
- GROWTH PROSPECT MAPPING FOR QATAR
- MARKET MATURITY ANALYSIS
- MARKET CONCENTRATION ANALYSIS
- VALUE CHAIN ANALYSIS
- EXPLORATION AND EXTRACTION
- LIQUEFACTION AND PROCESSING
- STORAGE AND TRANSPORTATION
- EXPORT AND DISTRIBUTION
- MARKETING AND SALES
- AFTER-SALES SERVICES
- KEY BUYING CRITERIA
- PRICE COMPETITIVENESS
- SUPPLY RELIABILITY
- QUALITY STANDARDS
- CONTRACT FLEXIBILITY
- FUTURE PROSPECTS OF LNG IN QATAR
- TRADE
- EXPORTS
- IMPORTS
- LNG TERMINALS
- LIST OF LNG EXPORT TERMINALS
- REGULATORY FRAMEWORK AND COMPLIANCE BODIES
- KEY MARKET TRENDS
LIQUEFIED NATURAL GAS (LNG) MARKET BY LNG INFRASTRUCTURE
- LNG LIQUEFACTION PLANTS
- MARKET FORECAST FIGURE
- SEGMENT ANALYSIS
- LNG REGASIFICATION FACILITIES
- MARKET FORECAST FIGURE
- SEGMENT ANALYSIS
- LNG LIQUEFACTION PLANTS
LIQUEFIED NATURAL GAS (LNG) MARKET BY APPLICATION
- TRANSPORTATION
- MARKET FORECAST FIGURE
- SEGMENT ANALYSIS
- INDUSTRIAL FEEDSTOCK
- MARKET FORECAST FIGURE
- SEGMENT ANALYSIS
- POWER GENERATION
- MARKET FORECAST FIGURE
- SEGMENT ANALYSIS
- OTHER APPLICATIONS
- MARKET FORECAST FIGURE
- SEGMENT ANALYSIS
- TRANSPORTATION
LIQUEFIED NATURAL GAS (LNG) MARKET BY MODE OF SUPPLY
- TRUCK
- MARKET FORECAST FIGURE
- SEGMENT ANALYSIS
- TRANSSHIPMENT AND BUNKERING
- MARKET FORECAST FIGURE
- SEGMENT ANALYSIS
- PIPELINE AND RAIL
- MARKET FORECAST FIGURE
- SEGMENT ANALYSIS
- TRUCK
COMPETITIVE LANDSCAPE
- KEY STRATEGIC DEVELOPMENTS
- MERGERS & ACQUISITIONS
- PRODUCT LAUNCHES & DEVELOPMENTS
- PARTNERSHIPS & AGREEMENTS
- BUSINESS EXPANSIONS & DIVESTITURES
- COMPANY PROFILES
- QATARENERGY LNG
- COMPANY OVERVIEW
- PRODUCT LIST
- STRENGTHS & CHALLENGES
- QATARGAS
- COMPANY OVERVIEW
- PRODUCT LIST
- STRENGTHS & CHALLENGES
- EXXONMOBIL
- COMPANY OVERVIEW
- PRODUCT LIST
- STRENGTHS & CHALLENGES
- CONOCOPHILLIPS
- COMPANY OVERVIEW
- PRODUCT LIST
- STRENGTHS & CHALLENGES
- TOTALENERGIES
- COMPANY OVERVIEW
- PRODUCT LIST
- STRENGTHS & CHALLENGES
- NAKILAT
- COMPANY OVERVIEW
- PRODUCT LIST
- STRENGTHS & CHALLENGES
- RASGAS
- COMPANY OVERVIEW
- PRODUCT LIST
- STRENGTHS & CHALLENGES
- QATARENERGY LNG
- KEY STRATEGIC DEVELOPMENTS
LIST OF TABLES
TABLE 1: MARKET SNAPSHOT – LIQUEFIED NATURAL GAS (LNG)
TABLE 2: LIQUEFIED NATURAL GAS (LNG) MARKET REGULATORY FRAMEWORK
TABLE 3: QATAR NATURAL GAS PRODUCTION, 2022-2024 (IN EXAJOULES)
TABLE 4: QATAR NATURAL GAS CONSUMPTION, 2022-2024 (IN EXAJOULES)
TABLE 5: QATAR LNG EXPORTS, 2022-2024 (IN BILLION CUBIC METERS)
TABLE 6: QATAR LNG IMPORTS, 2022-2024 (IN BILLION CUBIC METERS)
TABLE 7: MARKET BY LNG INFRASTRUCTURE, HISTORICAL YEARS, 2022-2024 (IN $ MILLION)
TABLE 8: MARKET BY LNG INFRASTRUCTURE, FORECAST YEARS, 2026-2034 (IN $ MILLION)
TABLE 9: MARKET BY APPLICATION, HISTORICAL YEARS, 2022-2024 (IN $ MILLION)
TABLE 10: MARKET BY APPLICATION, FORECAST YEARS, 2026-2034 (IN $ MILLION)
TABLE 11: MARKET BY MODE OF SUPPLY, HISTORICAL YEARS, 2022-2024 (IN $ MILLION)
TABLE 12: MARKET BY MODE OF SUPPLY, FORECAST YEARS, 2026-2034 (IN $ MILLION)
TABLE 13: KEY PLAYERS OPERATING IN THE QATAR MARKET
TABLE 14: LIST OF MERGERS & ACQUISITIONS
TABLE 15: LIST OF PRODUCT LAUNCHES & DEVELOPMENTS
TABLE 16: LIST OF PARTNERSHIPS & AGREEMENTS
TABLE 17: LIST OF BUSINESS EXPANSIONS & DIVESTITURES
LIST OF FIGURES
FIGURE 1: KEY MARKET TRENDS
FIGURE 2: PORTER’S FIVE FORCES ANALYSIS
FIGURE 3: GROWTH PROSPECT MAPPING FOR QATAR
FIGURE 4: MARKET MATURITY ANALYSIS
FIGURE 5: MARKET CONCENTRATION ANALYSIS
FIGURE 6: VALUE CHAIN ANALYSIS
FIGURE 7: KEY BUYING CRITERIA
FIGURE 8: SEGMENT GROWTH POTENTIAL, BY LNG INFRASTRUCTURE, IN 2025
FIGURE 9: LNG LIQUEFACTION PLANTS MARKET SIZE, 2026-2034 (IN $ MILLION)
FIGURE 10: LNG REGASIFICATION FACILITIES MARKET SIZE, 2026-2034 (IN $ MILLION)
FIGURE 11: SEGMENT GROWTH POTENTIAL, BY APPLICATION, IN 2025
FIGURE 12: TRANSPORTATION MARKET SIZE, 2026-2034 (IN $ MILLION)
FIGURE 13: INDUSTRIAL FEEDSTOCK MARKET SIZE, 2026-2034 (IN $ MILLION)
FIGURE 14: POWER GENERATION MARKET SIZE, 2026-2034 (IN $ MILLION)
FIGURE 15: OTHER APPLICATIONS MARKET SIZE, 2026-2034 (IN $ MILLION)
FIGURE 16: SEGMENT GROWTH POTENTIAL, BY MODE OF SUPPLY, IN 2025
FIGURE 17: TRUCK MARKET SIZE, 2026-2034 (IN $ MILLION)
FIGURE 18: TRANSSHIPMENT AND BUNKERING MARKET SIZE, 2026-2034 (IN $ MILLION)
FIGURE 19: PIPELINE AND RAIL MARKET SIZE, 2026-2034 (IN $ MILLION)
FAQ’s
RELATED REPORTS
-

UNITED STATES AI-DRIVEN CLOUD MIGRATION SERVICES MARKET FORECAST 2026-2034
-

UNITED KINGDOM AI-DRIVEN CLOUD MIGRATION SERVICES MARKET FORECAST 2026-2034
-

UNITED ARAB EMIRATES AI-DRIVEN CLOUD MIGRATION SERVICES MARKET FORECAST 2026-2034
-

SOUTH KOREA AI-DRIVEN CLOUD MIGRATION SERVICES MARKET FORECAST 2026-2034
-

SINGAPORE AI-DRIVEN CLOUD MIGRATION SERVICES MARKET FORECAST 2026-2034
-

SAUDI ARABIA AI-DRIVEN CLOUD MIGRATION SERVICES MARKET FORECAST 2026-2034
-

AUSTRALIA AI-DRIVEN CLOUD MIGRATION SERVICES MARKET FORECAST 2026-2034
-

JAPAN AI-DRIVEN CLOUD MIGRATION SERVICES MARKET FORECAST 2026-2034
-

INDIA AI-DRIVEN CLOUD MIGRATION SERVICES MARKET FORECAST 2026-2034
-

CHINA AI-DRIVEN CLOUD MIGRATION SERVICES MARKET FORECAST 2026-2034