North America Solar Encapsulation Market by Material Type (Ethylene Vinyl Acetate (EVA), Polyolefin Elastomers (POE), Polyvinyl Butyral (PVB), Silicone & Ionomer, Other Material Types) Market by Technology (Module Construction) (Glass-Backsheet, Glass-Glass (Double Glass), Building-Integrated Photovoltaics (BIPV)) Market by Application (Photovoltaics (PV) (Utility-Scale, Commercial & Industrial (C&I), Residential), Transportation & Mobility, Consumer Electronics)
NORTH AMERICA SOLAR ENCAPSULATION MARKET OVERVIEW
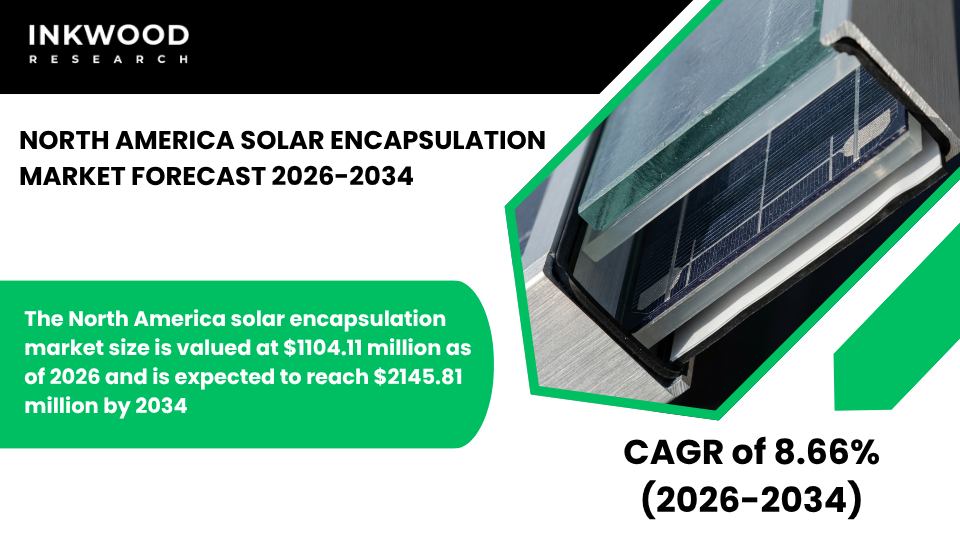
The North America solar encapsulation market size is valued at $1104.11 million as of 2026 and is expected to reach $2145.81 million by 2034, progressing with a CAGR of 8.66% during the forecast years, 2026-2034.
North America’s solar encapsulation market is experiencing robust expansion driven by record-breaking photovoltaic installations and strengthened renewable energy policies across both countries. Federal incentives like the Inflation Reduction Act in the United States and provincial procurement programs in Canada are accelerating solar project economics and module production volumes.
According to the U.S. Department of Energy, the nation installed 26 gigawatts of solar capacity in 2023, representing a 51% increase from 2022. This unprecedented deployment directly translates to surging demand for ethylene-vinyl acetate and advanced polyolefin elastomer encapsulants.
Meanwhile, utility-scale projects dominate the landscape, accounting for the majority of encapsulant consumption due to large module volumes and multi-decade operational requirements. Module manufacturers are simultaneously demanding higher-performance materials to support bifacial designs and building-integrated photovoltaic applications.
The shift toward domestic solar manufacturing, particularly crystalline silicon solar module production, further strengthens regional encapsulant demand. Moreover, declining module costs combined with investment tax credits are making solar installations increasingly competitive with conventional energy sources, thereby boosting overall market momentum.
To Know More About This Report, Request a Free Sample Copy
The North America solar encapsulation market growth assessment includes the analysis of the United States and Canada.
The United States leads North American encapsulant consumption, driven by aggressive solar capacity targets and substantial manufacturing investments. The U.S. Energy Information Administration reports that 107.4 gigawatts of solar generating capacity were operating across the Lower 48 states as of August 2024, with developers planning to add another 24 gigawatts by year-end.
Texas, California, and Florida account for nearly half of the nation’s utility-scale solar fleet, creating concentrated demand for encapsulation materials in these key markets. Furthermore, federal policies have catalyzed domestic solar manufacturing resurgence, with module production tripling during 2024 according to industry data. This manufacturing growth directly benefits encapsulant suppliers through shortened supply chains and reduced import dependencies.
Residential solar installations, though experiencing headwinds from elevated interest rates and California policy changes, still represent substantial encapsulant demand across distributed generation applications. Additionally, commercial and industrial segments are expanding as corporations pursue renewable energy procurement goals through power purchase agreements.
Canada’s solar encapsulation market is gaining momentum as provinces diversify energy portfolios beyond traditional hydroelectric sources. The Canadian Renewable Energy Association confirms that Canada’s solar capacity grew 92% between 2019 and 2024, reaching over 4 gigawatts of utility-scale installations plus more than 1 gigawatt of rooftop systems.
Alberta leads provincial growth, having added 1,391 megawatts of solar capacity in 2022 alone while retiring 5.6 gigawatts of coal-fired generation. Ontario’s long-term procurement programs are attracting billions in solar investment, with projects requiring durable encapsulation solutions suited for harsh winter climates.
Quebec’s first-ever 300-megawatt solar procurement in 2025 signals that even hydro-dominated provinces recognize solar’s economic competitiveness. Behind-the-meter installations across Canada’s nearly 96,000 rooftop systems create additional demand for residential-grade encapsulants that withstand extreme temperature fluctuations and seasonal snow loads.
The North America solar encapsulation market is segmented into material type, technology (module construction), and application. The material type segment is further categorized into ethylene vinyl acetate (EVA), polyolefin elastomers (POE), polyvinyl butyral (PVB), silicone & ionomer, and other material types.
Ethylene-vinyl acetate dominates North America’s solar encapsulation market due to its proven reliability and cost-effectiveness in high-volume manufacturing environments. This copolymer material offers excellent optical clarity, enabling maximum light transmission to crystalline silicon solar cells while maintaining strong adhesion across diverse module designs.
EVA’s processing compatibility with existing lamination infrastructure allows module manufacturers to achieve rapid production throughput without significant capital equipment investments. Moreover, the material performs reliably across North America’s varied climate zones, from Texas desert heat to Canadian winter extremes.
Advanced cross-linked EVA formulations now incorporate specialized additives that improve moisture resistance and reduce potential-induced degradation risks. These enhanced variants are gaining traction in utility-scale projects where 30-year performance warranties require superior long-term durability.
The acetate EVA thermoplastic segment particularly benefits from economies of scale as domestic module production expands. However, premium applications like bifacial modules and building-integrated photovoltaic systems are increasingly specifying polyolefin elastomer alternatives for their superior moisture barrier properties and enhanced PID resistance. This material evolution reflects module makers’ focus on maximizing energy yields throughout extended operational lifetimes.
Some of the top players operating in the North America solar encapsulation market include DuPont de Nemours Inc, 3M Company, Dow Inc, STR Holdings Inc, etc.
DuPont de Nemours Inc operates as a leading specialty materials company with deep expertise in photovoltaic encapsulation technologies. The company manufactures advanced silicone-based encapsulants under its Fortasun brand alongside proven Tedlar frontsheet films that have protected solar modules for over 35 years. DuPont’s product portfolio addresses critical module durability challenges, including UV degradation, moisture ingress, and corrosion protection across utility-scale and residential installations.
Headquartered in Wilmington, Delaware, the company serves global solar manufacturers through technical support centers and established distribution networks across North America. Recent product innovations include flexible solar panel solutions utilizing Tedlar frontsheet technology for consumer applications like recreational vehicles and portable power systems.
DuPont also supplies Solamet metallization pastes that improve solar cell efficiency alongside its encapsulant offerings, providing integrated materials solutions to module manufacturers. The company’s extensive field-testing programs spanning multiple climate zones validate long-term performance claims that support 25-30 year module warranties. This technical credibility positions DuPont as a preferred supplier for premium solar encapsulation applications requiring maximum reliability and proven durability.
REPORT SYNOPSIS
| REPORT SCOPE | DETAILS |
|---|---|
| Market Forecast Years | 2026-2034 |
| Base Year | 2025 |
| Market Historical Years | 2022-2024 |
| Forecast Units | Revenue ($ Million) |
| Segments Analyzed | Material Type, Technology (Module Construction), and Application |
| Countries Analyzed | The United States and Canada |
| Companies Analyzed | DuPont de Nemours Inc, 3M Company, Dow Inc, STR Holdings Inc, Mitsui Chemicals Inc, Bridgestone Corporation, Coveme SpA, Arkema SA, RenewSys India Pvt Ltd, Hangzhou First Applied Material Co Ltd, Kuraray Co Ltd, Eastman Chemical Company |
TABLE OF CONTENTS
RESEARCH SCOPE & METHODOLOGY
- STUDY OBJECTIVES
- METHODOLOGY
- ASSUMPTIONS & LIMITATIONS
EXECUTIVE SUMMARY
- MARKET SIZE & FORECAST
- MARKET OVERVIEW
- SCOPE OF STUDY
- CRISIS SCENARIO ANALYSIS
- MAJOR MARKET FINDINGS
- HIGH ADOPTION OF EVA AND POE ENCAPSULANTS IS DRIVEN BY COST EFFICIENCY AND RELIABLE MODULE PERFORMANCE ACROSS GLOBAL SOLAR INSTALLATIONS
- UTILITY SCALE SOLAR PROJECTS ACCOUNT FOR A SIGNIFICANT SHARE OF ENCAPSULANT DEMAND DUE TO LARGE MODULE VOLUMES AND LONG-TERM DEPLOYMENTS
- TECHNOLOGICAL DIFFERENTIATION AMONG ENCAPSULANT SUPPLIERS IS INCREASING AS MODULE MAKERS DEMAND HIGHER DURABILITY AND LOWER DEGRADATION
MARKET DYNAMICS
- KEY DRIVERS
- RAPID EXPANSION OF SOLAR PV INSTALLATIONS IS DIRECTLY INCREASING DEMAND FOR ENCAPSULATION MATERIALS
- DECLINING SOLAR MODULE PRICES ARE ACCELERATING PROJECT ECONOMICS AND BOOSTING MODULE PRODUCTION VOLUMES
- GOVERNMENT POLICIES AND INCENTIVES PROMOTING RENEWABLE ENERGY ARE SUPPORTING LONG-TERM MARKET GROWTH
- RISING FOCUS ON MODULE LIFETIME AND EFFICIENCY IS DRIVING USE OF ADVANCED ENCAPSULANT FORMULATIONS
- KEY RESTRAINTS
- VOLATILITY IN RAW MATERIAL PRICES SUCH AS POLYMERS, IMPACTS ENCAPSULANT MANUFACTURING COST STRUCTURES
- TECHNICAL COMPATIBILITY ISSUES WITH NEW CELL TECHNOLOGIES CAN LIMIT RAPID ADOPTION OF CERTAIN ENCAPSULANTS
- INTENSE PRICE COMPETITION AMONG SUPPLIERS COMPRESSES MARGINS ACROSS THE VALUE CHAIN
- HIGH-PERFORMANCE MATERIALS OFTEN FACE SLOW QUALIFICATION CYCLES WITH CONSERVATIVE MODULE MANUFACTURERS
- KEY DRIVERS
KEY ANALYTICS
- KEY MARKET TRENDS
- SHIFT TOWARD POE ENCAPSULANTS IS GAINING MOMENTUM DUE TO SUPERIOR MOISTURE AND PID RESISTANCE
- DEMAND FOR ENCAPSULANTS SUITABLE FOR BIFACIAL AND HIGH EFFICIENCY MODULES IS INCREASING
- MANUFACTURERS ARE INVESTING IN THINNER AND LIGHTWEIGHT ENCAPSULATION SOLUTIONS TO REDUCE MODULE COSTS
- SUSTAINABILITY AND RECYCLABILITY CONSIDERATIONS ARE INFLUENCING MATERIAL SELECTION AND PRODUCT DEVELOPMENT
- PORTER’S FIVE FORCES ANALYSIS
- BUYERS POWER
- SUPPLIERS POWER
- SUBSTITUTION
- NEW ENTRANTS
- INDUSTRY RIVALRY
- GROWTH PROSPECT MAPPING
- GROWTH PROSPECT MAPPING FOR NORTH AMERICA
- MARKET MATURITY ANALYSIS
- MARKET CONCENTRATION ANALYSIS
- VALUE CHAIN ANALYSIS
- RAW MATERIAL SUPPLIERS
- POLYMER COMPOUNDING
- ENCAPSULANT MANUFACTURING
- FILM EXTRUSION
- MODULE ASSEMBLY
- SOLAR PROJECT DEPLOYMENT
- KEY BUYING CRITERIA
- LONG-TERM DURABILITY
- CELL COMPATIBILITY
- COST EFFICIENCY
- SUPPLIER RELIABILITY
- REGULATORY FRAMEWORK
- KEY MARKET TRENDS
SOLAR ENCAPSULATION MARKET BY MATERIAL TYPE
- ETHYLENE VINYL ACETATE (EVA)
- POLYOLEFIN ELASTOMERS (POE)
- POLYVINYL BUTYRAL (PVB)
- SILICONE & IONOMER
- OTHER MATERIAL TYPES
SOLAR ENCAPSULATION MARKET BY TECHNOLOGY (MODULE CONSTRUCTION)
- GLASS-BACKSHEET
- GLASS-GLASS (DOUBLE GLASS)
- BUILDING-INTEGRATED PHOTOVOLTAICS (BIPV)
SOLAR ENCAPSULATION MARKET BY APPLICATION
- PHOTOVOLTAICS (PV)
- UTILITY-SCALE
- COMMERCIAL & INDUSTRIAL (C&I)
- RESIDENTIAL
- TRANSPORTATION & MOBILITY
- CONSUMER ELECTRONICS
- PHOTOVOLTAICS (PV)
GEOGRAPHICAL ANALYSIS
- NORTH AMERICA
- MARKET SIZE & ESTIMATES
- NORTH AMERICA MARKET DRIVERS
- NORTH AMERICA MARKET CHALLENGES
- KEY PLAYERS IN NORTH AMERICA SOLAR ENCAPSULATION MARKET
- COUNTRY ANALYSIS
- UNITED STATES
- UNITED STATES MARKET SIZE & OPPORTUNITIES
- CANADA
- CANADA MARKET SIZE & OPPORTUNITIES
- UNITED STATES
- NORTH AMERICA
COMPETITIVE LANDSCAPE
- KEY STRATEGIC DEVELOPMENTS
- MERGERS & ACQUISITIONS
- PRODUCT LAUNCHES & DEVELOPMENTS
- PARTNERSHIPS & AGREEMENTS
- BUSINESS EXPANSIONS & DIVESTITURES
- COMPANY PROFILES
- DUPONT DE NEMOURS INC
- COMPANY OVERVIEW
- PRODUCT LIST
- STRENGTHS & CHALLENGES
- 3M COMPANY
- COMPANY OVERVIEW
- PRODUCT LIST
- STRENGTHS & CHALLENGES
- DOW INC
- COMPANY OVERVIEW
- PRODUCT LIST
- STRENGTHS & CHALLENGES
- STR HOLDINGS INC
- COMPANY OVERVIEW
- PRODUCT LIST
- STRENGTHS & CHALLENGES
- MITSUI CHEMICALS INC
- COMPANY OVERVIEW
- PRODUCT LIST
- STRENGTHS & CHALLENGES
- BRIDGESTONE CORPORATION
- COMPANY OVERVIEW
- PRODUCT LIST
- STRENGTHS & CHALLENGES
- COVEME SPA
- COMPANY OVERVIEW
- PRODUCT LIST
- STRENGTHS & CHALLENGES
- ARKEMA SA
- COMPANY OVERVIEW
- PRODUCT LIST
- STRENGTHS & CHALLENGES
- RENEWSYS INDIA PVT LTD
- COMPANY OVERVIEW
- PRODUCT LIST
- STRENGTHS & CHALLENGES
- HANGZHOU FIRST APPLIED MATERIAL CO LTD
- COMPANY OVERVIEW
- PRODUCT LIST
- STRENGTHS & CHALLENGES
- KURARAY CO LTD
- COMPANY OVERVIEW
- PRODUCT LIST
- STRENGTHS & CHALLENGES
- EASTMAN CHEMICAL COMPANY
- COMPANY OVERVIEW
- PRODUCT LIST
- STRENGTHS & CHALLENGES
- DUPONT DE NEMOURS INC
- KEY STRATEGIC DEVELOPMENTS
LIST OF TABLES
TABLE 1: MARKET SNAPSHOT – SOLAR ENCAPSULATION
TABLE 2: SOLAR ENCAPSULATION MARKET REGULATORY FRAMEWORK
TABLE 3: MARKET BY MATERIAL TYPE, BY REGION, HISTORICAL YEARS, 2022-2024 (IN $ MILLION)
TABLE 4: MARKET BY MATERIAL TYPE, BY REGION, FORECAST YEARS, 2026-2034 (IN $ MILLION)
TABLE 5: MARKET BY TECHNOLOGY (MODULE CONSTRUCTION), BY REGION, HISTORICAL YEARS, 2022-2024 (IN $ MILLION)
TABLE 6: MARKET BY TECHNOLOGY (MODULE CONSTRUCTION), BY REGION, FORECAST YEARS, 2026-2034 (IN $ MILLION)
TABLE 7: MARKET BY APPLICATION, BY REGION, HISTORICAL YEARS, 2022-2024 (IN $ MILLION)
TABLE 8: MARKET BY APPLICATION, BY REGION, FORECAST YEARS, 2026-2034 (IN $ MILLION)
TABLE 9: MARKET BY PHOTOVOLTAICS (PV), BY REGION, HISTORICAL YEARS, 2022-2024 (IN $ MILLION)
TABLE 10: MARKET BY PHOTOVOLTAICS (PV), BY REGION, FORECAST YEARS, 2026-2034 (IN $ MILLION)
TABLE 11: NORTH AMERICA MARKET, COUNTRY ANALYSIS, HISTORICAL YEARS, 2022-2024 (IN $ MILLION)
TABLE 12: NORTH AMERICA MARKET, COUNTRY ANALYSIS, FORECAST YEARS, 2026-2034 (IN $ MILLION)
TABLE 13: KEY PLAYERS OPERATING IN THE NORTH AMERICAN MARKET
TABLE 14: LIST OF MERGERS & ACQUISITIONS
TABLE 15: LIST OF PRODUCT LAUNCHES & DEVELOPMENTS
TABLE 16: LIST OF PARTNERSHIPS & AGREEMENTS
TABLE 17: LIST OF BUSINESS EXPANSIONS & DIVESTITURES
LIST OF FIGURES
FIGURE 1: KEY MARKET TRENDS
FIGURE 2: PORTER’S FIVE FORCES ANALYSIS
FIGURE 3: GROWTH PROSPECT MAPPING FOR NORTH AMERICA
FIGURE 4: MARKET MATURITY ANALYSIS
FIGURE 5: MARKET CONCENTRATION ANALYSIS
FIGURE 6: VALUE CHAIN ANALYSIS
FIGURE 7: KEY BUYING CRITERIA
FIGURE 8: SEGMENT GROWTH POTENTIAL, BY MATERIAL TYPE, IN 2025
FIGURE 9: ETHYLENE VINYL ACETATE (EVA) MARKET SIZE, 2026-2034 (IN $ MILLION)
FIGURE 10: POLYOLEFIN ELASTOMERS (POE) MARKET SIZE, 2026-2034 (IN $ MILLION)
FIGURE 11: POLYVINYL BUTYRAL (PVB) MARKET SIZE, 2026-2034 (IN $ MILLION)
FIGURE 12: SILICONE & IONOMER MARKET SIZE, 2026-2034 (IN $ MILLION)
FIGURE 13: OTHER MATERIAL TYPES MARKET SIZE, 2026-2034 (IN $ MILLION)
FIGURE 14: SEGMENT GROWTH POTENTIAL, BY TECHNOLOGY (MODULE CONSTRUCTION), IN 2025
FIGURE 15: GLASS-BACKSHEET MARKET SIZE, 2026-2034 (IN $ MILLION)
FIGURE 16: GLASS-GLASS (DOUBLE GLASS) MARKET SIZE, 2026-2034 (IN $ MILLION)
FIGURE 17: BUILDING-INTEGRATED PHOTOVOLTAICS (BIPV) MARKET SIZE, 2026-2034 (IN $ MILLION)
FIGURE 18: SEGMENT GROWTH POTENTIAL, BY APPLICATION, IN 2025
FIGURE 19: PHOTOVOLTAICS (PV) MARKET SIZE, 2026-2034 (IN $ MILLION)
FIGURE 20: SEGMENT GROWTH POTENTIAL, BY PHOTOVOLTAICS (PV), IN 2025
FIGURE 21: UTILITY-SCALE MARKET SIZE, 2026-2034 (IN $ MILLION)
FIGURE 22: COMMERCIAL & INDUSTRIAL (C&I) MARKET SIZE, 2026-2034 (IN $ MILLION)
FIGURE 23: RESIDENTIAL MARKET SIZE, 2026-2034 (IN $ MILLION)
FIGURE 24: TRANSPORTATION & MOBILITY MARKET SIZE, 2026-2034 (IN $ MILLION)
FIGURE 25: CONSUMER ELECTRONICS MARKET SIZE, 2026-2034 (IN $ MILLION)
FIGURE 26: NORTH AMERICA SOLAR ENCAPSULATION MARKET, COUNTRY OUTLOOK, 2025 & 2034 (IN %)
FIGURE 27: UNITED STATES MARKET SIZE, 2026-2034 (IN $ MILLION)
FIGURE 28: CANADA MARKET SIZE, 2026-2034 (IN $ MILLION)
FAQ’s
RELATED REPORTS
-
NORTH AMERICA 3D CELL CULTURE MARKET FORECAST 2026
-
TURKEY SOLAR ENCAPSULATION MARKET FORECAST 2026-2034
-
UNITED STATES SOLAR ENCAPSULATION MARKET FORECAST 2026-2034
-
JAPAN SOLAR ENCAPSULATION MARKET FORECAST 2026-2034
-
ASIA-PACIFIC SOLAR ENCAPSULATION MARKET FORECAST 2026-2034
-
EUROPE SOLAR ENCAPSULATION MARKET FORECAST 2026-2034
-
GLOBAL SOLAR ENCAPSULATION MARKET FORECAST 2026-2034
-
UNITED STATES WIND ENERGY MARKET FORECAST 2026-2034
-
CANADA WIND ENERGY MARKET FORECAST 2026-2034
-
GERMANY WIND ENERGY MARKET FORECAST 2026-2034