The Netherlands Green Hydrogen Market by Technology (Alkaline Electrolyzer, Polymer Electrolyte Membrane (PEM) Electrolyzer, SOEC Electrolyzer), Market by Application (Power Generation, Transport, Other Applications), Market by Distribution Channel (Pipeline, Cargo), by Geography
THE NETHERLANDS GREEN HYDROGEN MARKET OVERVIEW
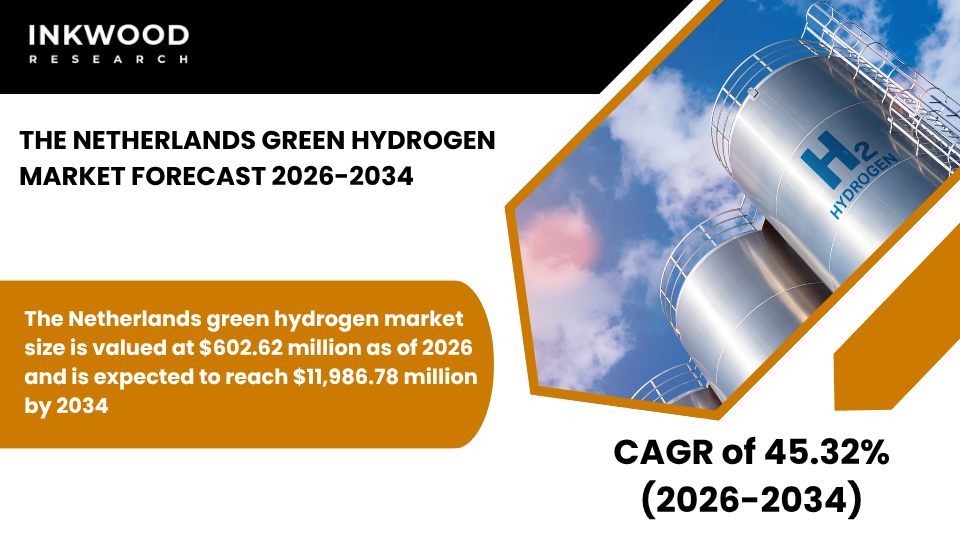
The Netherlands green hydrogen market size is valued at $602.62 million as of 2026 and is expected to reach $11,986.78 million by 2034, progressing with a CAGR of 45.32% during the forecast years, 2026-2034.
The Netherlands is establishing itself as Europe’s premier green hydrogen import and distribution hub, driven by comprehensive government support aligned with European Union decarbonization mandates. The Dutch government has committed substantial subsidies through the SDE++ scheme, which provides operational support for renewable energy and green hydrogen projects.
Moreover, national hydrogen strategy initiatives target 3-4 GW of domestic electrolyzer capacity by 2030, complemented by import infrastructure development. These policy frameworks create investment certainty that attracts both domestic and international energy companies to establish operations within Dutch borders.
Furthermore, alignment with EU regulations ensures seamless integration into broader European hydrogen networks and markets. Consequently, this coordinated policy approach positions the Netherlands as a strategic gateway for hydrogen flows across continental Europe.
Extensive existing gas pipeline infrastructure provides the Netherlands with a unique competitive advantage for hydrogen transport and distribution. The country’s dense natural gas network, developed over decades to support Europe’s energy supply, offers immediate retrofitting opportunities for hydrogen conveyance. According to Gasunie, the national gas transmission operator, existing pipelines can transport hydrogen blends and are undergoing systematic conversion for pure hydrogen service.
This infrastructure readiness eliminates significant capital expenditure barriers that constrain hydrogen market development in other regions. Additionally, underground salt cavern formations along the coast provide substantial storage capacity essential for balancing supply and demand fluctuations.
These geological advantages enable large-scale seasonal storage that supports both domestic consumption and international trade operations. Therefore, infrastructure endowments accelerate market development timelines compared to countries requiring greenfield network construction.
Proximity to major industrial clusters ensures stable anchor demand that underpins production facility investments and operational viability. The Rotterdam-Antwerp industrial corridor hosts Europe’s largest concentration of chemical plants, refineries, and steel production facilities. These industries currently consume significant grey hydrogen volumes for various manufacturing processes, representing immediate conversion opportunities for green alternatives.
To Know More About This Report, Request a Free Sample Copy
Furthermore, industrial decarbonization mandates under the EU Emissions Trading System create regulatory pressure that incentivizes switching to clean hydrogen feedstocks. Companies face rising carbon prices that progressively improve the economic competitiveness of green hydrogen versus conventional fossil-based alternatives.
This regulatory mechanism directly translates into predictable demand growth, reducing market uncertainty for electrolyzer project developers. Subsequently, industrial clustering combined with carbon pricing establishes favorable conditions for large-scale green hydrogen deployment.
Rising carbon prices under the EU ETS are fundamentally improving green hydrogen competitiveness by increasing the cost differential between clean and fossil-based production methods. Current carbon allowances trade above €80 per ton, adding substantial expense to grey hydrogen production through steam methane reforming.
Moreover, regulatory trajectories indicate continued price increases as emission caps tighten progressively toward 2030 and beyond. This cost dynamic progressively narrows the price gap between green and grey hydrogen, accelerating economic parity timelines.
Furthermore, industries subject to carbon border adjustment mechanisms face additional incentives to adopt clean hydrogen to maintain export competitiveness. Therefore, evolving carbon pricing mechanisms serve as powerful market enablers that complement direct production subsidies.
Offshore wind power constitutes the primary renewable energy source supporting large-scale electrolysis operations across Dutch territory. The Netherlands benefits from exceptional North Sea wind resources that enable high-capacity factor installations producing a consistent electricity supply.
According to the Netherlands Enterprise Agency, offshore wind capacity is projected to reach 21 GW by 2030, providing substantial clean electricity for hydrogen production. Additionally, offshore wind farms are increasingly incorporating direct electrolyzer connections that eliminate transmission infrastructure requirements and associated energy losses.
This co-location strategy optimizes overall system efficiency while reducing project complexity and permitting challenges. Moreover, maritime locations address land scarcity constraints that otherwise limit renewable energy development in the densely populated Dutch mainland. Consequently, offshore wind integration creates scalable pathways for expanding green hydrogen production capacity throughout the forecast period.
The Netherlands green hydrogen market is segmented into technology, application, and distribution channel. The application segment is further categorized into power generation, transport, and other applications.
Other applications represent a significant and rapidly expanding segment within the Netherlands green hydrogen market, encompassing industrial feedstock uses, residential heating, and various specialty applications. This category primarily includes hydrogen consumption in chemical manufacturing, petroleum refining, food processing, and emerging uses in industrial heat generation.
Dutch chemical producers, concentrated heavily in the Rotterdam industrial complex, require substantial hydrogen volumes for ammonia synthesis, methanol production, and various hydrogenation processes. Furthermore, petroleum refineries utilize hydrogen extensively for crude oil desulfurization and upgrading operations essential to meet stringent fuel quality standards.
These established industrial applications provide immediate commercialization pathways that bypass technology adoption barriers present in nascent sectors like transport. Additionally, pilot programs are exploring hydrogen blending in existing natural gas networks for residential and commercial heating applications. The Port of Rotterdam Authority is actively developing infrastructure to support these diverse applications through centralized hydrogen production and distribution hubs.
Moreover, specialty applications in electronics manufacturing, glass production, and metallurgical processes represent smaller but strategically important demand segments. This diversity creates resilient market foundations that distribute risk across multiple industries and application scenarios, supporting stable long-term growth trajectories.
Some of the top players operating in the Netherlands green hydrogen market include Shell, Air Liquide, Siemens Energy, and ENGIE.
Shell operates as an integrated global energy company with substantial operations spanning conventional oil and gas alongside rapidly expanding renewable energy and hydrogen initiatives. The company maintains its headquarters in London, United Kingdom, while operating extensive downstream and midstream infrastructure throughout the Netherlands, particularly in the Rotterdam area. Shell’s product portfolio encompasses petroleum refining, chemical manufacturing, natural gas trading, and increasingly, renewable electricity generation and hydrogen production technologies.
Moreover, the company is developing Holland Hydrogen I, Europe’s largest renewable hydrogen plant located in the Port of Rotterdam, featuring a 200 MW electrolyzer powered by offshore wind. This facility demonstrates Shell’s commitment to establishing leadership positions in emerging green hydrogen markets while leveraging existing infrastructure assets.
Furthermore, Shell’s integrated business model combines production capabilities with established distribution networks, industrial customer relationships, and international trading expertise. The company’s strategic approach focuses on creating complete hydrogen value chains that span renewable power generation through end-use applications, positioning it advantageously to capture opportunities across multiple market segments throughout the Netherlands and broader European markets.
REPORT SYNOPSIS
| REPORT SCOPE | DETAILS |
|---|---|
| Market Forecast Years | 2026-2034 |
| Base Year | 2025 |
| Market Historical Years | 2022-2024 |
| Forecast Units | Revenue ($ Million) |
| Segments Analyzed | Technology, Application, and Distribution Channel |
| Country Analyzed | The Netherlands |
| Companies Analyzed | Air Liquide, ENGIE, Linde PLC, McPhy Energy SA, Plug Power, Shell, Siemens Energy, TotalEnergies, Uniper SE |
TABLE OF CONTENTS
RESEARCH SCOPE & METHODOLOGY
- STUDY OBJECTIVES
- METHODOLOGY
- ASSUMPTIONS & LIMITATIONS
EXECUTIVE SUMMARY
- MARKET SIZE & FORECAST
- MARKET OVERVIEW
- SCOPE OF STUDY
- CRISIS SCENARIO ANALYSIS
- MAJOR MARKET FINDINGS
- THE NETHERLANDS IS POSITIONED AS A EUROPEAN GREEN HYDROGEN IMPORT AND DISTRIBUTION HUB
- OFFSHORE WIND POWER IS THE PRIMARY RENEWABLE SOURCE SUPPORTING LARGE-SCALE ELECTROLYSIS
- PORTS SUCH AS ROTTERDAM ARE CENTRAL TO HYDROGEN PRODUCTION, STORAGE, AND TRANSPORT ACTIVITIES
- INDUSTRIAL DECARBONIZATION IN REFINING AND CHEMICALS IS THE MAIN DEMAND DRIVER
MARKET DYNAMICS
- KEY DRIVERS
- STRONG GOVERNMENT SUPPORT THROUGH SUBSIDIES AND EU-ALIGNED DECARBONIZATION POLICIES
- EXTENSIVE GAS PIPELINE INFRASTRUCTURE ENABLES HYDROGEN RETROFITTING AND TRANSPORT
- PROXIMITY TO MAJOR INDUSTRIAL CLUSTERS ENSURES STABLE ANCHOR DEMAND
- RISING CARBON PRICES UNDER THE EU ETS IMPROVE GREEN HYDROGEN COMPETITIVENESS
- KEY RESTRAINTS
- LIMITED DOMESTIC RENEWABLE LAND AVAILABILITY CONSTRAINS LOCAL PRODUCTION SCALE
- HIGH ELECTRICITY PRICES IMPACT SHORT-TERM COST COMPETITIVENESS
- DEPENDENCE ON IMPORTED GREEN HYDROGEN CREATES SUPPLY SECURITY RISKS
- COMPLEX PERMITTING AND LENGTHY APPROVAL PROCESSES CAN DELAY PROJECT TIMELINES
- KEY DRIVERS
KEY ANALYTICS
- KEY MARKET TRENDS
- DEVELOPMENT OF CROSS-BORDER HYDROGEN CORRIDORS IS ACCELERATING
- PORT-BASED ELECTROLYZER PROJECTS ARE GAINING PROMINENCE
- HYDROGEN IMPORT AGREEMENTS WITH AFRICA AND THE MIDDLE EAST ARE EXPANDING
- INCREASING USE OF HYDROGEN IN INDUSTRIAL HEAT AND FEEDSTOCK APPLICATIONS
- PORTER’S FIVE FORCES ANALYSIS
- BUYERS POWER
- SUPPLIERS POWER
- SUBSTITUTION
- NEW ENTRANTS
- INDUSTRY RIVALRY
- GROWTH PROSPECT MAPPING
- GROWTH PROSPECT MAPPING FOR THE NETHERLANDS
- MARKET MATURITY ANALYSIS
- MARKET CONCENTRATION ANALYSIS
- VALUE CHAIN ANALYSIS
- RENEWABLE POWER GENERATION
- ELECTROLYZER MANUFACTURING
- HYDROGEN PRODUCTION
- COMPRESSION AND STORAGE
- TRANSPORT AND LOGISTICS
- END USE APPLICATIONS
- KEY BUYING CRITERIA
- LEVELIZED HYDROGEN COST
- SUPPLY RELIABILITY
- TECHNOLOGY EFFICIENCY
- POLICY INCENTIVE ACCESS
- REGULATORY FRAMEWORK
- KEY MARKET TRENDS
GREEN HYDROGEN MARKET BY TECHNOLOGY
- ALKALINE ELECTROLYZER
- MARKET FORECAST FIGURE
- SEGMENT ANALYSIS
- POLYMER ELECTROLYTE MEMBRANE (PEM) ELECTROLYZER
- MARKET FORECAST FIGURE
- SEGMENT ANALYSIS
- SOEC ELECTROLYZER
- MARKET FORECAST FIGURE
- SEGMENT ANALYSIS
- ALKALINE ELECTROLYZER
GREEN HYDROGEN MARKET BY APPLICATION
- POWER GENERATION
- MARKET FORECAST FIGURE
- SEGMENT ANALYSIS
- TRANSPORT
- MARKET FORECAST FIGURE
- SEGMENT ANALYSIS
- OTHER APPLICATIONS
- MARKET FORECAST FIGURE
- SEGMENT ANALYSIS
- POWER GENERATION
GREEN HYDROGEN MARKET BY DISTRIBUTION CHANNEL
- PIPELINE
- MARKET FORECAST FIGURE
- SEGMENT ANALYSIS
- CARGO
- MARKET FORECAST FIGURE
- SEGMENT ANALYSIS
- PIPELINE
COUNTRY ANALYSIS
- NETHERLANDS
- NETHERLANDS ENERGY PROFILE
- IMPORTANT INSTITUTIONS & POLICIES FOR THE ENERGY SECTOR IN THE NETHERLANDS
- NETHERLANDS GREEN HYDROGEN INDUSTRY: OVERVIEW
- GREEN HYDROGEN PROJECTS IN THE NETHERLANDS
- NETHERLANDS
COMPETITIVE LANDSCAPE
- KEY STRATEGIC DEVELOPMENTS
- MERGERS & ACQUISITIONS
- PRODUCT LAUNCHES & DEVELOPMENTS
- PARTNERSHIPS & AGREEMENTS
- BUSINESS EXPANSIONS & DIVESTITURES
- COMPANY PROFILES
- AIR LIQUIDE
- COMPANY OVERVIEW
- PRODUCT LIST
- STRENGTHS & CHALLENGES
- ENGIE
- COMPANY OVERVIEW
- PRODUCT LIST
- STRENGTHS & CHALLENGES
- LINDE PLC
- COMPANY OVERVIEW
- PRODUCT LIST
- STRENGTHS & CHALLENGES
- MCPHY ENERGY SA
- COMPANY OVERVIEW
- PRODUCT LIST
- STRENGTHS & CHALLENGES
- PLUG POWER
- COMPANY OVERVIEW
- PRODUCT LIST
- STRENGTHS & CHALLENGES
- SHELL
- COMPANY OVERVIEW
- PRODUCT LIST
- STRENGTHS & CHALLENGES
- SIEMENS ENERGY
- COMPANY OVERVIEW
- PRODUCT LIST
- STRENGTHS & CHALLENGES
- TOTAL
- COMPANY OVERVIEW
- PRODUCT LIST
- STRENGTHS & CHALLENGES
- UNIPER SE
- COMPANY OVERVIEW
- PRODUCT LIST
- STRENGTHS & CHALLENGES
- AIR LIQUIDE
- KEY STRATEGIC DEVELOPMENTS
LIST OF TABLES
TABLE 1: MARKET SNAPSHOT – GREEN HYDROGEN
TABLE 2: GREEN HYDROGEN MARKET REGULATORY FRAMEWORK
TABLE 3: MARKET BY TECHNOLOGY, HISTORICAL YEARS, 2022-2024 (IN $ MILLION)
TABLE 4: MARKET BY TECHNOLOGY, FORECAST YEARS, 2026-2034 (IN $ MILLION)
TABLE 5: MARKET BY TECHNOLOGY, HISTORICAL YEARS, 2022-2024 (IN KILOTONS)
TABLE 6: MARKET BY TECHNOLOGY, FORECAST YEARS, 2026-2034 (IN KILOTONS)
TABLE 7: ALKALINE ELECTROLYZER MARKET, HISTORICAL YEARS, 2022-2024 (IN $ MILLION)
TABLE 8: ALKALINE ELECTROLYZER MARKET, FORECAST YEARS, 2026-2034 (IN $ MILLION)
TABLE 9: ALKALINE ELECTROLYZER MARKET, HISTORICAL YEARS, 2022-2024 (IN KILOTONS)
TABLE 10: ALKALINE ELECTROLYZER MARKET, FORECAST YEARS, 2026-2034 (IN KILOTONS)
TABLE 11: POLYMER ELECTROLYTE MEMBRANE (PEM) ELECTROLYZER MARKET, HISTORICAL YEARS, 2022-2024 (IN $ MILLION)
TABLE 12: POLYMER ELECTROLYTE MEMBRANE (PEM) ELECTROLYZER MARKET, FORECAST YEARS, 2026-2034 (IN $ MILLION)
TABLE 13: POLYMER ELECTROLYTE MEMBRANE (PEM) ELECTROLYZER MARKET, HISTORICAL YEARS, 2022-2024 (IN KILOTONS)
TABLE 14: POLYMER ELECTROLYTE MEMBRANE (PEM) ELECTROLYZER MARKET, FORECAST YEARS, 2026-2034 (IN KILOTONS)
TABLE 15: SOEC ELECTROLYZER MARKET, HISTORICAL YEARS, 2022-2024 (IN $ MILLION)
TABLE 16: SOEC ELECTROLYZER MARKET, FORECAST YEARS, 2026-2034 (IN $ MILLION)
TABLE 17: SOEC ELECTROLYZER MARKET, HISTORICAL YEARS, 2022-2024 (IN KILOTONS)
TABLE 18: SOEC ELECTROLYZER MARKET, FORECAST YEARS, 2026-2034 (IN KILOTONS)
TABLE 19: MARKET BY APPLICATION, HISTORICAL YEARS, 2022-2024 (IN $ MILLION)
TABLE 20: MARKET BY APPLICATION, FORECAST YEARS, 2026-2034 (IN $ MILLION)
TABLE 21: MARKET BY APPLICATION, HISTORICAL YEARS, 2022-2024 (IN KILOTONS)
TABLE 22: MARKET BY APPLICATION, FORECAST YEARS, 2026-2034 (IN KILOTONS)
TABLE 23: POWER GENERATION MARKET, HISTORICAL YEARS, 2022-2024 (IN $ MILLION)
TABLE 24: POWER GENERATION MARKET, FORECAST YEARS, 2026-2034 (IN $ MILLION)
TABLE 25: POWER GENERATION MARKET, HISTORICAL YEARS, 2022-2024 (IN KILOTONS)
TABLE 26: POWER GENERATION MARKET, FORECAST YEARS, 2026-2034 (IN KILOTONS)
TABLE 27: TRANSPORT MARKET, HISTORICAL YEARS, 2022-2024 (IN $ MILLION)
TABLE 28: TRANSPORT MARKET, FORECAST YEARS, 2026-2034 (IN $ MILLION)
TABLE 29: TRANSPORT MARKET, HISTORICAL YEARS, 2022-2024 (IN KILOTONS)
TABLE 30: TRANSPORT MARKET, FORECAST YEARS, 2026-2034 (IN KILOTONS)
TABLE 31: OTHER APPLICATIONS MARKET, HISTORICAL YEARS, 2022-2024 (IN $ MILLION)
TABLE 32: OTHER APPLICATIONS MARKET, FORECAST YEARS, 2026-2034 (IN $ MILLION)
TABLE 33: OTHER APPLICATIONS MARKET, HISTORICAL YEARS, 2022-2024 (IN KILOTONS)
TABLE 34: OTHER APPLICATIONS MARKET, FORECAST YEARS, 2026-2034 (IN KILOTONS)
TABLE 35: MARKET BY DISTRIBUTION CHANNEL, HISTORICAL YEARS, 2022-2024 (IN $ MILLION)
TABLE 36: MARKET BY DISTRIBUTION CHANNEL, FORECAST YEARS, 2026-2034 (IN $ MILLION)
TABLE 37: MARKET BY DISTRIBUTION CHANNEL, HISTORICAL YEARS, 2022-2024 (IN KILOTONS)
TABLE 38: MARKET BY DISTRIBUTION CHANNEL, FORECAST YEARS, 2026-2034 (IN KILOTONS)
TABLE 39: PIPELINE MARKET, HISTORICAL YEARS, 2022-2024 (IN $ MILLION)
TABLE 40: PIPELINE MARKET, FORECAST YEARS, 2026-2034 (IN $ MILLION)
TABLE 41: PIPELINE MARKET, HISTORICAL YEARS, 2022-2024 (IN KILOTONS)
TABLE 42: PIPELINE MARKET, FORECAST YEARS, 2026-2034 (IN KILOTONS)
TABLE 43: CARGO MARKET, HISTORICAL YEARS, 2022-2024 (IN $ MILLION)
TABLE 44: CARGO MARKET, FORECAST YEARS, 2026-2034 (IN $ MILLION)
TABLE 45: CARGO MARKET, HISTORICAL YEARS, 2022-2024 (IN KILOTONS)
TABLE 46: CARGO MARKET, FORECAST YEARS, 2026-2034 (IN KILOTONS)
TABLE 47: KEY PLAYERS OPERATING IN THE NETHERLANDS MARKET
TABLE 48: LIST OF MERGERS & ACQUISITIONS
TABLE 49: LIST OF PRODUCT LAUNCHES & DEVELOPMENTS
TABLE 50: LIST OF PARTNERSHIPS & AGREEMENTS
TABLE 51: LIST OF BUSINESS EXPANSIONS & DIVESTITURES
LIST OF FIGURES
FIGURE 1: KEY MARKET TRENDS
FIGURE 2: PORTER’S FIVE FORCES ANALYSIS
FIGURE 3: GROWTH PROSPECT MAPPING FOR THE NETHERLANDS
FIGURE 4: MARKET MATURITY ANALYSIS
FIGURE 5: MARKET CONCENTRATION ANALYSIS
FIGURE 6: VALUE CHAIN ANALYSIS
FIGURE 7: KEY BUYING CRITERIA
FIGURE 8: SEGMENT GROWTH POTENTIAL, BY TECHNOLOGY, IN 2025
FIGURE 9: ALKALINE ELECTROLYZER MARKET SIZE, 2026-2034 (IN $ MILLION)
FIGURE 10: POLYMER ELECTROLYTE MEMBRANE (PEM) ELECTROLYZER MARKET SIZE, 2026-2034 (IN $ MILLION)
FIGURE 11: SOEC ELECTROLYZER MARKET SIZE, 2026-2034 (IN $ MILLION)
FIGURE 12: SEGMENT GROWTH POTENTIAL, BY APPLICATION, IN 2025
FIGURE 13: POWER GENERATION MARKET SIZE, 2026-2034 (IN $ MILLION)
FIGURE 14: TRANSPORT MARKET SIZE, 2026-2034 (IN $ MILLION)
FIGURE 15: OTHER APPLICATIONS MARKET SIZE, 2026-2034 (IN $ MILLION)
FIGURE 16: SEGMENT GROWTH POTENTIAL, BY DISTRIBUTION CHANNEL, IN 2025
FIGURE 17: PIPELINE MARKET SIZE, 2026-2034 (IN $ MILLION)
FIGURE 18: CARGO MARKET SIZE, 2026-2034 (IN $ MILLION)
FIGURE 19: NETHERLANDS GREEN HYDROGEN MARKET, COUNTRY OUTLOOK, 2025 & 2034 (IN %)
FAQ’s
RELATED REPORTS
-
UNITED STATES AI-DRIVEN CLOUD MIGRATION SERVICES MARKET FORECAST 2026-2034
-
UNITED KINGDOM AI-DRIVEN CLOUD MIGRATION SERVICES MARKET FORECAST 2026-2034
-

UNITED ARAB EMIRATES AI-DRIVEN CLOUD MIGRATION SERVICES MARKET FORECAST 2026-2034
-

SOUTH KOREA AI-DRIVEN CLOUD MIGRATION SERVICES MARKET FORECAST 2026-2034
-

SINGAPORE AI-DRIVEN CLOUD MIGRATION SERVICES MARKET FORECAST 2026-2034
-

SAUDI ARABIA AI-DRIVEN CLOUD MIGRATION SERVICES MARKET FORECAST 2026-2034
-

AUSTRALIA AI-DRIVEN CLOUD MIGRATION SERVICES MARKET FORECAST 2026-2034
-

JAPAN AI-DRIVEN CLOUD MIGRATION SERVICES MARKET FORECAST 2026-2034
-
INDIA AI-DRIVEN CLOUD MIGRATION SERVICES MARKET FORECAST 2026-2034
-
CHINA AI-DRIVEN CLOUD MIGRATION SERVICES MARKET FORECAST 2026-2034