Italy Liquefied Natural Gas (LNG) Market by LNG Infrastructure (LNG Liquefaction Plants, LNG Regasification Facilities, LNG Shipping & Transportation) Market by Application (Transportation, Industrial Feedstock, Power Generation, Other Applications) Market by Mode of Supply (Truck, Transshipment and Bunkering, Pipeline and Rail)
ITALY LIQUEFIED NATURAL GAS (LNG) MARKET OVERVIEW
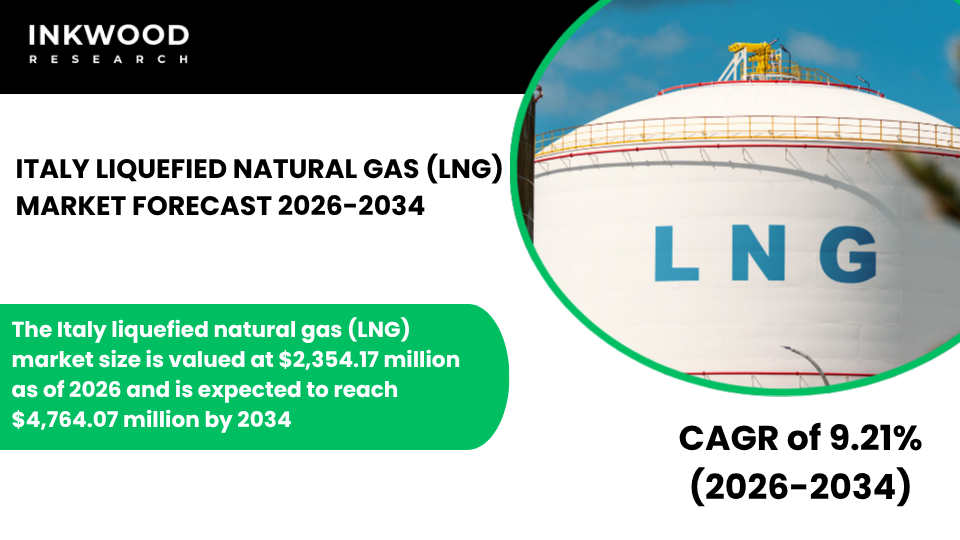
The Italy liquefied natural gas (LNG) market size is valued at $2,354.17 million as of 2026 and is expected to reach $4,764.07 million by 2034, progressing with a CAGR of 9.21% during the forecast years, 2026-2034.
Italy’s energy landscape has undergone a significant transformation as the country actively reduces its historical dependence on pipeline gas imports while simultaneously strengthening its position as a key liquefied natural gas gateway for Southern Europe. This strategic shift reflects broader European energy security priorities that gained urgency following geopolitical disruptions affecting traditional supply routes.
Consequently, Italian policymakers and energy companies have accelerated investments in regasification infrastructure to enhance import capacity and diversify supply sources. According to the Italian Ministry of Environment and Energy Security, the government supports LNG development as an essential component of the nation’s transition toward cleaner energy systems while maintaining grid reliability and industrial competitiveness.
Regasification facilities positioned along Italy’s extensive coastline serve as critical entry points for liquefied natural gas arriving from diverse international suppliers. These terminals process cargoes from the United States, Qatar, Algeria, and other producing regions, thereby reducing the concentration risk that previously characterized Italy’s energy imports.
Furthermore, floating storage and regasification units provide operational flexibility that enables rapid response to changing market conditions and seasonal demand variations. The natural gas market benefits from this infrastructure expansion, which creates redundancy and enhances overall system resilience against supply disruptions. Meanwhile, existing terminals undergo capacity upgrades to accommodate growing volumes without requiring entirely new greenfield developments.
Power generation remains the dominant application driving Italy’s liquefied natural gas consumption patterns as the country phases out coal-fired capacity while renewable energy sources continue scaling up. Gas-fired plants deliver the flexible generation needed to balance intermittent wind and solar output, ensuring grid stability during peak demand periods and weather-related production gaps.
To Know More About This Report, Request a Free Sample Copy
Additionally, combined-cycle gas turbine technology achieves thermal efficiencies that surpass conventional coal plants, supporting Italy’s carbon reduction commitments under European Union climate frameworks. According to Terna, Italy’s transmission system operator, natural gas plays an indispensable role in maintaining electricity system reliability as the energy transition accelerates.
Industrial applications constitute another significant consumption segment, particularly within Italy’s manufacturing heartland, where energy-intensive processes require reliable fuel power supplies. Chemical plants, refineries, and specialty materials producers depend on natural gas as both an energy source and essential feedstock for production operations.
The ceramic tile industry, concentrated in northern regions, particularly values gas-based heating systems for their precision temperature control and product quality advantages. Similarly, glass manufacturers and metal processing facilities increasingly adopt liquefied natural gas to meet stringent environmental regulations while maintaining competitive production costs. These industrial consumers carefully balance their procurement strategies between long-term contracts and spot market purchases to optimize total energy expenditure.
Transportation fuel applications represent an emerging growth opportunity within Italy’s liquefied natural gas ecosystem, driven by maritime sector initiatives to reduce emissions from shipping activities. Major ports along the Tyrrhenian and Adriatic coasts are developing LNG bunkering capabilities to serve vessels transitioning away from heavy fuel oil in compliance with international emission standards.
Furthermore, the heavy-duty trucking sector explores natural gas as an alternative to diesel for long-haul freight operations, particularly on routes connecting industrial zones with export terminals. However, infrastructure availability remains the primary constraint limiting broader adoption across these transportation fuel segments, requiring coordinated investment from both public authorities and private operators.
Italy’s procurement strategy emphasizes supply diversification and contract flexibility to navigate volatile global liquefied natural gas markets effectively. Energy companies increasingly participate in spot trading alongside traditional long-term agreements, enabling them to capitalize on favorable pricing opportunities while maintaining baseline security through contracted volumes.
This balanced approach helps manage price volatility that can significantly impact consumer costs and industrial competitiveness. Moreover, Italian buyers actively engage with emerging LNG suppliers to expand their portfolio beyond established sources, thereby enhancing negotiating leverage and reducing dependence on any single region or supplier.
Pipeline networks distribute the majority of regasified liquefied natural gas from coastal terminals to inland consumption centers across northern and central Italy. These transmission systems connect seamlessly with broader European gas infrastructure, enabling Italy to function as both an importer and transit country for neighboring markets.
Consequently, the mode of supply infrastructure serves dual purposes by meeting domestic requirements while supporting regional energy security objectives. Storage facilities integrated within the pipeline network provide seasonal flexibility, allowing operators to inject gas during low-demand periods and withdraw supplies when consumption peaks during winter months.
The Italy liquefied natural gas (LNG) market is segmented into LNG infrastructure, application, and mode of supply. The LNG infrastructure segment is further categorized into LNG liquefaction plants and LNG regasification facilities.
Regasification facilities dominate Italy’s liquefied natural gas infrastructure landscape, reflecting the country’s position as an import-dependent market with minimal domestic production capacity. These installations transform cryogenic LNG back into gaseous form for injection into the national pipeline system, thereby enabling distribution to end users throughout the country.
Offshore terminals provide environmental and safety advantages by maintaining distance from densely populated coastal areas while still connecting efficiently to onshore transmission networks. Meanwhile, onshore facilities offer higher throughput capacity and operational reliability, making them suitable for baseload import volumes under long-term supply contracts. Technological advancements in regasification processes continue to improve thermal efficiency and reduce energy consumption during the conversion process itself.
Additionally, operators invest in storage capacity expansion to buffer against short-term supply interruptions and provide greater flexibility in cargo scheduling. These infrastructure assets require substantial capital investment and regulatory approvals, creating significant barriers to entry that protect existing operators while limiting rapid capacity expansion.
Some of the top players operating in the Italy liquefied natural gas (LNG) market include Snam, Eni, Edison, and Excelerate Energy, etc.
Snam operates as Italy’s primary natural gas infrastructure company, managing the national transmission network alongside strategic regasification and storage assets. Headquartered in San Donato Milanese, the company plays a central role in Italy’s energy security by ensuring reliable gas delivery to power plants, industrial facilities, and residential consumers nationwide. Snam’s business model integrates regulated transmission operations with competitive regasification services, creating stable revenue streams while supporting market development.
The company manages major LNG terminals, including facilities in Tuscany and Liguria that process substantial import volumes from diverse international suppliers. Furthermore, Snam actively pursues hydrogen infrastructure development and biomethane integration projects as part of its strategy to support Italy’s decarbonization objectives beyond traditional natural gas operations.
REPORT SYNOPSIS
| REPORT SCOPE | DETAILS |
|---|---|
| Market Forecast Years | 2026-2034 |
| Base Year | 2025 |
| Market Historical Years | 2022-2024 |
| Forecast Units | Revenue ($ Million) |
| Segments Analyzed | LNG Infrastructure, Application, and Mode of Supply |
| Country Analyzed | Italy |
| Companies Analyzed | Eni, Snam, Excelerate Energy, Edison, VTTI, Terminale GNL Adriatico, Liquigas |
TABLE OF CONTENTS
RESEARCH SCOPE & METHODOLOGY
- STUDY OBJECTIVES
- METHODOLOGY
- ASSUMPTIONS & LIMITATIONS
EXECUTIVE SUMMARY
- MARKET SIZE, SHARE & ESTIMATES
- MARKET OVERVIEW
- SCOPE OF STUDY
- CRISIS SCENARIO ANALYSIS
- MAJOR MARKET FINDINGS
- ITALY RELIES ON LNG IMPORTS TO DIVERSIFY ENERGY SOURCES AND ENHANCE SUPPLY SECURITY
- EXPANDED REGASIFICATION INFRASTRUCTURE SUPPORTS INCREASED LNG RECEIVING CAPACITY
- LNG SERVES AS A KEY TRANSITION FUEL IN ITALY’S ENERGY MIX AMID DECARBONIZATION EFFORTS
- IMPORT VOLUMES FROM DIVERSE SUPPLIERS STRENGTHEN ENERGY RESILIENCE
MARKET DYNAMICS
- KEY DRIVERS
- REDUCED DEPENDENCE ON PIPELINE GAS DRIVES HIGHER LNG IMPORT REQUIREMENTS
- GROWING DEMAND FROM POWER GENERATION SUPPORTS LNG UTILIZATION
- INFRASTRUCTURE INVESTMENTS IN TERMINALS FACILITATE GREATER IMPORT VOLUMES
- EUROPEAN ENERGY SECURITY PRIORITIES BOOST LNG AS A STRATEGIC RESOURCE
- KEY RESTRAINTS
- COMPETITION FOR GLOBAL LNG CARGOES IMPACTS PROCUREMENT COSTS
- INFRASTRUCTURE CONSTRAINTS LIMIT FURTHER RAPID IMPORT EXPANSION
- TRANSITION TO RENEWABLES MAY MODERATE LONG-TERM LNG DEMAND GROWTH
- PRICE VOLATILITY AFFECTS ECONOMIC VIABILITY FOR CONSUMERS
- KEY DRIVERS
STRATEGIC MARKET ANALYTICS
- KEY MARKET TRENDS
- ITALY DIVERSIFIES LNG SUPPLY SOURCES TO MITIGATE RISK
- INCREASING FOCUS ON FLEXIBLE CONTRACTS AND SPOT MARKET PURCHASES
- INTEGRATION OF LNG WITH RENEWABLE ENERGY SYSTEMS SUPPORTS TRANSITION GOALS
- EXPANSION OF FLOATING STORAGE AND REGASIFICATION UNITS ENHANCES FLEXIBILITY
- PORTER’S FIVE FORCES ANALYSIS
- BUYERS POWER
- SUPPLIERS POWER
- SUBSTITUTION
- NEW ENTRANTS
- INDUSTRY RIVALRY
- GROWTH PROSPECT MAPPING
- GROWTH PROSPECT MAPPING FOR ITALY
- MARKET MATURITY ANALYSIS
- MARKET CONCENTRATION ANALYSIS
- VALUE CHAIN ANALYSIS
- EXPLORATION AND EXTRACTION
- LIQUEFACTION AND PROCESSING
- STORAGE AND TRANSPORTATION
- EXPORT AND DISTRIBUTION
- MARKETING AND SALES
- AFTER-SALES SERVICES
- KEY BUYING CRITERIA
- PRICE COMPETITIVENESS
- SUPPLY RELIABILITY
- QUALITY STANDARDS
- CONTRACT FLEXIBILITY
- FUTURE PROSPECTS OF LNG IN ITALY
- TRADE
- EXPORTS
- IMPORTS
- LNG TERMINALS
- LIST OF LNG EXPORT TERMINALS
- REGULATORY FRAMEWORK AND COMPLIANCE BODIES
- KEY MARKET TRENDS
LIQUEFIED NATURAL GAS (LNG) MARKET BY LNG INFRASTRUCTURE
- LNG LIQUEFACTION PLANTS
- MARKET FORECAST FIGURE
- SEGMENT ANALYSIS
- LNG REGASIFICATION FACILITIES
- MARKET FORECAST FIGURE
- SEGMENT ANALYSIS
- LNG LIQUEFACTION PLANTS
LIQUEFIED NATURAL GAS (LNG) MARKET BY APPLICATION
- TRANSPORTATION
- MARKET FORECAST FIGURE
- SEGMENT ANALYSIS
- INDUSTRIAL FEEDSTOCK
- MARKET FORECAST FIGURE
- SEGMENT ANALYSIS
- POWER GENERATION
- MARKET FORECAST FIGURE
- SEGMENT ANALYSIS
- OTHER APPLICATIONS
- MARKET FORECAST FIGURE
- SEGMENT ANALYSIS
- TRANSPORTATION
LIQUEFIED NATURAL GAS (LNG) MARKET BY MODE OF SUPPLY
- TRUCK
- MARKET FORECAST FIGURE
- SEGMENT ANALYSIS
- TRANSSHIPMENT AND BUNKERING
- MARKET FORECAST FIGURE
- SEGMENT ANALYSIS
- PIPELINE AND RAIL
- MARKET FORECAST FIGURE
- SEGMENT ANALYSIS
- TRUCK
COMPETITIVE LANDSCAPE
- KEY STRATEGIC DEVELOPMENTS
- MERGERS & ACQUISITIONS
- PRODUCT LAUNCHES & DEVELOPMENTS
- PARTNERSHIPS & AGREEMENTS
- BUSINESS EXPANSIONS & DIVESTITURES
- COMPANY PROFILES
- ENI
- COMPANY OVERVIEW
- PRODUCT LIST
- STRENGTHS & CHALLENGES
- SNAM
- COMPANY OVERVIEW
- PRODUCT LIST
- STRENGTHS & CHALLENGES
- EXCELERATE ENERGY
- COMPANY OVERVIEW
- PRODUCT LIST
- STRENGTHS & CHALLENGES
- EDISON
- COMPANY OVERVIEW
- PRODUCT LIST
- STRENGTHS & CHALLENGES
- VTTI
- COMPANY OVERVIEW
- PRODUCT LIST
- STRENGTHS & CHALLENGES
- TERMINALE GNL ADRIATICO
- COMPANY OVERVIEW
- PRODUCT LIST
- STRENGTHS & CHALLENGES
- LIQUIGAS
- COMPANY OVERVIEW
- PRODUCT LIST
- STRENGTHS & CHALLENGES
- ENI
- KEY STRATEGIC DEVELOPMENTS
LIST OF TABLES
TABLE 1: MARKET SNAPSHOT – LIQUEFIED NATURAL GAS (LNG)
TABLE 2: LIQUEFIED NATURAL GAS (LNG) MARKET REGULATORY FRAMEWORK
TABLE 3: ITALY NATURAL GAS PRODUCTION, 2022-2024 (IN EXAJOULES)
TABLE 4: ITALY NATURAL GAS CONSUMPTION, 2022-2024 (IN EXAJOULES)
TABLE 5: ITALY LNG EXPORTS, 2022-2024 (IN BILLION CUBIC METERS)
TABLE 6: ITALY LNG IMPORTS, 2022-2024 (IN BILLION CUBIC METERS)
TABLE 7: MARKET BY LNG INFRASTRUCTURE, HISTORICAL YEARS, 2022-2024 (IN $ MILLION)
TABLE 8: MARKET BY LNG INFRASTRUCTURE, FORECAST YEARS, 2026-2034 (IN $ MILLION)
TABLE 9: MARKET BY APPLICATION, HISTORICAL YEARS, 2022-2024 (IN $ MILLION)
TABLE 10: MARKET BY APPLICATION, FORECAST YEARS, 2026-2034 (IN $ MILLION)
TABLE 11: MARKET BY MODE OF SUPPLY, HISTORICAL YEARS, 2022-2024 (IN $ MILLION)
TABLE 12: MARKET BY MODE OF SUPPLY, FORECAST YEARS, 2026-2034 (IN $ MILLION)
TABLE 13: KEY PLAYERS OPERATING IN THE ITALIAN MARKET
TABLE 14: LIST OF MERGERS & ACQUISITIONS
TABLE 15: LIST OF PRODUCT LAUNCHES & DEVELOPMENTS
TABLE 16: LIST OF PARTNERSHIPS & AGREEMENTS
TABLE 17: LIST OF BUSINESS EXPANSIONS & DIVESTITURES
LIST OF FIGURES
FIGURE 1: KEY MARKET TRENDS
FIGURE 2: PORTER’S FIVE FORCES ANALYSIS
FIGURE 3: GROWTH PROSPECT MAPPING FOR ITALY
FIGURE 4: MARKET MATURITY ANALYSIS
FIGURE 5: MARKET CONCENTRATION ANALYSIS
FIGURE 6: VALUE CHAIN ANALYSIS
FIGURE 7: KEY BUYING CRITERIA
FIGURE 8: SEGMENT GROWTH POTENTIAL, BY LNG INFRASTRUCTURE, IN 2025
FIGURE 9: LNG LIQUEFACTION PLANTS MARKET SIZE, 2026-2034 (IN $ MILLION)
FIGURE 10: LNG REGASIFICATION FACILITIES MARKET SIZE, 2026-2034 (IN $ MILLION)
FIGURE 11: SEGMENT GROWTH POTENTIAL, BY APPLICATION, IN 2025
FIGURE 12: TRANSPORTATION MARKET SIZE, 2026-2034 (IN $ MILLION)
FIGURE 13: INDUSTRIAL FEEDSTOCK MARKET SIZE, 2026-2034 (IN $ MILLION)
FIGURE 14: POWER GENERATION MARKET SIZE, 2026-2034 (IN $ MILLION)
FIGURE 15: OTHER APPLICATIONS MARKET SIZE, 2026-2034 (IN $ MILLION)
FIGURE 16: SEGMENT GROWTH POTENTIAL, BY MODE OF SUPPLY, IN 2025
FIGURE 17: TRUCK MARKET SIZE, 2026-2034 (IN $ MILLION)
FIGURE 18: TRANSSHIPMENT AND BUNKERING MARKET SIZE, 2026-2034 (IN $ MILLION)
FIGURE 19: PIPELINE AND RAIL MARKET SIZE, 2026-2034 (IN $ MILLION)
FAQ’s
RELATED REPORTS
-

UNITED STATES AI-DRIVEN CLOUD MIGRATION SERVICES MARKET FORECAST 2026-2034
-

UNITED KINGDOM AI-DRIVEN CLOUD MIGRATION SERVICES MARKET FORECAST 2026-2034
-

UNITED ARAB EMIRATES AI-DRIVEN CLOUD MIGRATION SERVICES MARKET FORECAST 2026-2034
-

SOUTH KOREA AI-DRIVEN CLOUD MIGRATION SERVICES MARKET FORECAST 2026-2034
-

SINGAPORE AI-DRIVEN CLOUD MIGRATION SERVICES MARKET FORECAST 2026-2034
-

SAUDI ARABIA AI-DRIVEN CLOUD MIGRATION SERVICES MARKET FORECAST 2026-2034
-

AUSTRALIA AI-DRIVEN CLOUD MIGRATION SERVICES MARKET FORECAST 2026-2034
-

JAPAN AI-DRIVEN CLOUD MIGRATION SERVICES MARKET FORECAST 2026-2034
-

INDIA AI-DRIVEN CLOUD MIGRATION SERVICES MARKET FORECAST 2026-2034
-

CHINA AI-DRIVEN CLOUD MIGRATION SERVICES MARKET FORECAST 2026-2034