
EUROPE SMART SPACES MARKET FORECAST 2020-2028
Europe Smart Spaces Market by Component (Hardware Component, Software Component, Service Component) by Application (Layout & Space Management, Energy Management & Optimization, Emergency & Disaster Management, Security Management, Other Applications) by Space Type (Indoor Space, Outdoor Space) by End User (Residential End User, Commercial End User) by Industry Vertical (Energy & Utilities, Healthcare, Retail, Government, Transportation & Logistics, Education, Manufacturing, Other Industrial Verticals) by Geography.
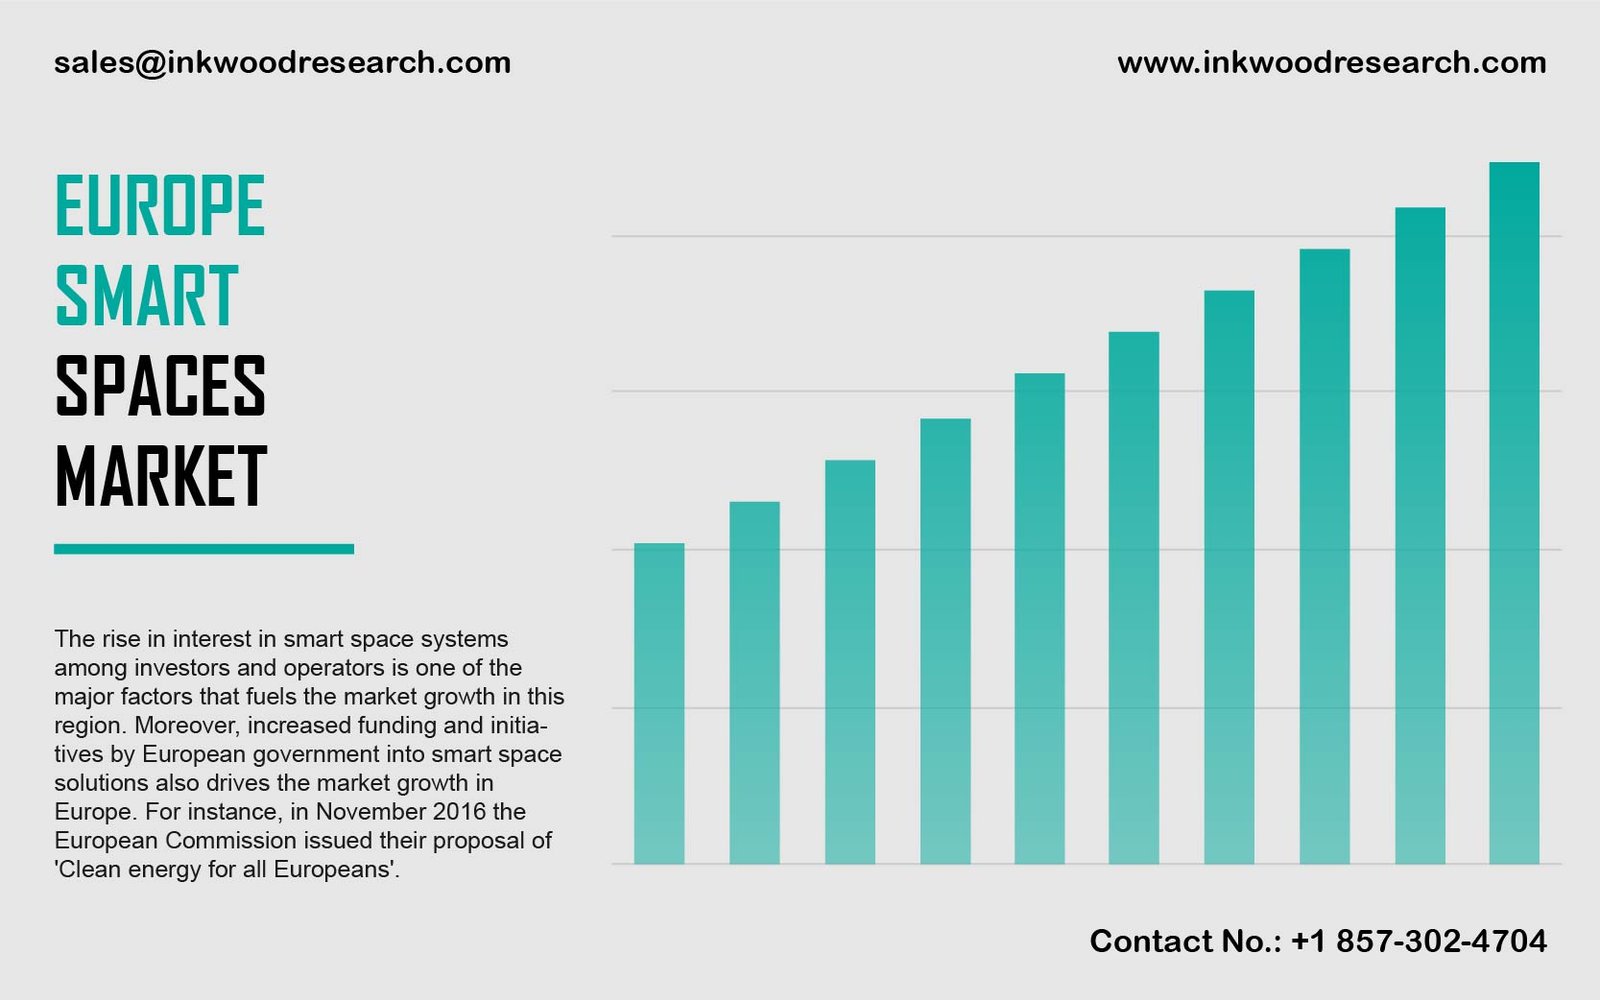
The European smart spaces market is estimated to grow at a CAGR of 17.69% during the estimated period, 2020-2028. One of the important factors driving the market growth in the region is the increasing interest in smart space systems among investors and operators.
To know more about this report, request a free sample copy.
The smart spaces market of the European region is surveyed through the countries of Russia, Italy, the United Kingdom, France, Spain, Germany, and the Rest of Europe. In the UK, in the last few years, technological advancements have led to considerable growth in the IoT market. The Micro-Electro-Mechanical Systems (MEMS) technology, is extensively being used in various industries like healthcare, aviation, consumer electronics, and automotive. Many companies are emphasizing on environmental protection with the growing demand for eco-friendly protection, which is estimated to drive the UK market growth.
Germany is evolving as a leader of complete smart technology solutions. Several smart city projects are underway in Germany. During the forecast period, the IoT (Internet of Things) market in Germany is expected to grow because of the rising demand for connected vehicles, increasing internet penetration, and growing the development of cloud based application. The increasing adoption of IoT technology in different areas like transportation, logistics, smart manufacturing, home automation, etc. are expected to propel the smart space market in Germany. In countries like France, most of the population lives in urban areas, and the development of smart cities is a priority. The Italian IoT market is growing strikingly and enhancing the country’s digital development. This will further promote the smart spaces market in Italy.
SmartSpace Software Plc, headquartered in Luton, the UK, provides technology, services, and software in the commercial spaces and smart buildings market in the UK.
To request a free sample copy of this report, please complete the form below :
We offer 10% free customization including country-level data, niche applications and competitive landscape with every report.
- RESEARCH SCOPE & METHODOLOGY
- STUDY OBJECTIVES
- SCOPE OF STUDY
- METHODOLOGY
- ASSUMPTIONS & LIMITATIONS
- EXECUTIVE SUMMARY
- MARKET SIZE & ESTIMATES
- MARKET OVERVIEW
- MARKET DYNAMICS
- PARENT MARKET ANALYSIS: IOT MARKET
- MARKET DEFINITION
- KEY DRIVERS
- INCREASING INTERNET PENETRATION
- HIGH ADOPTION RATE ACROSS INDUSTRIES
- INCREASE IN SMART CITY PROJECTS
- REDUCTION IN COST
- NEED FOR ENVIRONMENTALLY SUSTAINABLE URBAN PLANNING
- KEY RESTRAINTS
- PRIVACY & SECURITY CONCERNS
- HIGH INVESTMENT
- BANDWIDTH LIMITATION
- KEY ANALYTICS
- KEY INVESTMENT INSIGHTS
- PORTER’S FIVE FORCE ANALYSIS
- BUYER POWER
- SUPPLIER POWER
- SUBSTITUTION
- NEW ENTRANTS
- INDUSTRY RIVALRY
- OPPORTUNITY MATRIX
- VENDOR LANDSCAPE
- VALUE CHAIN ANALYSIS
- MARKET BY COMPONENT
- HARDWARE COMPONENT
- SOFTWARE COMPONENT
- SERVICE COMPONENT
- MARKET BY APPLICATION
- LAYOUT & SPACE MANAGEMENT
- ENERGY MANAGEMENT AND OPTIMIZATION
- EMERGENCY & DISASTER MANAGEMENT
- SECURITY MANAGEMENT
- OTHER APPLICATIONS
- MARKET BY SPACE TYPE
- INDOOR SPACE
- OUTDOOR SPACE
- MARKET BY END USER
- RESIDENTIAL END USER
- COMMERCIAL END USER
- MARKET BY INDUSTRY VERTICAL
- ENERGY & UTILITIES
- HEALTHCARE
- RETAIL
- GOVERNMENT
- TRANSPORTATION & LOGISTICS
- EDUCATION
- MANUFACTURING
- OTHER INDUSTRIAL VERTICALS
- GEOGRAPHICAL ANALYSIS
- EUROPE
- UNITED KINGDOM
- GERMANY
- FRANCE
- ITALY
- RUSSIA
- SPAIN
- REST OF EUROPE
- EUROPE
- COMPANY PROFILES
- IBM
- CISCO SYSTEMS, INC.
- COOR
- EUTECH CYBERNETICS PTE, LTD
- HITACHI VANTARA
- HUAWEI TECHNOLOGIES CO. LTD.
- SCHNEIDER ELECTRIC SE
- SIEMENS AG
- SMARTSPACE SOFTWARE PLC
- SPACEWELL
TABLE LIST
TABLE 1: MARKET SNAPSHOT – SMART SPACES
TABLE 2: NUMBER OF PEOPLE USING INTERNET
TABLE 3: EUROPE SMART SPACES MARKET, BY COMPONENT, HISTORICAL YEARS, 2016-2019 (IN $ MILLION)
TABLE 4: EUROPE SMART SPACES MARKET, BY COMPONENT, FORECAST YEARS, 2020-2028 (IN $ MILLION)
TABLE 5: EUROPE SMART SPACES MARKET, BY APPLICATION, HISTORICAL YEARS, 2016-2019 (IN $ MILLION)
TABLE 6: EUROPE SMART SPACES MARKET, BY APPLICATION, FORECAST YEARS, 2020-2028 (IN $ MILLION)
TABLE 7: EUROPE SMART SPACES MARKET, BY SPACES TYPE, HISTORICAL YEARS, 2016-2019 (IN $ MILLION)
TABLE 8: EUROPE SMART SPACES MARKET, BY SPACES TYPE, FORECAST YEARS, 2020-2028 (IN $ MILLION)
TABLE 9: EUROPE SMART SPACES MARKET, BY END USER, HISTORICAL YEARS, 2016-2019 (IN $ MILLION)
TABLE 10: EUROPE SMART SPACES MARKET, BY END USER, FORECAST YEARS, 2020-2028 (IN $ MILLION)
TABLE 11: EUROPE SMART SPACES MARKET, BY INDUSTRY VERTICAL, HISTORICAL YEARS, 2016-2019 (IN $ MILLION)
TABLE 12: EUROPE SMART SPACES MARKET, BY INDUSTRY VERTICAL, FORECAST YEARS, 2020-2028 (IN $ MILLION)
TABLE 13: EUROPE SMART SPACES MARKET, BY COUNTRY, HISTORICAL YEARS, 2016-2019 (IN $ MILLION)
TABLE 14: EUROPE SMART SPACES MARKET, BY COUNTRY, FORECAST YEARS, 2020-2028 (IN $ MILLION)
FIGURE LIST
FIGURE 1: SMART SPACES TECHNOLOGY PROCESS
FIGURE 2: KEY INVESTMENT INSIGHTS
FIGURE 3: PORTER’S FIVE FORCE ANALYSIS
FIGURE 4: OPPORTUNITY MATRIX
FIGURE 5: VENDOR LANDSCAPE
FIGURE 6: VALUE CHAIN ANALYSIS: SMART METERS
FIGURE 7: EUROPE SMART SPACES MARKET, GROWTH POTENTIAL, BY COMPONENT, IN 2019
FIGURE 8: EUROPE SMART SPACES MARKET, BY HARDWARE COMPONENT, 2020-2028 (IN $ MILLION)
FIGURE 9: EUROPE SMART SPACES MARKET, BY SOFTWARE COMPONENT, 2020-2028 (IN $ MILLION)
FIGURE 10: EUROPE SMART SPACES MARKET, BY SERVICE COMPONENT, 2020-2028 (IN $ MILLION)
FIGURE 11: EUROPE SMART SPACES MARKET, GROWTH POTENTIAL, BY APPLICATION, IN 2019
FIGURE 12: EUROPE SMART SPACES MARKET, BY LAYOUT & SPACES MANAGEMENT, 2020-2028 (IN $ MILLION)
FIGURE 13: EUROPE SMART SPACES MARKET, BY ENERGY MANAGEMENT AND OPTIMIZATION, 2020-2028 (IN $ MILLION)
FIGURE 14: EUROPE SMART SPACES MARKET, BY EMERGENCY & DISASTER MANAGEMENT, 2020-2028 (IN $ MILLION)
FIGURE 15: EUROPE SMART SPACES MARKET, BY SECURITY MANAGEMENT, 2020-2028 (IN $ MILLION)
FIGURE 16: EUROPE SMART SPACES MARKET, BY OTHER APPLICATIONS, 2020-2028 (IN $ MILLION)
FIGURE 17: EUROPE SMART SPACES MARKET, GROWTH POTENTIAL, BY SPACES TYPE, IN 2019
FIGURE 18: EUROPE SMART SPACES MARKET, BY INDOOR SPACES, 2020-2028 (IN $ MILLION)
FIGURE 19: EUROPE SMART SPACES MARKET, BY OUTDOOR SPACES, 2020-2028 (IN $ MILLION)
FIGURE 20: EUROPE SMART SPACES MARKET, GROWTH POTENTIAL, BY END USER, IN 2019
FIGURE 21: EUROPE SMART SPACES MARKET, BY RESIDENTIAL END USER, 2020-2028 (IN $ MILLION)
FIGURE 22: EUROPE SMART SPACES MARKET, BY COMMERCIAL END USER, 2020-2028 (IN $ MILLION)
FIGURE 23: EUROPE SMART SPACES MARKET, GROWTH POTENTIAL, BY INDUSTRY VERTICAL, IN 2019
FIGURE 24: EUROPE SMART SPACES MARKET, BY ENERGY & UTILITIES INDUSTRY VERTICAL, 2020-2028 (IN $ MILLION)
FIGURE 25: EUROPE SMART SPACES MARKET, BY HEALTHCARE INDUSTRY VERTICAL, 2020-2028 (IN $ MILLION)
FIGURE 26: EUROPE SMART SPACES MARKET, BY RETAIL INDUSTRY VERTICAL, 2020-2028 (IN $ MILLION)
FIGURE 27: EUROPE SMART SPACES MARKET, BY GOVERNMENT INDUSTRY VERTICAL, 2020-2028 (IN $ MILLION)
FIGURE 28: EUROPE SMART SPACES MARKET, BY TRANSPORTATION & LOGISTICS INDUSTRY VERTICAL, 2020-2028 (IN $ MILLION)
FIGURE 29: EUROPE SMART SPACES MARKET, BY EDUCATION INDUSTRY VERTICAL, 2020-2028 (IN $ MILLION)
FIGURE 30: EUROPE SMART SPACES MARKET, BY MANUFACTURING INDUSTRY VERTICAL, 2020-2028 (IN $ MILLION)
FIGURE 31: EUROPE SMART SPACES MARKET, BY OTHER INDUSTRY VERTICALS, 2020-2028 (IN $ MILLION)
FIGURE 32: EUROPE SMART SPACES MARKET, REGIONAL OUTLOOK, 2019 & 2028 (IN %)
FIGURE 33: UNITED KINGDOM SMART SPACES MARKET, 2020-2028 (IN $ MILLION)
FIGURE 34: GERMANY SMART SPACES MARKET, 2020-2028 (IN $ MILLION)
FIGURE 35: FRANCE SMART SPACES MARKET, 2020-2028 (IN $ MILLION)
FIGURE 36: ITALY SMART SPACES MARKET, 2020-2028 (IN $ MILLION)
FIGURE 37: RUSSIA SMART SPACES MARKET, 2020-2028 (IN $ MILLION)
FIGURE 38: SPAIN SMART SPACES MARKET, 2020-2028 (IN $ MILLION)
FIGURE 39: REST OF EUROPE SMART SPACES MARKET, 2020-2028 (IN $ MILLION)
- GEOGRAPHICAL ANALYSIS
- EUROPE
- UNITED KINGDOM
- GERMANY
- FRANCE
- ITALY
- RUSSIA
- SPAIN
- REST OF EUROPE
- EUROPE
- MARKET BY COMPONENT
- HARDWARE COMPONENT
- SOFTWARE COMPONENT
- SERVICE COMPONENT
- MARKET BY APPLICATION
- LAYOUT & SPACE MANAGEMENT
- ENERGY MANAGEMENT AND OPTIMIZATION
- EMERGENCY & DISASTER MANAGEMENT
- SECURITY MANAGEMENT
- OTHER APPLICATIONS
- MARKET BY SPACE TYPE
- INDOOR SPACE
- OUTDOOR SPACE
- MARKET BY END USER
- RESIDENTIAL END USER
- COMMERCIAL END USER
- MARKET BY INDUSTRY VERTICAL
- ENERGY & UTILITIES
- HEALTHCARE
- RETAIL
- GOVERNMENT
- TRANSPORTATION & LOGISTICS
- EDUCATION
- MANUFACTURING
- OTHER INDUSTRIAL VERTICALS
To request a free sample copy of this report, please complete the form below :
We offer 10% free customization including country-level data, niche applications and competitive landscape with every report.