China Wind Energy Market by Location / Installation Type (Onshore Wind, Offshore Wind (Fixed), Offshore Wind (Floating)), Market by Application (Utility-Scale Power Generation, Commercial & Industrial (C&I), Residential / Small Wind Turbines), Market by Turbine Capacity (Up to 1 MW, 1–3 MW, 3–10 MW, Above 10 MW), Market by End-User (Power Utilities, Independent Power Producers (IPP), Commercial Enterprises, Agricultural Users, Remote / Off-Grid Power Users), Market by Technology (Grid-Connected Systems, Off-Grid Systems), by Geography
CHINA WIND ENERGY MARKET OVERVIEW
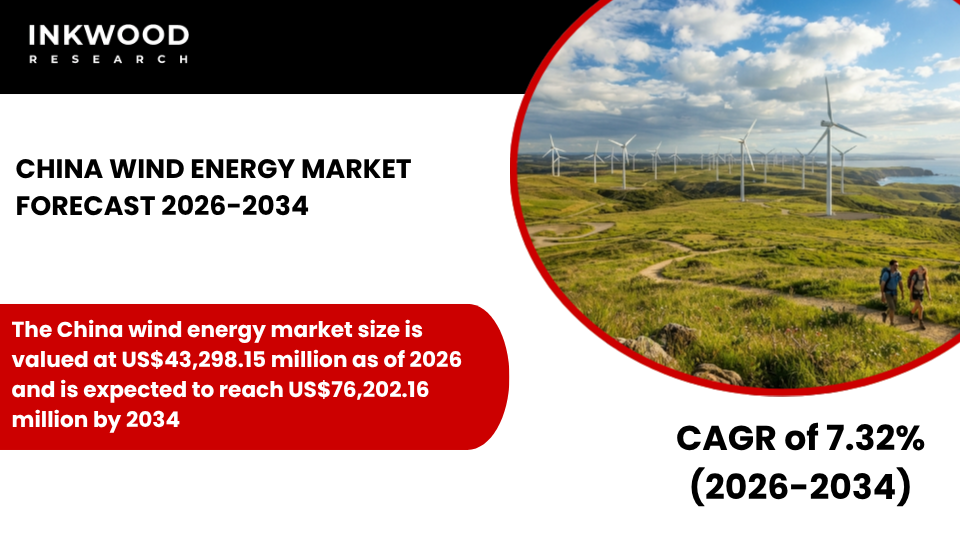
The China wind energy market size is valued at US$43,298.15 million as of 2026 and is expected to reach US$76,202.16 million by 2034, progressing with a CAGR of 7.32% during the forecast years, 2026-2034.
China’s wind energy market continues to expand at a robust pace, fueled by the government’s ambitious carbon neutrality targets and comprehensive renewable energy policies. As the world’s largest wind power market, China has achieved significant milestones in reducing carbon emissions through the massive deployment of wind turbines across both onshore and offshore locations.
The country’s national development plans prioritize renewable energy projects, with specific mandates requiring provinces to integrate higher shares of wind power into their electricity grids. Moreover, China’s well-established domestic manufacturing ecosystem has dramatically lowered the costs of wind energy components, making wind farms more economically viable without relying on subsidies.
This cost competitiveness has accelerated project development timelines and attracted substantial investment from state-owned enterprises and independent power producers alike. Additionally, technological advancements in turbine design, particularly the rapid adoption of ultra-large capacity wind turbines exceeding 10 MW, are transforming how developers approach new renewable energy projects.
Furthermore, the integration of wind energy with complementary technologies such as energy storage systems and hydroelectric facilities is enhancing grid stability and addressing intermittency challenges. Coastal provinces are witnessing remarkable growth in offshore wind installations, supported by favorable wind resources and proximity to major industrial load centers.
Consequently, China’s wind power generation capacity continues to set global benchmarks. This reinforces the nation’s leadership position in the transition toward clean energy sources while simultaneously creating export opportunities for domestic turbine manufacturers.
To Know More About This Report, Request a Free Sample Copy
China’s wind energy sector benefits from strong policy frameworks that drive consistent market expansion and reduce investment uncertainties. The central government has established clear renewable energy mandates at both national and provincial levels, ensuring a steady pipeline of wind energy projects throughout the forecast period.
These policies not only set binding targets for renewable power capacity but also streamline approval processes for wind farms, thereby accelerating project commissioning timelines. In addition, provincial authorities compete to exceed their allocated renewable energy quotas, creating a dynamic environment where wind power development is actively encouraged and supported.
The achievement of grid parity in most provinces represents a crucial turning point, as new wind energy installations can now compete directly with coal-fired power plants on cost without requiring financial subsidies. This economic competitiveness is particularly evident in regions with excellent wind resources, such as Inner Mongolia, Xinjiang, and coastal areas along the Yellow Sea and East China Sea.
However, challenges related to grid curtailment persist in remote northern and western provinces, where transmission infrastructure has not kept pace with rapid capacity additions. Despite these constraints, ongoing investments in ultra-high voltage transmission lines are gradually alleviating bottlenecks and enabling better utilization of wind energy resources.
Moreover, the growing demand for electricity from industrial clusters and urban centers continues to drive appetite for large-scale renewable energy projects, including utility-scale wind farms that can deliver gigawatts of clean power to the grid. These factors, in turn, are set to boost the wind energy market growth in China during the forecast period.
The China wind energy market is segmented into location/installation type, application, turbine capacity, end-user, and technology. The turbine capacity segment is further categorized into up to 1 MW, 1–3 MW, 3–10 MW, and above 10 MW.
The above 10 MW turbine capacity segment is experiencing exceptionally strong growth in China’s wind energy landscape, driven by technological breakthroughs and economies of scale. These ultra-large wind turbines offer significantly higher power output per unit, which translates into improved project economics and reduced balance-of-plant costs for developers.
Offshore wind farms, in particular, are increasingly deploying turbines in this capacity range to maximize energy generation while minimizing the number of foundations and subsea cables required. Leading Chinese manufacturers such as Goldwind, Envision Energy, and Mingyang Smart Energy have introduced cutting-edge turbine models exceeding 15 MW, specifically designed for offshore applications where stronger and more consistent wind resources justify the investment in larger equipment.
Moreover, advancements in blade design, control systems, and drivetrain efficiency have made these high-capacity wind turbines more reliable and easier to maintain, even in challenging marine environments. The shift toward larger turbines also reduces the levelized cost of electricity, making wind power generation more competitive against other renewable energy sources and conventional power plants.
Furthermore, developers benefit from simplified project logistics, as fewer turbine installations are needed to achieve the same total capacity, thereby reducing construction timelines and associated labor costs. As China continues to expand its offshore wind capacity along the eastern seaboard, the above 10 MW segment is poised to capture an increasing share of new installations, supported by favorable government procurement policies and long-term power purchase agreements with utilities and commercial enterprises.
Some of the top players operating in the China wind energy market include Goldwind Science & Technology Co, Envision Energy, Mingyang Smart Energy, and Dongfang Electric Corporation, etc.
Goldwind Science & Technology Co is a leading Chinese wind turbine manufacturer headquartered in Beijing, specializing in the research, development, manufacturing, and sale of wind power equipment and renewable energy solutions. The company operates one of the largest wind turbine production facilities globally, offering a comprehensive range of onshore and offshore wind turbines with capacities spanning from 1.5 MW to over 16 MW.
Goldwind’s product portfolio includes direct-drive permanent magnet generator technology, which enhances efficiency and reduces maintenance requirements compared to conventional gearbox-based systems. In addition to turbine manufacturing, Goldwind provides integrated wind farm development services, including engineering, procurement, construction management, and long-term operations and maintenance support.
The company has established a strong domestic market presence across China’s key wind energy provinces while simultaneously expanding its footprint in international markets such as Australia, the United States, and several countries across Europe and Asia. Goldwind’s commitment to innovation is evident in its substantial investments in research and development, focusing on advanced control algorithms, larger rotor diameters, and digitalization technologies that optimize wind power generation performance.
REPORT SYNOPSIS
| REPORT SCOPE | DETAILS |
|---|---|
| Market Forecast Years | 2026-2034 |
| Base Year | 2025 |
| Market Historical Years | 2022-2024 |
| Forecast Units | Revenue ($ Million) |
| Segments Analyzed | Location / Installation Type, Application, Turbine Capacity, End-User, and Technology |
| Country Analyzed | China |
| Companies Analyzed | Goldwind Science & Technology Co, Envision Energy, MingYang Smart Energy, Dongfang Electric Corporation (DEC), Windey Energy, CRRC Corporation |
TABLE OF CONTENTS
RESEARCH SCOPE & METHODOLOGY
- STUDY OBJECTIVES
- METHODOLOGY
- ASSUMPTIONS & LIMITATIONS
EXECUTIVE SUMMARY
- MARKET SIZE & FORECAST
- MARKET OVERVIEW
- SCOPE OF STUDY
- CRISIS SCENARIO ANALYSIS
- MAJOR MARKET FINDINGS
- CHINA MAINTAINS THE LARGEST WIND POWER INSTALLED BASE GLOBALLY BY A SIGNIFICANT MARGIN
- ONSHORE WIND CONTINUES TO ACCOUNT FOR THE MAJORITY OF CAPACITY ADDITIONS DESPITE RAPID OFFSHORE GROWTH
- STATE-OWNED ENTERPRISES DOMINATE PROJECT OWNERSHIP AND DEVELOPMENT
- GRID PARITY HAS BEEN LARGELY ACHIEVED IN MOST PROVINCES WITHOUT SUBSIDIES
MARKET DYNAMICS
- KEY DRIVERS
- NATIONAL CARBON NEUTRALITY TARGETS ARE DRIVING MASSIVE SCALE WIND POWER INVESTMENT
- STRONG DOMESTIC MANUFACTURING ECOSYSTEM REDUCES COSTS AND SUPPORTS RAPID DEPLOYMENT
- PROVINCIAL LEVEL RENEWABLE MANDATES ENSURE CONTINUOUS PROJECT PIPELINES
- OFFSHORE WIND IS EXPANDING RAPIDLY ALONG COASTAL INDUSTRIAL CLUSTERS
- KEY RESTRAINTS
- CURTAILMENT RISKS REMAIN IN REMOTE NORTHERN AND WESTERN REGIONS
- GRID INTEGRATION CHALLENGES PERSIST DUE TO VARIABLE GENERATION AND DEMAND MISMATCH
- DECLINING TARIFFS ARE PRESSURING DEVELOPER MARGINS
- COMPLEX PERMITTING FOR OFFSHORE PROJECTS EXTENDS DEVELOPMENT TIMELINES
- KEY DRIVERS
KEY ANALYTICS
- KEY MARKET TRENDS
- RAPID SCALE UP OF LARGE CAPACITY TURBINES ABOVE 10 MW IS TRANSFORMING PROJECT DESIGN
- INTEGRATION OF WIND WITH ENERGY STORAGE AND HYDRO IS INCREASING
- DIGITAL MONITORING AND AI BASED O AND M SOLUTIONS ARE BEING WIDELY ADOPTED
- CHINESE TURBINE MANUFACTURERS ARE EXPANDING EXPORTS TO EMERGING MARKETS
- PORTER’S FIVE FORCES ANALYSIS
- BUYERS POWER
- SUPPLIERS POWER
- SUBSTITUTION
- NEW ENTRANTS
- INDUSTRY RIVALRY
- GROWTH PROSPECT MAPPING
- GROWTH PROSPECT MAPPING FOR CHINA
- MARKET MATURITY ANALYSIS
- MARKET CONCENTRATION ANALYSIS
- VALUE CHAIN ANALYSIS
- RAW MATERIAL & MACHINERY SUPPLIERS
- DESIGN & DEVELOPMENT SERVICES
- COMPONENT SUPPLIERS
- WIND TURBINE COMPANIES
- CONSTRUCTION AND INSTALLATION SERVICES
- WIND FARM DEVELOPERS
- KEY BUYING CRITERIA
- GOVERNMENT POLICIES AND INCENTIVES
- TECHNOLOGICAL ADVANCEMENTS
- ENVIRONMENTAL AWARENESS AND SUSTAINABILITY
- ENVIRONMENTAL AND SOCIAL IMPACT ASSESSMENTS
- REGULATORY FRAMEWORK
- KEY MARKET TRENDS
WIND ENERGY MARKET BY LOCATION / INSTALLATION TYPE
- ONSHORE WIND
- MARKET FORECAST FIGURE
- SEGMENT ANALYSIS
- OFFSHORE WIND (FIXED)
- MARKET FORECAST FIGURE
- SEGMENT ANALYSIS
- OFFSHORE WIND (FLOATING)
- MARKET FORECAST FIGURE
- SEGMENT ANALYSIS
- ONSHORE WIND
WIND ENERGY MARKET BY APPLICATION
- UTILITY-SCALE POWER GENERATION
- MARKET FORECAST FIGURE
- SEGMENT ANALYSIS
- COMMERCIAL & INDUSTRIAL (C&I)
- MARKET FORECAST FIGURE
- SEGMENT ANALYSIS
- RESIDENTIAL / SMALL WIND TURBINES
- MARKET FORECAST FIGURE
- SEGMENT ANALYSIS
- UTILITY-SCALE POWER GENERATION
WIND ENERGY MARKET BY TURBINE CAPACITY
- UP TO 1 MW
- MARKET FORECAST FIGURE
- SEGMENT ANALYSIS
- 1–3 MW
- MARKET FORECAST FIGURE
- SEGMENT ANALYSIS
- 3–10 MW
- MARKET FORECAST FIGURE
- SEGMENT ANALYSIS
- ABOVE 10 MW
- MARKET FORECAST FIGURE
- SEGMENT ANALYSIS
- UP TO 1 MW
WIND ENERGY MARKET BY END-USER
- POWER UTILITIES
- MARKET FORECAST FIGURE
- SEGMENT ANALYSIS
- INDEPENDENT POWER PRODUCERS (IPP)
- MARKET FORECAST FIGURE
- SEGMENT ANALYSIS
- COMMERCIAL ENTERPRISES
- MARKET FORECAST FIGURE
- SEGMENT ANALYSIS
- AGRICULTURAL USERS
- MARKET FORECAST FIGURE
- SEGMENT ANALYSIS
- REMOTE / OFF-GRID POWER USERS
- MARKET FORECAST FIGURE
- SEGMENT ANALYSIS
- POWER UTILITIES
WIND ENERGY MARKET BY TECHNOLOGY
- GRID-CONNECTED SYSTEMS
- MARKET FORECAST FIGURE
- SEGMENT ANALYSIS
- OFF-GRID SYSTEMS
- MARKET FORECAST FIGURE
- SEGMENT ANALYSIS
- GRID-CONNECTED SYSTEMS
COMPETITIVE LANDSCAPE
- KEY STRATEGIC DEVELOPMENTS
- MERGERS & ACQUISITIONS
- PRODUCT LAUNCHES & DEVELOPMENTS
- PARTNERSHIPS & AGREEMENTS
- BUSINESS EXPANSIONS & DIVESTITURES
- COMPANY PROFILES
- GOLDWIND SCIENCE & TECHNOLOGY CO
- COMPANY OVERVIEW
- PRODUCTS / SERVICES LIST
- STRENGTHS & CHALLENGES
- ENVISION ENERGY
- COMPANY OVERVIEW
- PRODUCTS / SERVICES LIST
- STRENGTHS & CHALLENGES
- MINGYANG SMART ENERGY
- COMPANY OVERVIEW
- PRODUCTS / SERVICES LIST
- STRENGTHS & CHALLENGES
- DONGFANG ELECTRIC CORPORATION (DEC)
- COMPANY OVERVIEW
- PRODUCTS / SERVICES LIST
- STRENGTHS & CHALLENGES
- WINDEY ENERGY
- COMPANY OVERVIEW
- PRODUCTS / SERVICES LIST
- STRENGTHS & CHALLENGES
- CRRC CORPORATION
- COMPANY OVERVIEW
- PRODUCTS / SERVICES LIST
- STRENGTHS & CHALLENGES
- GOLDWIND SCIENCE & TECHNOLOGY CO
- KEY STRATEGIC DEVELOPMENTS
LIST OF TABLES
TABLE 1: MARKET SNAPSHOT – WIND ENERGY
TABLE 2: WIND ENERGY MARKET REGULATORY FRAMEWORK
TABLE 3: MARKET BY LOCATION / INSTALLATION TYPE, HISTORICAL YEARS, 2022-2024 (IN $ MILLION)
TABLE 4: MARKET BY LOCATION / INSTALLATION TYPE, FORECAST YEARS, 2026-2034 (IN $ MILLION)
TABLE 5: MARKET BY APPLICATION, HISTORICAL YEARS, 2022-2024 (IN $ MILLION)
TABLE 6: MARKET BY APPLICATION, FORECAST YEARS, 2026-2034 (IN $ MILLION)
TABLE 7: MARKET BY TURBINE CAPACITY, HISTORICAL YEARS, 2022-2024 (IN $ MILLION)
TABLE 8: MARKET BY TURBINE CAPACITY, FORECAST YEARS, 2026-2034 (IN $ MILLION)
TABLE 9: MARKET BY END-USER, HISTORICAL YEARS, 2022-2024 (IN $ MILLION)
TABLE 10: MARKET BY END-USER, FORECAST YEARS, 2026-2034 (IN $ MILLION)
TABLE 11: MARKET BY TECHNOLOGY, HISTORICAL YEARS, 2022-2024 (IN $ MILLION)
TABLE 12: MARKET BY TECHNOLOGY, FORECAST YEARS, 2026-2034 (IN $ MILLION)
TABLE 13: KEY PLAYERS OPERATING IN THE CHINESE MARKET
TABLE 14: LIST OF MERGERS & ACQUISITIONS
TABLE 15: LIST OF PRODUCT LAUNCHES & DEVELOPMENTS
TABLE 16: LIST OF PARTNERSHIPS & AGREEMENTS
TABLE 17: LIST OF BUSINESS EXPANSIONS & DIVESTITURES
LIST OF FIGURES
FIGURE 1: MAJOR MARKET FINDINGS
FIGURE 2: MARKET DYNAMICS
FIGURE 3: KEY MARKET TRENDS
FIGURE 4: PORTER’S FIVE FORCES ANALYSIS
FIGURE 5: GROWTH PROSPECT MAPPING FOR CHINA
FIGURE 6: MARKET MATURITY ANALYSIS
FIGURE 7: MARKET CONCENTRATION ANALYSIS
FIGURE 8: VALUE CHAIN ANALYSIS
FIGURE 9: KEY BUYING CRITERIA
FIGURE 10: SEGMENT GROWTH POTENTIAL, BY LOCATION / INSTALLATION TYPE, IN 2025
FIGURE 11: ONSHORE WIND MARKET SIZE, 2026-2034 (IN $ MILLION)
FIGURE 12: OFFSHORE WIND (FIXED) MARKET SIZE, 2026-2034 (IN $ MILLION)
FIGURE 13: OFFSHORE WIND (FLOATING) MARKET SIZE, 2026-2034 (IN $ MILLION)
FIGURE 14: SEGMENT GROWTH POTENTIAL, BY APPLICATION, IN 2025
FIGURE 15: UTILITY-SCALE POWER GENERATION MARKET SIZE, 2026-2034 (IN $ MILLION)
FIGURE 16: COMMERCIAL & INDUSTRIAL (C&I) MARKET SIZE, 2026-2034 (IN $ MILLION)
FIGURE 17: RESIDENTIAL / SMALL WIND TURBINES MARKET SIZE, 2026-2034 (IN $ MILLION)
FIGURE 18: SEGMENT GROWTH POTENTIAL, BY TURBINE CAPACITY, IN 2025
FIGURE 19: UP TO 1 MW MARKET SIZE, 2026-2034 (IN $ MILLION)
FIGURE 20: 1–3 MW MARKET SIZE, 2026-2034 (IN $ MILLION)
FIGURE 21: 3–10 MW MARKET SIZE, 2026-2034 (IN $ MILLION)
FIGURE 22: ABOVE 10 MW MARKET SIZE, 2026-2034 (IN $ MILLION)
FIGURE 23: SEGMENT GROWTH POTENTIAL, BY END-USER, IN 2025
FIGURE 24: POWER UTILITIES MARKET SIZE, 2026-2034 (IN $ MILLION)
FIGURE 25: INDEPENDENT POWER PRODUCERS (IPP) MARKET SIZE, 2026-2034 (IN $ MILLION)
FIGURE 26: COMMERCIAL ENTERPRISES MARKET SIZE, 2026-2034 (IN $ MILLION)
FIGURE 27: AGRICULTURAL USERS MARKET SIZE, 2026-2034 (IN $ MILLION)
FIGURE 28: REMOTE / OFF-GRID POWER USERS MARKET SIZE, 2026-2034 (IN $ MILLION)
FIGURE 29: SEGMENT GROWTH POTENTIAL, BY TECHNOLOGY, IN 2025
FIGURE 30: GRID-CONNECTED SYSTEMS MARKET SIZE, 2026-2034 (IN $ MILLION)
FIGURE 31: OFF-GRID SYSTEMS MARKET SIZE, 2026-2034 (IN $ MILLION)
FAQ’s
RELATED REPORTS
-

UNITED STATES AI-DRIVEN CLOUD MIGRATION SERVICES MARKET FORECAST 2026-2034
-

UNITED KINGDOM AI-DRIVEN CLOUD MIGRATION SERVICES MARKET FORECAST 2026-2034
-

UNITED ARAB EMIRATES AI-DRIVEN CLOUD MIGRATION SERVICES MARKET FORECAST 2026-2034
-

SOUTH KOREA AI-DRIVEN CLOUD MIGRATION SERVICES MARKET FORECAST 2026-2034
-

SINGAPORE AI-DRIVEN CLOUD MIGRATION SERVICES MARKET FORECAST 2026-2034
-

SAUDI ARABIA AI-DRIVEN CLOUD MIGRATION SERVICES MARKET FORECAST 2026-2034
-

AUSTRALIA AI-DRIVEN CLOUD MIGRATION SERVICES MARKET FORECAST 2026-2034
-

JAPAN AI-DRIVEN CLOUD MIGRATION SERVICES MARKET FORECAST 2026-2034
-

INDIA AI-DRIVEN CLOUD MIGRATION SERVICES MARKET FORECAST 2026-2034
-

CHINA AI-DRIVEN CLOUD MIGRATION SERVICES MARKET FORECAST 2026-2034