
CHINA SOLAR PANEL RECYCLING MARKET FORECAST 2026-2034
SCOPE OF THE REPORT
China Solar Panel Recycling Market by Process (Thermal, Mechanical, Chemical, Laser) Market by Type (Silicon-Based C-Si, Thin-Film, Other Types) Market by Shelf Life (Early Loss, Normal Loss) Market by Material/Recoverable Components (Glass, Aluminum, Copper, Plastic, Silver, PV Silicon, Other Materials/Recoverable Components), by Geography
CHINA SOLAR PANEL RECYCLING MARKET OVERVIEW
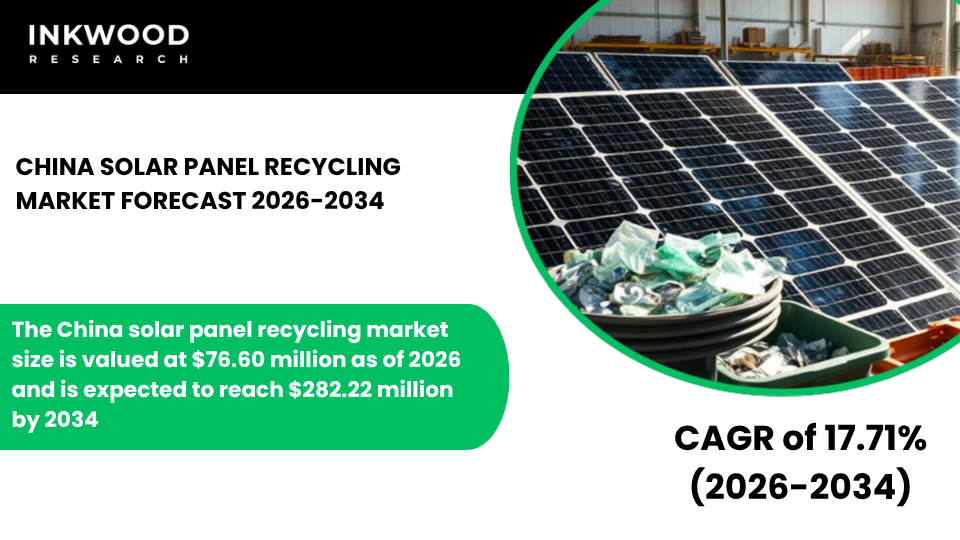
The China solar panel recycling market size is valued at $76.60 million as of 2026 and is expected to reach $282.22 million by 2034, progressing with a CAGR of 17.71% during the forecast years, 2026-2034.
China’s solar panel recycling market stands poised for transformative growth, driven by the country’s unparalleled position as both the world’s largest photovoltaic manufacturer and installer, creating unprecedented volumes of panels that will eventually require proper disposal and material recovery. The nation’s aggressive solar deployment throughout the early 2010s has generated a massive future pipeline of end-of-life panels approaching their operational shelf life, necessitating comprehensive waste management infrastructure capable of handling volumes far exceeding any other single market globally.
Currently, the market remains dominated by informal and semi-formal recycling channels where small-scale operators employ basic mechanical separation techniques to extract easily accessible materials like aluminum frames and junction boxes. However, this fragmented landscape is gradually evolving as the government focuses on resource security drives increasing interest in formal, industrial-scale material recovery operations that can systematically reclaim valuable components, including silicon, silver, and copper.
Large-scale solar installations from the early 2010s are now approaching their end-of-life phase, creating immediate demand for processing capacity across major photovoltaic deployment regions, including Qinghai, Xinjiang, Inner Mongolia, and coastal provinces. Government policies under the 14th and 15th Five-Year Plans explicitly prioritize circular economy development, establishing frameworks that encourage formalization of recycling activities while promoting technological advancement in material recovery processes.
According to China’s Ministry of Industry and Information Technology, the government is actively developing national standards for solar panel recycling that will establish minimum processing requirements, material recovery targets, and environmental compliance obligations throughout the value chain. These evolving policy frameworks reflect recognition that effective waste management will become critical as decommissioning volumes surge over the coming decade, potentially overwhelming existing informal systems ill-equipped to handle industrial-scale processing requirements.
To Know More About This Report, Request a Free Sample Copy
Strong domestic manufacturing capabilities enable rapid scaling of recycling technologies once clear regulatory frameworks and economic incentives emerge to justify capital investments in specialized facilities. China’s extensive experience in electronics recycling and metallurgical processing provides technical foundations that can be adapted for photovoltaic applications, while abundant engineering talent accelerates technology development and process optimization.
Rising environmental pressures from both domestic public opinion and international sustainability commitments are promoting the formalization of recycling activities, with authorities increasingly scrutinizing informal operators whose practices may generate environmental contamination through improper material handling or waste disposal. Nevertheless, significant challenges constrain market development, particularly the lack of clear national standards that create regulatory uncertainty, deterring large-scale infrastructure investments by formal recyclers.
Low recovery value for silicon represents another critical constraint, as relatively abundant supply and energy-intensive purification requirements limit economic incentives for comprehensive material recovery compared to simply extracting high-value metals and disposing of remaining components. The dominance of informal recyclers affects overall material quality and traceability throughout supply chains, creating challenges for manufacturers seeking certified recycled content for new panel production.
Additionally, insufficient collection infrastructure in remote solar farms hampers efficient material consolidation, with transportation costs often consuming significant portions of potential processing margins. These obstacles must be addressed through coordinated policy interventions and industry collaboration to enable transition toward formalized, environmentally compliant recycling systems capable of managing China’s enormous future waste volumes.
Key market trends include a gradual shift toward formal and industrial-scale recycling operations as major manufacturers recognize strategic value in controlling material recovery chains. Companies like Trina Solar and JA Solar are exploring vertical integration strategies that incorporate recycling capabilities directly into their operations, creating closed-loop systems that reduce raw material costs while enhancing sustainability credentials.
Pilot projects for advanced chemical and thermal recycling technologies are demonstrating the technical feasibility of high-recovery-rate processes, though economic viability remains dependent on policy support and material price dynamics. Increasing government involvement in solar waste policy design suggests forthcoming regulatory developments that could accelerate market formalization substantially, potentially including extended producer responsibility requirements, mandatory recycling targets, and financial mechanisms supporting collection infrastructure development.
Glass and aluminum recovery represent the primary economic value streams currently, as these materials are readily extracted through simple mechanical processes and command stable prices in domestic manufacturing markets. However, future market evolution will depend on developing economically viable processes for silicon and precious metal recovery, requiring technological innovation and potentially government subsidies or mandates that improve processing economics.
Provincial governments in major solar deployment regions are beginning to establish localized recycling requirements and infrastructure support programs, creating regional variations in market development that may eventually coalesce into national frameworks. Meanwhile, environmental enforcement is intensifying against informal recyclers operating without proper permits or employing environmentally harmful processing methods, gradually creating space for formal operators with compliant facilities and comprehensive material recovery capabilities.
SEGMENTATION ANALYSIS
The China solar panel recycling market is segmented into process, type, shelf life, and material/recoverable components. The material/recoverable components segment is further categorized into glass, aluminum, copper, plastic, silver, PV silicon, and other materials/recoverable components.
Aluminum represents a particularly valuable segment within China’s solar panel recycling market, offering attractive economics through straightforward mechanical extraction processes and strong domestic demand from manufacturing sectors requiring secondary metal feedstock. This material comprises the structural frames surrounding photovoltaic modules, typically accounting for approximately 10-12% of total panel weight while representing significant economic value due to aluminum’s high recyclability and established secondary markets throughout China’s industrial economy.
The recovery process begins with simple mechanical disassembly that separates frames from panel assemblies, requiring minimal specialized equipment beyond standard cutting and sorting tools accessible to even small-scale operators. Consequently, aluminum extraction occurs across virtually all recycling channels, from informal workshops to sophisticated industrial facilities, ensuring high recovery rates approaching 95-98% of available material.
Chinese aluminum manufacturers actively purchase recovered frames and extrusions, as recycled aluminum requires substantially less energy to process compared to primary production from bauxite ore, creating favorable economics that support viable recycling operations. Furthermore, China’s position as the world’s largest aluminum producer and consumer ensures deep, liquid markets for recovered material across multiple quality grades and specifications.
Environmental benefits include significant energy savings and carbon emission reductions compared to virgin production, aligning with national climate commitments and industrial efficiency objectives. The well-established value chain for aluminum recycling provides a template and infrastructure that can be leveraged for developing more complex material recovery systems targeting silicon and precious metals.
Market dynamics favor this segment as collection rates remain high due to obvious economic value, while processing simplicity enables widespread participation across diverse operator categories. This segment supports overall market development by demonstrating viable business models for solar panel recycling, creating economic foundations that justify infrastructure investments while establishing collection networks that can eventually capture additional material streams as processing technologies and economics improve for more challenging components throughout the photovoltaic waste management value chain.
COMPETITIVE INSIGHTS
Some of the top players operating in the China solar panel recycling market include Trina Solar, Yingli Energy, JinkoSolar, ReSolar, Suzhou Bocai E-Energy, etc.
Trina Solar operates as one of the world’s leading photovoltaic module manufacturers and comprehensive solar energy solutions providers, headquartered in Changzhou, Jiangsu Province, specializing in high-efficiency monocrystalline and polycrystalline solar panels alongside integrated energy systems and services. The company has strategically expanded into solar panel recycling operations, recognizing the long-term importance of circular economy integration and material supply chain security as the industry matures and decommissioning volumes increase substantially.
Trina Solar’s recycling initiatives focus on developing proprietary technologies for recovering high-purity silicon and precious metals from end-of-life panels, creating secondary material streams that reduce manufacturing costs while demonstrating environmental leadership within competitive global markets. The company collaborates with research institutions and technology partners to advance chemical and thermal recycling processes capable of achieving superior recovery rates compared to conventional mechanical methods.
Additionally, Trina Solar maintains extensive relationships with major utilities and solar farm operators throughout China, providing strategic advantages for establishing comprehensive take-back programs and collection networks that ensure efficient material flows into recycling operations. This vertically integrated approach positions the company to capture value throughout the complete product lifecycle, from manufacturing through installation, operation, and eventual material recovery, creating competitive differentiation while advancing sustainability objectives across China’s solar energy sector.
REPORT SYNOPSIS
| REPORT SCOPE | DETAILS |
|---|---|
| Market Forecast Years | 2026-2034 |
| Base Year | 2025 |
| Market Historical Years | 2022-2024 |
| Forecast Units | Revenue ($ Million) |
| Segments Analyzed | Process, Type, Shelf Life, and Material / Recoverable Components |
| Country Analyzed | China |
| Companies Analyzed | SiC Processing GmbH, Trina Solar, Yingli Energy, RESOLAR, Jinko Solar, Suzhou Bocai E-energy |
TABLE OF CONTENTS
RESEARCH SCOPE & METHODOLOGY
- STUDY OBJECTIVES
- METHODOLOGY
- ASSUMPTIONS & LIMITATIONS
EXECUTIVE SUMMARY
- MARKET SIZE & FORECAST
- MARKET OVERVIEW
- SCOPE OF STUDY
- CRISIS SCENARIO ANALYSIS
- MAJOR MARKET FINDINGS
- CHINA HAS THE LARGEST FUTURE SOLAR PANEL WASTE VOLUME DUE TO MASSIVE SOLAR DEPLOYMENT
- THE MARKET IS CURRENTLY DOMINATED BY INFORMAL AND SEMI-FORMAL RECYCLING CHANNELS
- GLASS AND ALUMINUM RECOVERY REPRESENT THE PRIMARY ECONOMIC VALUE STREAMS
- POLICY FRAMEWORKS FOR SOLAR PANEL RECYCLING ARE STILL EVOLVING
MARKET DYNAMICS
- KEY DRIVERS
- LARGE-SCALE SOLAR INSTALLATIONS FROM THE EARLY 2010S ARE APPROACHING THE END OF LIFE
- GOVERNMENT FOCUS ON RESOURCE SECURITY DRIVES INTEREST IN MATERIAL RECOVERY
- STRONG DOMESTIC MANUFACTURING CAPABILITIES ENABLE SCALING OF RECYCLING TECHNOLOGIES
- RISING ENVIRONMENTAL PRESSURES PROMOTE FORMALIZATION OF RECYCLING ACTIVITIES
- KEY RESTRAINTS
- LACK OF CLEAR NATIONAL STANDARDS FOR SOLAR PANEL RECYCLING
- LOW-VALUE RECOVERY FOR SILICON LIMITS INVESTMENT INCENTIVES
- DOMINANCE OF INFORMAL RECYCLERS AFFECTS QUALITY AND TRACEABILITY
- INSUFFICIENT COLLECTION INFRASTRUCTURE IN REMOTE SOLAR FARMS
- KEY DRIVERS
KEY ANALYTICS
- KEY MARKET TRENDS
- GRADUAL SHIFT TOWARD FORMAL AND INDUSTRIAL-SCALE RECYCLING OPERATIONS
- PILOT PROJECTS FOR ADVANCED CHEMICAL AND THERMAL RECYCLING
- INCREASING GOVERNMENT INVOLVEMENT IN SOLAR WASTE POLICY DESIGN
- VERTICAL INTEGRATION BY LARGE SOLAR MANUFACTURERS
- PORTER’S FIVE FORCES ANALYSIS
- BUYERS POWER
- SUPPLIERS POWER
- SUBSTITUTION
- NEW ENTRANTS
- INDUSTRY RIVALRY
- GROWTH PROSPECT MAPPING
- GROWTH PROSPECT MAPPING FOR CHINA
- MARKET MATURITY ANALYSIS
- MARKET CONCENTRATION ANALYSIS
- VALUE CHAIN ANALYSIS
- RAW MATERIAL SUPPLY
- COLLECTION AND LOGISTICS
- DISMANTLING AND SHREDDING
- MATERIAL SORTING
- CHEMICAL PROCESSING
- RECOVERED MATERIAL SUPPLY
- KEY BUYING CRITERIA
- RECYCLING EFFICIENCY
- COST COMPETITIVENESS
- ENVIRONMENTAL COMPLIANCE
- TECHNOLOGICAL ADVANCEMENT
- REGULATORY FRAMEWORK
- KEY MARKET TRENDS
SOLAR PANEL RECYCLING MARKET BY PROCESS
- THERMAL
- MARKET FORECAST FIGURE
- SEGMENT ANALYSIS
- MECHANICAL
- MARKET FORECAST FIGURE
- SEGMENT ANALYSIS
- CHEMICAL
- MARKET FORECAST FIGURE
- SEGMENT ANALYSIS
- LASER
- MARKET FORECAST FIGURE
- SEGMENT ANALYSIS
- THERMAL
SOLAR PANEL RECYCLING MARKET BY TYPE
- SILICON-BASED (C-SI)
- MARKET FORECAST FIGURE
- SEGMENT ANALYSIS
- THIN-FILM
- MARKET FORECAST FIGURE
- SEGMENT ANALYSIS
- OTHER TYPES
- MARKET FORECAST FIGURE
- SEGMENT ANALYSIS
- SILICON-BASED (C-SI)
SOLAR PANEL RECYCLING MARKET BY SHELF LIFE
- EARLY LOSS
- MARKET FORECAST FIGURE
- SEGMENT ANALYSIS
- NORMAL LOSS
- MARKET FORECAST FIGURE
- SEGMENT ANALYSIS
- EARLY LOSS
SOLAR PANEL RECYCLING MARKET BY MATERIAL / RECOVERABLE COMPONENTS
- GLASS
- MARKET FORECAST FIGURE
- SEGMENT ANALYSIS
- ALUMINUM
- MARKET FORECAST FIGURE
- SEGMENT ANALYSIS
- COPPER
- MARKET FORECAST FIGURE
- SEGMENT ANALYSIS
- PLASTIC
- MARKET FORECAST FIGURE
- SEGMENT ANALYSIS
- SILVER
- MARKET FORECAST FIGURE
- SEGMENT ANALYSIS
- PV SILICON
- MARKET FORECAST FIGURE
- SEGMENT ANALYSIS
- OTHER MATERIALS / RECOVERABLE COMPONENTS
- MARKET FORECAST FIGURE
- SEGMENT ANALYSIS
- GLASS
COMPETITIVE LANDSCAPE
- KEY STRATEGIC DEVELOPMENTS
- MERGERS & ACQUISITIONS
- PRODUCT LAUNCHES & DEVELOPMENTS
- PARTNERSHIPS & AGREEMENTS
- BUSINESS EXPANSIONS & DIVESTITURES
- COMPANY PROFILES
- SIC PROCESSING GMBH
- COMPANY OVERVIEW
- PRODUCTS / SERVICES LIST
- STRENGTHS & CHALLENGES
- TRINA SOLAR
- COMPANY OVERVIEW
- PRODUCTS / SERVICES LIST
- STRENGTHS & CHALLENGES
- YINGLI ENERGY
- COMPANY OVERVIEW
- PRODUCTS / SERVICES LIST
- STRENGTHS & CHALLENGES
- RESOLAR
- COMPANY OVERVIEW
- PRODUCTS / SERVICES LIST
- STRENGTHS & CHALLENGES
- JINKO SOLAR
- COMPANY OVERVIEW
- PRODUCTS / SERVICES LIST
- STRENGTHS & CHALLENGES
- SUZHOU BOCAI E-ENERGY
- COMPANY OVERVIEW
- PRODUCTS / SERVICES LIST
- STRENGTHS & CHALLENGES
- SIC PROCESSING GMBH
- KEY STRATEGIC DEVELOPMENTS
LIST OF TABLES
TABLE 1: MARKET SNAPSHOT – SOLAR PANEL RECYCLING
TABLE 2: SOLAR PANEL RECYCLING MARKET REGULATORY FRAMEWORK
TABLE 3: MARKET BY PROCESS, HISTORICAL YEARS, 2022-2024 (IN $ MILLION)
TABLE 4: MARKET BY PROCESS, FORECAST YEARS, 2026-2034 (IN $ MILLION)
TABLE 5: MARKET BY TYPE, HISTORICAL YEARS, 2022-2024 (IN $ MILLION)
TABLE 6: MARKET BY TYPE, FORECAST YEARS, 2026-2034 (IN $ MILLION)
TABLE 7: MARKET BY SHELF LIFE, HISTORICAL YEARS, 2022-2024 (IN $ MILLION)
TABLE 8: MARKET BY SHELF LIFE, FORECAST YEARS, 2026-2034 (IN $ MILLION)
TABLE 9: MARKET BY MATERIAL / RECOVERABLE COMPONENTS, HISTORICAL YEARS, 2022-2024 (IN $ MILLION)
TABLE 10: MARKET BY MATERIAL / RECOVERABLE COMPONENTS, FORECAST YEARS, 2026-2034 (IN $ MILLION)
TABLE 11: KEY PLAYERS OPERATING IN THE CHINESE MARKET
TABLE 12: LIST OF MERGERS & ACQUISITIONS
TABLE 13: LIST OF PRODUCT LAUNCHES & DEVELOPMENTS
TABLE 14: LIST OF PARTNERSHIPS & AGREEMENTS
TABLE 15: LIST OF BUSINESS EXPANSIONS & DIVESTITURES
LIST OF FIGURES
FIGURE 1: KEY MARKET TRENDS
FIGURE 2: PORTER’S FIVE FORCES ANALYSIS
FIGURE 3: GROWTH PROSPECT MAPPING FOR CHINA
FIGURE 4: MARKET MATURITY ANALYSIS
FIGURE 5: MARKET CONCENTRATION ANALYSIS
FIGURE 6: VALUE CHAIN ANALYSIS
FIGURE 7: KEY BUYING CRITERIA
FIGURE 8: SEGMENT GROWTH POTENTIAL, BY PROCESS, IN 2025
FIGURE 9: THERMAL MARKET SIZE, 2026-2034 (IN $ MILLION)
FIGURE 10: MECHANICAL MARKET SIZE, 2026-2034 (IN $ MILLION)
FIGURE 11: CHEMICAL MARKET SIZE, 2026-2034 (IN $ MILLION)
FIGURE 12: LASER MARKET SIZE, 2026-2034 (IN $ MILLION)
FIGURE 13: SEGMENT GROWTH POTENTIAL, BY TYPE, IN 2025
FIGURE 14: SILICON-BASED (C-SI) MARKET SIZE, 2026-2034 (IN $ MILLION)
FIGURE 15: THIN-FILM MARKET SIZE, 2026-2034 (IN $ MILLION)
FIGURE 16: OTHER TYPES MARKET SIZE, 2026-2034 (IN $ MILLION)
FIGURE 17: SEGMENT GROWTH POTENTIAL, BY SHELF LIFE, IN 2025
FIGURE 18: EARLY LOSS MARKET SIZE, 2026-2034 (IN $ MILLION)
FIGURE 19: NORMAL LOSS MARKET SIZE, 2026-2034 (IN $ MILLION)
FIGURE 20: SEGMENT GROWTH POTENTIAL, BY MATERIAL / RECOVERABLE COMPONENTS, IN 2025
FIGURE 21: GLASS MARKET SIZE, 2026-2034 (IN $ MILLION)
FIGURE 22: ALUMINUM MARKET SIZE, 2026-2034 (IN $ MILLION)
FIGURE 23: COPPER MARKET SIZE, 2026-2034 (IN $ MILLION)
FIGURE 24: PLASTIC MARKET SIZE, 2026-2034 (IN $ MILLION)
FIGURE 25: SILVER MARKET SIZE, 2026-2034 (IN $ MILLION)
FIGURE 26: PV SILICON MARKET SIZE, 2026-2034 (IN $ MILLION)
FIGURE 27: OTHER MATERIALS / RECOVERABLE COMPONENTS MARKET SIZE, 2026-2034 (IN $ MILLION)
FAQ’s
RELATED REPORTS
-

UNITED STATES AI-DRIVEN CLOUD MIGRATION SERVICES MARKET FORECAST 2026-2034
-

UNITED KINGDOM AI-DRIVEN CLOUD MIGRATION SERVICES MARKET FORECAST 2026-2034
-

UNITED ARAB EMIRATES AI-DRIVEN CLOUD MIGRATION SERVICES MARKET FORECAST 2026-2034
-

SOUTH KOREA AI-DRIVEN CLOUD MIGRATION SERVICES MARKET FORECAST 2026-2034
-

SINGAPORE AI-DRIVEN CLOUD MIGRATION SERVICES MARKET FORECAST 2026-2034
-

SAUDI ARABIA AI-DRIVEN CLOUD MIGRATION SERVICES MARKET FORECAST 2026-2034
-

AUSTRALIA AI-DRIVEN CLOUD MIGRATION SERVICES MARKET FORECAST 2026-2034
-

JAPAN AI-DRIVEN CLOUD MIGRATION SERVICES MARKET FORECAST 2026-2034
-

INDIA AI-DRIVEN CLOUD MIGRATION SERVICES MARKET FORECAST 2026-2034
-

CHINA AI-DRIVEN CLOUD MIGRATION SERVICES MARKET FORECAST 2026-2034