Chile Green Hydrogen Market by Technology (Alkaline Electrolyzer, Polymer Electrolyte Membrane (PEM) Electrolyzer, SOEC Electrolyzer), Market by Application (Power Generation, Transport, Other Applications), Market by Distribution Channel (Pipeline, Cargo), by Geography
CHILE GREEN HYDROGEN MARKET OVERVIEW
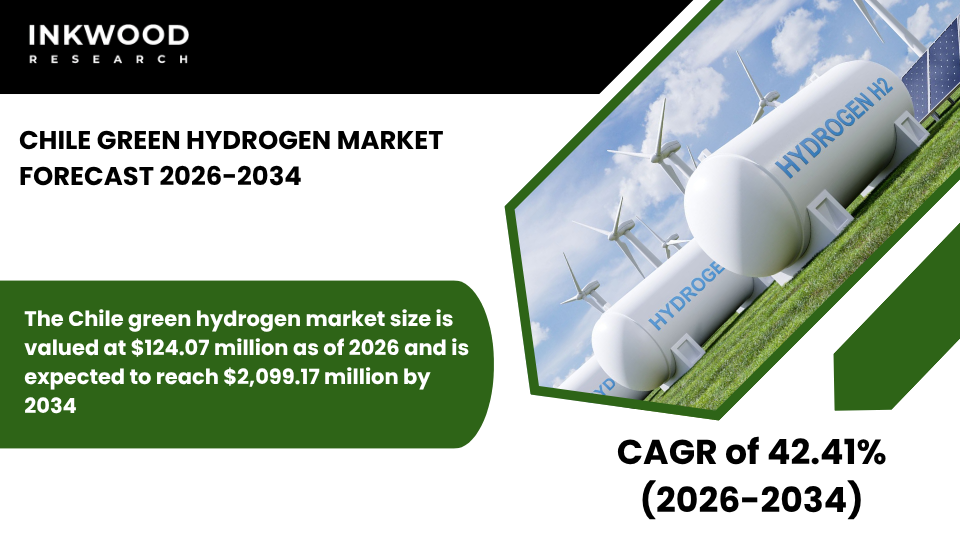
The Chile green hydrogen market size is valued at $124.07 million as of 2026 and is expected to reach $2,099.17 million by 2034, progressing with a CAGR of 42.41% during the forecast years, 2026-2034.
Chile’s green hydrogen market benefits enormously from world-class wind capacity factors that enable exceptionally high electrolyzer utilization rates and optimal production economics. The Patagonian region, particularly Magallanes, experiences sustained wind speeds exceeding industry averages throughout the year.
Moreover, capacity factors regularly surpass 60% in optimal locations, significantly outperforming global benchmarks and enabling continuous electrolyzer operations. This consistent renewable generation translates directly into lower levelized hydrogen costs by maximizing asset utilization and spreading fixed costs across larger production volumes.
Furthermore, Chile’s Atacama Desert in the north offers some of the world’s highest solar irradiation levels, creating complementary opportunities for hybrid renewable installations. According to the Chilean Ministry of Energy, the country possesses renewable energy potential exceeding 70 times its current electricity demand, providing virtually unlimited clean power for hydrogen production.
These exceptional natural endowments position Chile to achieve globally competitive production costs that rival established energy exporters. Subsequently, renewable resource quality serves as the fundamental driver enabling Chile’s emergence as a potential green hydrogen powerhouse.
A clear national green hydrogen strategy provides essential policy certainty that attracts international investment and accelerates project development timelines. The Chilean government launched its National Green Hydrogen Strategy in 2020, establishing explicit production targets and regulatory frameworks guiding market evolution. This strategy aims to produce the world’s cheapest green hydrogen by 2030 and become a leading exporter by 2040.
Moreover, the government has committed significant public funding to support pilot projects, infrastructure development, and technology demonstration initiatives. The Ministry of Energy coordinates closely with regional governments to streamline permitting processes and facilitate land access for renewable installations.
To Know More About This Report, Request a Free Sample Copy
Furthermore, Chile’s commitment to carbon neutrality by 2050 creates alignment between hydrogen policy and broader climate objectives. This coherent policy environment reduces investment uncertainty that constrains market development in countries lacking a clear strategic direction. Therefore, government commitment establishes foundational conditions enabling private sector confidence and capital deployment.
Proximity to Asian markets supports export potential by reducing transportation costs and enhancing economic competitiveness versus distant production locations. Chile’s Pacific coastline provides direct maritime access to major Asian demand centers, including Japan, South Korea, and China.
Furthermore, established shipping routes and port infrastructure supporting existing commodity exports can be adapted for green ammonia and hydrogen derivative transport. This geographic advantage becomes increasingly valuable as Asian nations implement hydrogen strategies dependent on international supply chains.
Additionally, time zone compatibility and cultural ties facilitate business relationships and commercial negotiations with Asian trading partners. Chile has already signed preliminary cooperation agreements with several Asian governments exploring long-term hydrogen import arrangements.
These bilateral frameworks create pathways for offtake contracts that provide revenue certainty, supporting project financing. Consequently, strategic positioning relative to high-value Asian markets enhances Chile’s export competitiveness compared to Atlantic-focused producers.
Growing interest from mining and heavy industry in low-carbon fuels creates potential domestic demand that complements export-oriented development strategies. Chile’s copper mining sector, which dominates global production, faces increasing pressure to reduce operational carbon footprints from energy-intensive processes.
Mining companies are exploring green hydrogen applications for heavy-duty transportation, material handling equipment, and industrial processes currently dependent on diesel fuel. Furthermore, pilot projects are demonstrating the technical feasibility of hydrogen fuel cell trucks for mine site operations in remote locations.
According to Codelco, Chile’s state-owned mining company, hydrogen integration could significantly reduce emissions while improving air quality at mining sites. This domestic demand potential provides market diversification that reduces dependence on uncertain export markets.
Moreover, mining sector adoption would accelerate infrastructure development, including transport networks and refueling stations, supporting broader market expansion. Therefore, industrial decarbonization creates near-term demand opportunities that bridge the timeline until large-scale export operations commence.
Strong international developer interest is accelerating project announcements and capital commitments throughout Chile’s strategic production regions. European energy companies, including TotalEnergies, ENGIE, and Enel Green Power, have committed substantial investments toward Chilean green hydrogen projects.
Similarly, Asian corporations seeking secure long-term supply sources are participating in joint ventures and development partnerships. This international participation brings essential technology expertise, project development capabilities, and access to global capital markets. Furthermore, foreign involvement validates Chile’s potential and attracts additional investors seeking portfolio diversification across multiple jurisdictions.
The concentration of announced projects in Magallanes and Antofagasta regions is creating emerging hydrogen clusters with shared infrastructure and knowledge spillovers. Additionally, international developers provide critical connections to target export markets through existing customer relationships and distribution networks. Subsequently, foreign direct investment accelerates market maturation while transferring technical capabilities to Chilean partners and the workforce.
The Chile green hydrogen market is segmented into technology, application, and distribution channel. The technology segment is further categorized into alkaline electrolyzer, polymer electrolyte membrane (PEM) electrolyzer, and SOEC electrolyzer.
Polymer electrolyte membrane (PEM) electrolysis technology is gaining significant traction within Chile’s green hydrogen market due to its operational flexibility and compatibility with variable renewable energy generation. This technology employs a solid polymer membrane as the electrolyte, enabling compact system designs and rapid response capabilities essential for wind and solar integration.
PEM electrolyzers demonstrate superior dynamic performance compared to alkaline alternatives, ramping output from zero to full capacity within seconds. This characteristic proves particularly valuable in Patagonia, where wind resources exhibit natural variability requiring responsive load management.
Furthermore, PEM systems operate efficiently across wide power ranges, maintaining acceptable performance even during partial load operation when renewable generation fluctuates. The technology’s compact footprint reduces civil engineering requirements and enables modular installations suited to Chile’s remote project locations.
Additionally, PEM electrolyzers produce high-purity hydrogen exceeding 99.9%, eliminating downstream purification requirements for applications with strict quality specifications. International technology providers, including Siemens Energy and Cummins Inc are supplying PEM systems for Chilean projects, bringing proven equipment and operational expertise.
Moreover, declining electrolyzer costs combined with improving efficiency metrics enhance PEM technology’s economic competitiveness. Therefore, PEM electrolysis represents a strategic technology choice enabling optimal renewable energy utilization across Chile’s diverse resource landscapes.
Some of the top players operating in the Chile green hydrogen market include ENGIE, Air Liquide, Siemens Energy, and TotalEnergies.
ENGIE operates as a global energy and services company headquartered in Paris, France, with expanding renewable energy and green hydrogen operations throughout Latin America. The company specializes in low-carbon power generation, natural gas infrastructure, energy services, and increasingly, green hydrogen production and distribution systems.
ENGIE’s product portfolio encompasses renewable electricity from wind, solar, and hydroelectric facilities, natural gas trading and distribution, energy efficiency solutions, and integrated hydrogen value chains. Moreover, ENGIE is developing the HyEx project in Chile’s Magallanes region, targeting large-scale green hydrogen and ammonia production for export markets.
The company operates across approximately 30 countries, leveraging diverse geographical presence and technical capabilities to deliver integrated energy solutions. ENGIE’s business model emphasizes long-term concessions, power purchase agreements, and strategic partnerships that provide stable revenue streams supporting capital-intensive infrastructure investments.
Furthermore, the company maintains strong relationships with European industrial customers and utilities seeking secure green hydrogen supplies, creating natural offtake channels for Chilean production. This vertical integration spanning renewable generation through end-user markets positions ENGIE advantageously within Chile’s emerging hydrogen ecosystem.
REPORT SYNOPSIS
| REPORT SCOPE | DETAILS |
|---|---|
| Market Forecast Years | 2026-2034 |
| Base Year | 2025 |
| Market Historical Years | 2022-2024 |
| Forecast Units | Revenue ($ Million) |
| Segments Analyzed | Technology, Application, and Distribution Channel |
| Country Analyzed | Chile |
| Companies Analyzed | Air Liquide, Air Products and Chemicals Inc, Cummins Inc, ENGIE, Linde PLC, Siemens Energy, TotalEnergies |
TABLE OF CONTENTS
RESEARCH SCOPE & METHODOLOGY
- STUDY OBJECTIVES
- METHODOLOGY
- ASSUMPTIONS & LIMITATIONS
EXECUTIVE SUMMARY
- MARKET SIZE & FORECAST
- MARKET OVERVIEW
- SCOPE OF STUDY
- CRISIS SCENARIO ANALYSIS
- MAJOR MARKET FINDINGS
- CHILE IS POSITIONED AS A LOW-COST GREEN HYDROGEN PRODUCER DUE TO EXCEPTIONAL WIND AND SOLAR RESOURCES
- PATAGONIA AND NORTHERN REGIONS ARE THE PRIMARY PRODUCTION HOTSPOTS
- EXPORT MARKETS ARE CENTRAL TO THE LONG-TERM COMMERCIAL STRATEGY
- THE MARKET IS CHARACTERIZED BY STRONG INTERNATIONAL DEVELOPER INTEREST
MARKET DYNAMICS
- KEY DRIVERS
- WORLD-CLASS WIND CAPACITY FACTORS ENABLE HIGH ELECTROLYZER UTILIZATION
- CLEAR NATIONAL GREEN HYDROGEN STRATEGY PROVIDES POLICY CERTAINTY
- PROXIMITY TO ASIAN MARKETS SUPPORTS EXPORT POTENTIAL
- GROWING INTEREST FROM MINING AND HEAVY INDUSTRY IN LOW-CARBON FUELS
- KEY RESTRAINTS
- REMOTE PROJECT LOCATIONS INCREASE INFRASTRUCTURE AND LOGISTICS COSTS
- LIMITED PORT AND TRANSMISSION INFRASTRUCTURE REQUIRES SIGNIFICANT UPGRADES
- FINANCING LARGE PROJECTS REMAINS CHALLENGING DUE TO MARKET IMMATURITY
- LACK OF DOMESTIC HYDROGEN DEMAND SLOWS EARLY MARKET DEVELOPMENT
- KEY DRIVERS
KEY ANALYTICS
- KEY MARKET TRENDS
- STRONG FOCUS ON GREEN AMMONIA AND EFUELS FOR EXPORT
- EUROPEAN AND ASIAN COMPANIES ARE LEADING PROJECT DEVELOPMENT
- PUBLIC FUNDING IS BEING USED TO DE-RISK EARLY-STAGE PROJECTS
- INTEGRATION OF HYDROGEN INTO MINING DECARBONIZATION STRATEGIES IS INCREASING
- PORTER’S FIVE FORCES ANALYSIS
- BUYERS POWER
- SUPPLIERS POWER
- SUBSTITUTION
- NEW ENTRANTS
- INDUSTRY RIVALRY
- GROWTH PROSPECT MAPPING
- GROWTH PROSPECT MAPPING FOR CHILE
- MARKET MATURITY ANALYSIS
- MARKET CONCENTRATION ANALYSIS
- VALUE CHAIN ANALYSIS
- RENEWABLE POWER GENERATION
- ELECTROLYZER MANUFACTURING
- HYDROGEN PRODUCTION
- COMPRESSION AND STORAGE
- TRANSPORT AND LOGISTICS
- END USE APPLICATIONS
- KEY BUYING CRITERIA
- LEVELIZED HYDROGEN COST
- SUPPLY RELIABILITY
- TECHNOLOGY EFFICIENCY
- POLICY INCENTIVE ACCESS
- REGULATORY FRAMEWORK
- KEY MARKET TRENDS
GREEN HYDROGEN MARKET BY TECHNOLOGY
- ALKALINE ELECTROLYZER
- MARKET FORECAST FIGURE
- SEGMENT ANALYSIS
- POLYMER ELECTROLYTE MEMBRANE (PEM) ELECTROLYZER
- MARKET FORECAST FIGURE
- SEGMENT ANALYSIS
- SOEC ELECTROLYZER
- MARKET FORECAST FIGURE
- SEGMENT ANALYSIS
- ALKALINE ELECTROLYZER
GREEN HYDROGEN MARKET BY APPLICATION
- POWER GENERATION
- MARKET FORECAST FIGURE
- SEGMENT ANALYSIS
- TRANSPORT
- MARKET FORECAST FIGURE
- SEGMENT ANALYSIS
- OTHER APPLICATIONS
- MARKET FORECAST FIGURE
- SEGMENT ANALYSIS
- POWER GENERATION
GREEN HYDROGEN MARKET BY DISTRIBUTION CHANNEL
- PIPELINE
- MARKET FORECAST FIGURE
- SEGMENT ANALYSIS
- CARGO
- MARKET FORECAST FIGURE
- SEGMENT ANALYSIS
- PIPELINE
COUNTRY ANALYSIS
- CHILE
- CHILE ENERGY PROFILE
- IMPORTANT INSTITUTIONS & POLICIES FOR THE ENERGY SECTOR IN CHILE
- CHILE GREEN HYDROGEN INDUSTRY: OVERVIEW
- GREEN HYDROGEN PROJECTS IN CHILE
- CHILE
COMPETITIVE LANDSCAPE
- KEY STRATEGIC DEVELOPMENTS
- MERGERS & ACQUISITIONS
- PRODUCT LAUNCHES & DEVELOPMENTS
- PARTNERSHIPS & AGREEMENTS
- BUSINESS EXPANSIONS & DIVESTITURES
- COMPANY PROFILES
- ACWA POWER
- COMPANY OVERVIEW
- PRODUCT LIST
- STRENGTHS & CHALLENGES
- AIR LIQUIDE
- COMPANY OVERVIEW
- PRODUCT LIST
- STRENGTHS & CHALLENGES
- AIR PRODUCTS AND CHEMICALS INC
- COMPANY OVERVIEW
- PRODUCT LIST
- STRENGTHS & CHALLENGES
- CUMMINS INC
- COMPANY OVERVIEW
- PRODUCT LIST
- STRENGTHS & CHALLENGES
- ENGIE
- COMPANY OVERVIEW
- PRODUCT LIST
- STRENGTHS & CHALLENGES
- LINDE PLC
- COMPANY OVERVIEW
- PRODUCT LIST
- STRENGTHS & CHALLENGES
- SIEMENS ENERGY
- COMPANY OVERVIEW
- PRODUCT LIST
- STRENGTHS & CHALLENGES
- SHELL
- COMPANY OVERVIEW
- PRODUCT LIST
- STRENGTHS & CHALLENGES
- TOTAL
- COMPANY OVERVIEW
- PRODUCT LIST
- STRENGTHS & CHALLENGES
- ACWA POWER
- KEY STRATEGIC DEVELOPMENTS
LIST OF TABLES
TABLE 1: MARKET SNAPSHOT – GREEN HYDROGEN
TABLE 2: GREEN HYDROGEN MARKET REGULATORY FRAMEWORK
TABLE 3: MARKET BY TECHNOLOGY, HISTORICAL YEARS, 2022-2024 (IN $ MILLION)
TABLE 4: MARKET BY TECHNOLOGY, FORECAST YEARS, 2026-2034 (IN $ MILLION)
TABLE 5: MARKET BY TECHNOLOGY, HISTORICAL YEARS, 2022-2024 (IN KILOTONS)
TABLE 6: MARKET BY TECHNOLOGY, FORECAST YEARS, 2026-2034 (IN KILOTONS)
TABLE 7: ALKALINE ELECTROLYZER MARKET, HISTORICAL YEARS, 2022-2024 (IN $ MILLION)
TABLE 8: ALKALINE ELECTROLYZER MARKET, FORECAST YEARS, 2026-2034 (IN $ MILLION)
TABLE 9: ALKALINE ELECTROLYZER MARKET, HISTORICAL YEARS, 2022-2024 (IN KILOTONS)
TABLE 10: ALKALINE ELECTROLYZER MARKET, FORECAST YEARS, 2026-2034 (IN KILOTONS)
TABLE 11: POLYMER ELECTROLYTE MEMBRANE (PEM) ELECTROLYZER MARKET, HISTORICAL YEARS, 2022-2024 (IN $ MILLION)
TABLE 12: POLYMER ELECTROLYTE MEMBRANE (PEM) ELECTROLYZER MARKET, FORECAST YEARS, 2026-2034 (IN $ MILLION)
TABLE 13: POLYMER ELECTROLYTE MEMBRANE (PEM) ELECTROLYZER MARKET, HISTORICAL YEARS, 2022-2024 (IN KILOTONS)
TABLE 14: POLYMER ELECTROLYTE MEMBRANE (PEM) ELECTROLYZER MARKET, FORECAST YEARS, 2026-2034 (IN KILOTONS)
TABLE 15: SOEC ELECTROLYZER MARKET, HISTORICAL YEARS, 2022-2024 (IN $ MILLION)
TABLE 16: SOEC ELECTROLYZER MARKET, FORECAST YEARS, 2026-2034 (IN $ MILLION)
TABLE 17: SOEC ELECTROLYZER MARKET, HISTORICAL YEARS, 2022-2024 (IN KILOTONS)
TABLE 18: SOEC ELECTROLYZER MARKET, FORECAST YEARS, 2026-2034 (IN KILOTONS)
TABLE 19: MARKET BY APPLICATION, HISTORICAL YEARS, 2022-2024 (IN $ MILLION)
TABLE 20: MARKET BY APPLICATION, FORECAST YEARS, 2026-2034 (IN $ MILLION)
TABLE 21: MARKET BY APPLICATION, HISTORICAL YEARS, 2022-2024 (IN KILOTONS)
TABLE 22: MARKET BY APPLICATION, FORECAST YEARS, 2026-2034 (IN KILOTONS)
TABLE 23: POWER GENERATION MARKET, HISTORICAL YEARS, 2022-2024 (IN $ MILLION)
TABLE 24: POWER GENERATION MARKET, FORECAST YEARS, 2026-2034 (IN $ MILLION)
TABLE 25: POWER GENERATION MARKET, HISTORICAL YEARS, 2022-2024 (IN KILOTONS)
TABLE 26: POWER GENERATION MARKET, FORECAST YEARS, 2026-2034 (IN KILOTONS)
TABLE 27: TRANSPORT MARKET, HISTORICAL YEARS, 2022-2024 (IN $ MILLION)
TABLE 28: TRANSPORT MARKET, FORECAST YEARS, 2026-2034 (IN $ MILLION)
TABLE 29: TRANSPORT MARKET, HISTORICAL YEARS, 2022-2024 (IN KILOTONS)
TABLE 30: TRANSPORT MARKET, FORECAST YEARS, 2026-2034 (IN KILOTONS)
TABLE 31: OTHER APPLICATIONS MARKET, HISTORICAL YEARS, 2022-2024 (IN $ MILLION)
TABLE 32: OTHER APPLICATIONS MARKET, FORECAST YEARS, 2026-2034 (IN $ MILLION)
TABLE 33: OTHER APPLICATIONS MARKET, HISTORICAL YEARS, 2022-2024 (IN KILOTONS)
TABLE 34: OTHER APPLICATIONS MARKET, FORECAST YEARS, 2026-2034 (IN KILOTONS)
TABLE 35: MARKET BY DISTRIBUTION CHANNEL, HISTORICAL YEARS, 2022-2024 (IN $ MILLION)
TABLE 36: MARKET BY DISTRIBUTION CHANNEL, FORECAST YEARS, 2026-2034 (IN $ MILLION)
TABLE 37: MARKET BY DISTRIBUTION CHANNEL, HISTORICAL YEARS, 2022-2024 (IN KILOTONS)
TABLE 38: MARKET BY DISTRIBUTION CHANNEL, FORECAST YEARS, 2026-2034 (IN KILOTONS)
TABLE 39: PIPELINE MARKET, HISTORICAL YEARS, 2022-2024 (IN $ MILLION)
TABLE 40: PIPELINE MARKET, FORECAST YEARS, 2026-2034 (IN $ MILLION)
TABLE 41: PIPELINE MARKET, HISTORICAL YEARS, 2022-2024 (IN KILOTONS)
TABLE 42: PIPELINE MARKET, FORECAST YEARS, 2026-2034 (IN KILOTONS)
TABLE 43: CARGO MARKET, HISTORICAL YEARS, 2022-2024 (IN $ MILLION)
TABLE 44: CARGO MARKET, FORECAST YEARS, 2026-2034 (IN $ MILLION)
TABLE 45: CARGO MARKET, HISTORICAL YEARS, 2022-2024 (IN KILOTONS)
TABLE 46: CARGO MARKET, FORECAST YEARS, 2026-2034 (IN KILOTONS)
TABLE 47: KEY PLAYERS OPERATING IN THE CHILEAN MARKET
TABLE 48: LIST OF MERGERS & ACQUISITIONS
TABLE 49: LIST OF PRODUCT LAUNCHES & DEVELOPMENTS
TABLE 50: LIST OF PARTNERSHIPS & AGREEMENTS
TABLE 51: LIST OF BUSINESS EXPANSIONS & DIVESTITURES
LIST OF FIGURES
FIGURE 1: KEY MARKET TRENDS
FIGURE 2: PORTER’S FIVE FORCES ANALYSIS
FIGURE 3: GROWTH PROSPECT MAPPING FOR CHILE
FIGURE 4: MARKET MATURITY ANALYSIS
FIGURE 5: MARKET CONCENTRATION ANALYSIS
FIGURE 6: VALUE CHAIN ANALYSIS
FIGURE 7: KEY BUYING CRITERIA
FIGURE 8: SEGMENT GROWTH POTENTIAL, BY TECHNOLOGY, IN 2025
FIGURE 9: ALKALINE ELECTROLYZER MARKET SIZE, 2026-2034 (IN $ MILLION)
FIGURE 10: POLYMER ELECTROLYTE MEMBRANE (PEM) ELECTROLYZER MARKET SIZE, 2026-2034 (IN $ MILLION)
FIGURE 11: SOEC ELECTROLYZER MARKET SIZE, 2026-2034 (IN $ MILLION)
FIGURE 12: SEGMENT GROWTH POTENTIAL, BY APPLICATION, IN 2025
FIGURE 13: POWER GENERATION MARKET SIZE, 2026-2034 (IN $ MILLION)
FIGURE 14: TRANSPORT MARKET SIZE, 2026-2034 (IN $ MILLION)
FIGURE 15: OTHER APPLICATIONS MARKET SIZE, 2026-2034 (IN $ MILLION)
FIGURE 16: SEGMENT GROWTH POTENTIAL, BY DISTRIBUTION CHANNEL, IN 2025
FIGURE 17: PIPELINE MARKET SIZE, 2026-2034 (IN $ MILLION)
FIGURE 18: CARGO MARKET SIZE, 2026-2034 (IN $ MILLION)
FIGURE 19: CHILE GREEN HYDROGEN MARKET, COUNTRY OUTLOOK, 2025 & 2034 (IN %)
FAQ’s
RELATED REPORTS
-

UNITED STATES AI-DRIVEN CLOUD MIGRATION SERVICES MARKET FORECAST 2026-2034
-

UNITED KINGDOM AI-DRIVEN CLOUD MIGRATION SERVICES MARKET FORECAST 2026-2034
-

UNITED ARAB EMIRATES AI-DRIVEN CLOUD MIGRATION SERVICES MARKET FORECAST 2026-2034
-

SOUTH KOREA AI-DRIVEN CLOUD MIGRATION SERVICES MARKET FORECAST 2026-2034
-

SINGAPORE AI-DRIVEN CLOUD MIGRATION SERVICES MARKET FORECAST 2026-2034
-

SAUDI ARABIA AI-DRIVEN CLOUD MIGRATION SERVICES MARKET FORECAST 2026-2034
-

AUSTRALIA AI-DRIVEN CLOUD MIGRATION SERVICES MARKET FORECAST 2026-2034
-

JAPAN AI-DRIVEN CLOUD MIGRATION SERVICES MARKET FORECAST 2026-2034
-

INDIA AI-DRIVEN CLOUD MIGRATION SERVICES MARKET FORECAST 2026-2034
-

CHINA AI-DRIVEN CLOUD MIGRATION SERVICES MARKET FORECAST 2026-2034