Australia & New Zealand Liquefied Natural Gas (LNG) Market by LNG Infrastructure (LNG Liquefaction Plants, LNG Regasification Facilities, LNG Shipping & Transportation) Market by Application (Transportation, Industrial Feedstock, Power Generation, Other Applications) Market by Mode of Supply (Truck, Transshipment and Bunkering, Pipeline and Rail)
AUSTRALIA & NEW ZEALAND LIQUEFIED NATURAL GAS (LNG) MARKET OVERVIEW
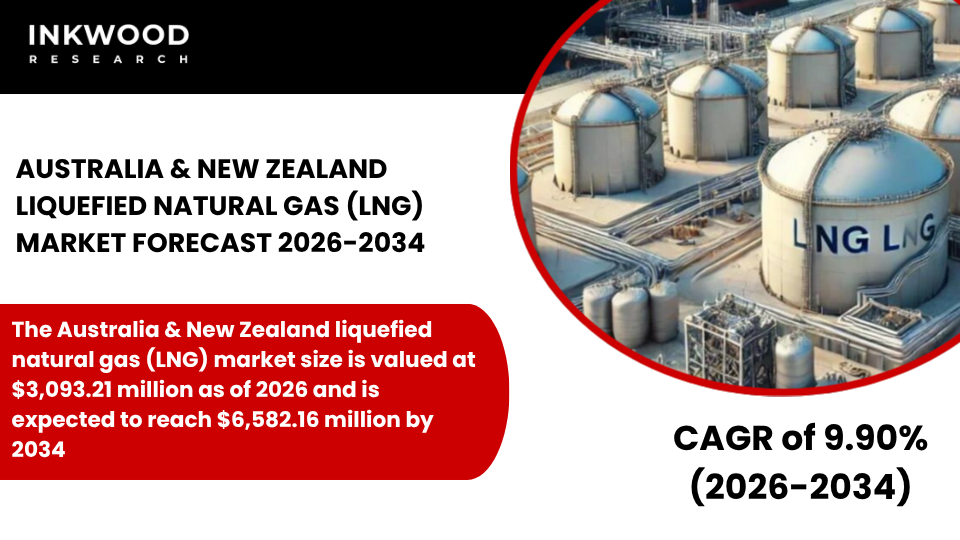
The Australia & New Zealand liquefied natural gas (LNG) market size is valued at $3,093.21 million as of 2026 and is expected to reach $6,582.16 million by 2034, progressing with a CAGR of 9.90% during the forecast years, 2026-2034.
Strong demand from Asian markets drives the growth of this liquefied natural gas market. Australia’s established export infrastructure connects directly to energy-hungry economies across the region. Moreover, long-term supply contracts provide revenue stability for operators. Government policies actively support export-oriented development while balancing domestic energy security.
Additionally, the transition toward cleaner energy solutions positions liquefied natural gas as a bridge fuel. Industrial sectors increasingly adopt natural gas as an alternative to coal-based power generation. Furthermore, transportation fuel applications expand as marine and heavy-duty vehicle operators seek lower-emission options. Strategic investments in liquefaction plant capacity enhancement optimize existing facilities rather than building new ones.
Australia dominates the regional liquefied natural gas landscape through extensive export operations. The country hosts multiple large-scale liquefaction facilities along its northwest and eastern coastlines. According to the Australian Government’s Department of Industry, Science and Resources, Australia ranks among the world’s top LNG exporters. These facilities process natural gas reserves from both offshore and onshore fields.
Consequently, Australian LNG primarily serves power generation needs across Japan, China, and South Korea. Environmental regulations increasingly emphasize carbon capture integration at liquefaction plant sites. Meanwhile, domestic gas security policies require producers to demonstrate adequate local supply before approving exports.
Australian operators focus on maximizing efficiency from existing infrastructure rather than pursuing greenfield developments. Production optimization programs further reduce operational costs while maintaining output levels. However, declining field productivity in mature basins necessitates ongoing exploration investment.
To Know More About This Report, Request a Free Sample Copy
The shift toward renewable energy creates competitive pressure on the natural gas market. Despite this, Australia’s geographical proximity to Asian markets provides a strategic advantage. Export terminals continue upgrading facilities to produce low-emission certified LNG products. This approach addresses growing buyer preferences for cleaner energy sources.
New Zealand maintains a more modest position in the liquefied natural gas sector. The country relies primarily on domestic natural gas production for local consumption needs. According to research, New Zealand is actively planning to import liquefied natural gas (LNG) to supplement its dwindling domestic gas supply.
The Taranaki region contains most of New Zealand’s natural gas reserves and production infrastructure. Unlike Australia, New Zealand does not operate large-scale export-focused liquefaction facilities. Instead, the nation prioritizes renewable energy development for power generation requirements. Natural gas serves as backup capacity when hydroelectric output decreases during dry seasons.
Furthermore, New Zealand’s energy policy emphasizes decarbonization while recognizing natural gas as a transitional fuel. The government supports initiatives that reduce emissions from existing gas-fired power generation plants. Additionally, industrial feedstock applications, particularly in manufacturing, depend on reliable natural gas supplies.
However, declining domestic production from aging fields creates supply concerns. Therefore, policymakers evaluate options for small-scale LNG import terminals to ensure energy security. The transportation fuel sector shows limited adoption compared to Australia. Yet, potential exists for LNG use in shipping and heavy transport as emission standards tighten.
The Australia & New Zealand liquefied natural gas (LNG) market is segmented into LNG infrastructure, application, and mode of supply. The LNG infrastructure segment is further categorized into LNG liquefaction plants and LNG regasification facilities.
Power generation represents a critical application segment throughout both countries. Gas-fired power plants provide flexible capacity that complements intermittent renewable energy sources. During periods when wind and solar output fall short, these facilities rapidly scale up production.
Consequently, liquefied natural gas ensures grid stability as renewable penetration increases. Australian utilities maintain significant gas-fired capacity to balance their electricity networks. Meanwhile, New Zealand employs similar strategies during seasonal hydroelectric variability.
Furthermore, industrial manufacturers depend on reliable natural gas for process heat applications. The chemical and food processing sectors particularly value this consistent energy supply. Transportation fuel applications gain traction as shipping companies seek alternatives to heavy fuel oil. Cleaner energy requirements drive maritime operators toward LNG bunkering solutions at major ports.
Some of the top players operating in the Australia & New Zealand liquefied natural gas (LNG) market include Woodside Energy, Santos, Chevron Australia, and Origin Energy, etc.
Woodside Energy stands as Australia’s largest independent energy company, headquartered in Perth, Western Australia. The company operates major LNG production facilities, including the North West Shelf Project and Pluto LNG. Additionally, Woodside manages exploration and production activities across multiple offshore gas fields.
The company’s business model focuses on integrated operations spanning from natural gas extraction through liquefaction plant processing to global export delivery. The company maintains long-term supply agreements with Asian buyers, ensuring stable revenue streams. Recently, Woodside has emphasized lower-emission LNG production through operational efficiency improvements and carbon offset programs.
REPORT SYNOPSIS
| REPORT SCOPE | DETAILS |
|---|---|
| Market Forecast Years | 2026-2034 |
| Base Year | 2025 |
| Market Historical Years | 2022-2024 |
| Forecast Units | Revenue ($ Million) |
| Segments Analyzed | LNG Infrastructure, Application, and Mode of Supply |
| Country Analyzed | Australia & New Zealand |
| Companies Analyzed | Woodside Energy, Santos, Chevron Australia, ConocoPhillips, Origin Energy, Todd Energy, FirstGas |
TABLE OF CONTENTS
RESEARCH SCOPE & METHODOLOGY
- STUDY OBJECTIVES
- METHODOLOGY
- ASSUMPTIONS & LIMITATIONS
EXECUTIVE SUMMARY
- MARKET SIZE, SHARE & ESTIMATES
- MARKET OVERVIEW
- SCOPE OF STUDY
- CRISIS SCENARIO ANALYSIS
- MAJOR MARKET FINDINGS
- AUSTRALIA MAINTAINS SIGNIFICANT LNG EXPORT CAPACITY FOCUSED ON ASIAN MARKETS
- NEW ZEALAND RELIES ON LIMITED DOMESTIC PRODUCTION AND MODEST LNG IMPORTS
- AUSTRALIA SUPPORTS GLOBAL LNG SUPPLY THROUGH ESTABLISHED PROJECTS
- BOTH COUNTRIES ALIGN LNG ACTIVITIES WITH ENERGY TRANSITION OBJECTIVES
MARKET DYNAMICS
- KEY DRIVERS
- STRONG ASIAN DEMAND SUSTAINS AUSTRALIAN LNG EXPORT VOLUMES
- EXISTING INFRASTRUCTURE FACILITATES RELIABLE EXPORT OPERATIONS
- STRATEGIC CONTRACTS ENSURE MARKET ACCESS AND REVENUE STABILITY
- GOVERNMENT POLICIES SUPPORT EXPORT-ORIENTED DEVELOPMENT
- KEY RESTRAINTS
- EMERGING GLOBAL SUPPLY GLUT CREATES COMPETITIVE PRESSURES
- DOMESTIC GAS SECURITY CONCERNS IN AUSTRALIA IMPACT EXPORT ALLOCATIONS
- ENVIRONMENTAL AND EMISSIONS REGULATIONS CHALLENGE OPERATIONS
- DECLINING FIELD PRODUCTIVITY REQUIRES CONTINUED INVESTMENT
- KEY DRIVERS
STRATEGIC MARKET ANALYTICS
- KEY MARKET TRENDS
- AUSTRALIA EMPHASIZES OPTIMIZATION OF EXISTING PROJECTS FOR EFFICIENCY
- INCREASING FOCUS ON LOW-EMISSION AND CERTIFIED LNG PRODUCTION
- EXPLORATION OF CARBON CAPTURE INTEGRATION IN LNG OPERATIONS
- NEW ZEALAND PRIORITIZES RENEWABLES WHILE MAINTAINING LNG FLEXIBILITY
- PORTER’S FIVE FORCES ANALYSIS
- BUYERS POWER
- SUPPLIERS POWER
- SUBSTITUTION
- NEW ENTRANTS
- INDUSTRY RIVALRY
- GROWTH PROSPECT MAPPING
- GROWTH PROSPECT MAPPING FOR AUSTRALIA & NEW ZEALAND
- MARKET MATURITY ANALYSIS
- MARKET CONCENTRATION ANALYSIS
- VALUE CHAIN ANALYSIS
- EXPLORATION AND EXTRACTION
- LIQUEFACTION AND PROCESSING
- STORAGE AND TRANSPORTATION
- EXPORT AND DISTRIBUTION
- MARKETING AND SALES
- AFTER-SALES SERVICES
- KEY BUYING CRITERIA
- PRICE COMPETITIVENESS
- SUPPLY RELIABILITY
- QUALITY STANDARDS
- CONTRACT FLEXIBILITY
- FUTURE PROSPECTS OF LNG IN AUSTRALIA & NEW ZEALAND
- TRADE
- EXPORTS
- IMPORTS
- LNG TERMINALS
- LIST OF LNG EXPORT TERMINALS
- REGULATORY FRAMEWORK AND COMPLIANCE BODIES
- KEY MARKET TRENDS
LIQUEFIED NATURAL GAS (LNG) MARKET BY LNG INFRASTRUCTURE
- LNG LIQUEFACTION PLANTS
- MARKET FORECAST FIGURE
- SEGMENT ANALYSIS
- LNG REGASIFICATION FACILITIES
- MARKET FORECAST FIGURE
- SEGMENT ANALYSIS
- LNG LIQUEFACTION PLANTS
LIQUEFIED NATURAL GAS (LNG) MARKET BY APPLICATION
- TRANSPORTATION
- MARKET FORECAST FIGURE
- SEGMENT ANALYSIS
- INDUSTRIAL FEEDSTOCK
- MARKET FORECAST FIGURE
- SEGMENT ANALYSIS
- POWER GENERATION
- MARKET FORECAST FIGURE
- SEGMENT ANALYSIS
- OTHER APPLICATIONS
- MARKET FORECAST FIGURE
- SEGMENT ANALYSIS
- TRANSPORTATION
LIQUEFIED NATURAL GAS (LNG) MARKET BY MODE OF SUPPLY
- TRUCK
- MARKET FORECAST FIGURE
- SEGMENT ANALYSIS
- TRANSSHIPMENT AND BUNKERING
- MARKET FORECAST FIGURE
- SEGMENT ANALYSIS
- PIPELINE AND RAIL
- MARKET FORECAST FIGURE
- SEGMENT ANALYSIS
- TRUCK
COMPETITIVE LANDSCAPE
- KEY STRATEGIC DEVELOPMENTS
- MERGERS & ACQUISITIONS
- PRODUCT LAUNCHES & DEVELOPMENTS
- PARTNERSHIPS & AGREEMENTS
- BUSINESS EXPANSIONS & DIVESTITURES
- COMPANY PROFILES
- WOODSIDE ENERGY
- COMPANY OVERVIEW
- PRODUCT LIST
- STRENGTHS & CHALLENGES
- SANTOS
- COMPANY OVERVIEW
- PRODUCT LIST
- STRENGTHS & CHALLENGES
- CHEVRON AUSTRALIA
- COMPANY OVERVIEW
- PRODUCT LIST
- STRENGTHS & CHALLENGES
- CONOCOPHILLIPS
- COMPANY OVERVIEW
- PRODUCT LIST
- STRENGTHS & CHALLENGES
- ORIGIN ENERGY
- COMPANY OVERVIEW
- PRODUCT LIST
- STRENGTHS & CHALLENGES
- TODD ENERGY
- COMPANY OVERVIEW
- PRODUCT LIST
- STRENGTHS & CHALLENGES
- FIRSTGAS
- COMPANY OVERVIEW
- PRODUCT LIST
- STRENGTHS & CHALLENGES
- WOODSIDE ENERGY
- KEY STRATEGIC DEVELOPMENTS
LIST OF TABLES
TABLE 1: MARKET SNAPSHOT – LIQUEFIED NATURAL GAS (LNG)
TABLE 2: LIQUEFIED NATURAL GAS (LNG) MARKET REGULATORY FRAMEWORK
TABLE 3: AUSTRALIA & NEW ZEALAND NATURAL GAS PRODUCTION, 2022-2024 (IN EXAJOULES)
TABLE 4: AUSTRALIA & NEW ZEALAND NATURAL GAS CONSUMPTION, 2022-2024 (IN EXAJOULES)
TABLE 5: AUSTRALIA & NEW ZEALAND LNG EXPORTS, 2022-2024 (IN BILLION CUBIC METERS)
TABLE 6: AUSTRALIA & NEW ZEALAND LNG IMPORTS, 2022-2024 (IN BILLION CUBIC METERS)
TABLE 7: MARKET BY LNG INFRASTRUCTURE, HISTORICAL YEARS, 2022-2024 (IN $ MILLION)
TABLE 8: MARKET BY LNG INFRASTRUCTURE, FORECAST YEARS, 2026-2034 (IN $ MILLION)
TABLE 9: MARKET BY APPLICATION, HISTORICAL YEARS, 2022-2024 (IN $ MILLION)
TABLE 10: MARKET BY APPLICATION, FORECAST YEARS, 2026-2034 (IN $ MILLION)
TABLE 11: MARKET BY MODE OF SUPPLY, HISTORICAL YEARS, 2022-2024 (IN $ MILLION)
TABLE 12: MARKET BY MODE OF SUPPLY, FORECAST YEARS, 2026-2034 (IN $ MILLION)
TABLE 13: KEY PLAYERS OPERATING IN THE AUSTRALIA & NEW ZEALAND MARKET
TABLE 14: LIST OF MERGERS & ACQUISITIONS
TABLE 15: LIST OF PRODUCT LAUNCHES & DEVELOPMENTS
TABLE 16: LIST OF PARTNERSHIPS & AGREEMENTS
TABLE 17: LIST OF BUSINESS EXPANSIONS & DIVESTITURES
LIST OF FIGURES
FIGURE 1: KEY MARKET TRENDS
FIGURE 2: PORTER’S FIVE FORCES ANALYSIS
FIGURE 3: GROWTH PROSPECT MAPPING FOR AUSTRALIA & NEW ZEALAND
FIGURE 4: MARKET MATURITY ANALYSIS
FIGURE 5: MARKET CONCENTRATION ANALYSIS
FIGURE 6: VALUE CHAIN ANALYSIS
FIGURE 7: KEY BUYING CRITERIA
FIGURE 8: SEGMENT GROWTH POTENTIAL, BY LNG INFRASTRUCTURE, IN 2025
FIGURE 9: LNG LIQUEFACTION PLANTS MARKET SIZE, 2026-2034 (IN $ MILLION)
FIGURE 10: LNG REGASIFICATION FACILITIES MARKET SIZE, 2026-2034 (IN $ MILLION)
FIGURE 11: SEGMENT GROWTH POTENTIAL, BY APPLICATION, IN 2025
FIGURE 12: TRANSPORTATION MARKET SIZE, 2026-2034 (IN $ MILLION)
FIGURE 13: INDUSTRIAL FEEDSTOCK MARKET SIZE, 2026-2034 (IN $ MILLION)
FIGURE 14: POWER GENERATION MARKET SIZE, 2026-2034 (IN $ MILLION)
FIGURE 15: OTHER APPLICATIONS MARKET SIZE, 2026-2034 (IN $ MILLION)
FIGURE 16: SEGMENT GROWTH POTENTIAL, BY MODE OF SUPPLY, IN 2025
FIGURE 17: TRUCK MARKET SIZE, 2026-2034 (IN $ MILLION)
FIGURE 18: TRANSSHIPMENT AND BUNKERING MARKET SIZE, 2026-2034 (IN $ MILLION)
FIGURE 19: PIPELINE AND RAIL MARKET SIZE, 2026-2034 (IN $ MILLION)
FAQ’s
RELATED REPORTS
-

UNITED STATES AI-DRIVEN CLOUD MIGRATION SERVICES MARKET FORECAST 2026-2034
-

UNITED KINGDOM AI-DRIVEN CLOUD MIGRATION SERVICES MARKET FORECAST 2026-2034
-

UNITED ARAB EMIRATES AI-DRIVEN CLOUD MIGRATION SERVICES MARKET FORECAST 2026-2034
-

SOUTH KOREA AI-DRIVEN CLOUD MIGRATION SERVICES MARKET FORECAST 2026-2034
-

SINGAPORE AI-DRIVEN CLOUD MIGRATION SERVICES MARKET FORECAST 2026-2034
-

SAUDI ARABIA AI-DRIVEN CLOUD MIGRATION SERVICES MARKET FORECAST 2026-2034
-

AUSTRALIA AI-DRIVEN CLOUD MIGRATION SERVICES MARKET FORECAST 2026-2034
-

JAPAN AI-DRIVEN CLOUD MIGRATION SERVICES MARKET FORECAST 2026-2034
-

INDIA AI-DRIVEN CLOUD MIGRATION SERVICES MARKET FORECAST 2026-2034
-

CHINA AI-DRIVEN CLOUD MIGRATION SERVICES MARKET FORECAST 2026-2034