Beazil Food Delivery Platform Fee Structures Market by Delivery Mode (Platform-To-Consumer Delivery, Restaurant-To-Consumer Delivery), Market by Payment Method (Online Payment, Cash On Delivery (COD)), Market by Revenue Model (Commission-Based Revenue, Delivery Fee-Based Revenue, Advertising & Promotion Revenue, Subscription-Based Revenue), Market by Product Type (Meal Delivery, Grocery Delivery, Meal Kit Delivery, Alcohol Delivery, Other Product Types), by Geography
BRAZIL FOOD DELIVERY PLATFORM FEE STRUCTURES MARKET OVERVIEW
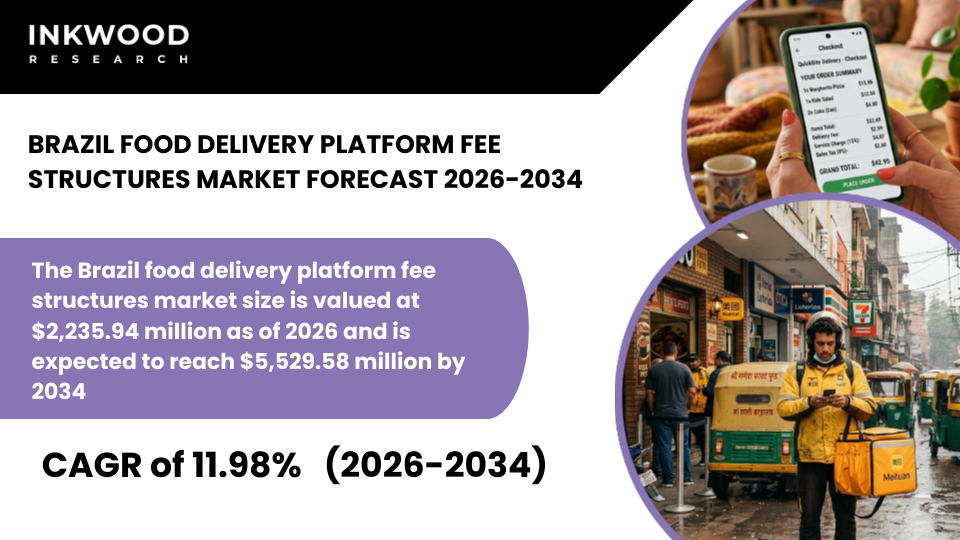
The Brazil food delivery platform fee structures market size is valued at $2,235.94 million as of 2026 and is expected to reach $5,529.58 million by 2034, progressing with a CAGR of 11.98% during the forecast years, 2026-2034.
MARKET INSIGHTS
Brazil is Latin America’s largest and most dynamic market for food delivery platform fee structures, anchored by a massive urban population, rapidly expanding smartphone penetration, and a digital payments ecosystem that has matured significantly over the past decade. The country’s online food delivery platform landscape is dominated by iFood, which holds an outsized share of the Brazilian market, alongside regional and international challengers such as Rappi and emerging local players.
Brazil’s digital commerce infrastructure has been meaningfully strengthened by the Banco Central do Brasil’s introduction of Pix, the country’s instant payment system, which has dramatically accelerated the shift from cash on delivery toward online payment across all digital commerce categories, including food delivery. This transition has had a direct positive impact on food delivery platform fee structure efficiency, reducing cash-handling costs for platforms and enabling more seamless commission settlement with restaurant partners.
Brazil’s regulatory environment is an increasingly active force in shaping how food delivery platforms design and price their services. The Secretaria Nacional do Consumidor (SENACON), under the Ministry of Justice and Public Security, has oversight responsibilities over digital marketplace practices, including how food delivery service charges are communicated to consumers and restaurant partners. Additionally, the Brazilian legislature has been actively debating gig worker classification reforms, with proposed legislation under review in the Câmara dos Deputados that could impose greater social security and employment benefit obligations on platforms using contract-based delivery workers.
If enacted, such reforms would increase operational costs for platforms, creating upward pressure on food delivery commission rates and delivery fee-based revenue components as platforms seek to protect margins. For operators planning their food delivery platform pricing strategies in Brazil, monitoring this evolving legislative landscape is not optional, but a strategic imperative.
Beyond regulatory considerations, Brazil presents compelling growth opportunities across the forecast period, particularly as platforms expand their food delivery platform business models into the country’s vast interior, where demand for online food ordering is growing rapidly, but platform penetration remains relatively low. The integration of grocery delivery, quick commerce, and alcohol delivery into existing food delivery platform fee structures is further diversifying revenue streams for leading platforms, reducing dependence on restaurant delivery commission income alone.
For investors, Brazil’s 11.98% CAGR and the structural underpinning provided by Pix adoption, urbanisation, and a young, mobile-first consumer base make it one of the highest-conviction growth markets in the global food delivery landscape. These factors, together, are set to boost the food delivery platform fee structures market growth in Brazil during the forecast period.
To Know More About This Report, Request a Free Sample Copy
SEGMENTATION ANALYSIS
The Brazil food delivery platform fee structures market is segmented by delivery mode, payment method, revenue model, and product type. The revenue model segment is further categorized into commission-based revenue, delivery fee-based revenue, advertising and promotion revenue, and subscription-based revenue.
Subscription-based revenue is an emerging but increasingly important sub-segment within the revenue model segment of the Brazil food delivery platform fee structures market. This reflects a broader global shift among online food delivery platforms toward recurring, predictable income streams that complement traditional per-order commission and delivery fee income.
In Brazil, iFood has been a key driver of this trend, offering consumers subscription membership plans that provide benefits such as reduced or waived delivery fees, exclusive promotional discounts, and priority customer support, in exchange for a fixed monthly fee. For food delivery platforms, subscription programmes serve a dual commercial purpose: they generate a reliable, non-commission revenue stream while simultaneously increasing consumer order frequency and platform loyalty, both of which indirectly support growth in overall food delivery commission revenues.
As Brazilian consumers become increasingly accustomed to subscription-based digital services across entertainment, e-commerce, and now food delivery, platforms that invest in building compelling membership propositions are well positioned to deepen engagement and reduce churn in a highly competitive marketplace. The subscription-based food delivery platform revenue model is therefore expected to grow in strategic importance within Brazil throughout the forecast period, complementing and diversifying the broader food delivery platform fee structure architecture.
COMPETITIVE INSIGHTS
Some of the top players operating in the Brazil food delivery platform fee structures market include iFood, Rappi Inc, 99Food, Aiqfome, etc.
iFood is Brazil’s dominant online food ordering platform and the clear market leader in Latin America’s largest food delivery marketplace, headquartered in Osasco, São Paulo. Operating across hundreds of Brazilian cities, iFood connects millions of consumers with restaurant partners and grocery retailers through a platform-to-consumer delivery model, charging restaurant delivery commissions and consumer-facing food delivery service charges as its primary revenue sources.
Beyond its core commission-based food delivery platform fee structure, iFood has expanded into in-app advertising products, subscription membership plans, and financial services for restaurant partners, building a diversified food delivery platform business model that extends well beyond order facilitation and positions the company as a comprehensive digital commerce partner for Brazil’s food service industry.
REPORT SYNOPSIS
| REPORT SCOPE | DETAILS |
|---|---|
| Market Forecast Years | 2026-2034 |
| Base Year | 2025 |
| Market Historical Years | 2022-2024 |
| Forecast Units | Revenue ($ Million) |
| Segments Analyzed | Delivery Mode, Payment Method, Revenue Model, Product Type |
| Country Analyzed | Brazil |
| Companies Analyzed | iFood, Rappi Inc, 99Food, Aiqfome, Delivery Much, Keeta, James Delivery |
TABLE OF CONTENTS
RESEARCH SCOPE & METHODOLOGY
- STUDY OBJECTIVES
- METHODOLOGY
- ASSUMPTIONS & LIMITATIONS
EXECUTIVE SUMMARY
- MARKET SIZE, SHARE & ESTIMATES
- MARKET OVERVIEW
- SCOPE OF STUDY
- MAJOR MARKET FINDINGS
- THE BRAZIL FOOD DELIVERY PLATFORM FEE STRUCTURES MARKET IS RAPIDLY EXPANDING DUE TO STRONG DEMAND FOR ONLINE FOOD ORDERING SERVICES
- PLATFORMS UTILIZE COMMISSION-BASED REVENUE MODELS ALONGSIDE DELIVERY FEES AND PROMOTIONAL ADVERTISING SERVICES
- DIGITAL PAYMENT SYSTEMS AND MOBILE APPLICATIONS ARE PLAYING A KEY ROLE IN PLATFORM GROWTH
- MAJOR DELIVERY PLATFORMS ARE EXPANDING THEIR SERVICE OFFERINGS TO INCLUDE GROCERY AND RETAIL DELIVERY
MARKET DYNAMICS
- KEY DRIVERS
- RISING URBANIZATION AND INCREASING SMARTPHONE PENETRATION ARE DRIVING THE ADOPTION OF FOOD DELIVERY APPS
- THE GROWTH OF DIGITAL PAYMENT INFRASTRUCTURE IS SUPPORTING ONLINE FOOD ORDERING AND PLATFORM TRANSACTIONS
- THE EXPANSION OF RESTAURANT PARTNERSHIPS AND LOCAL CUISINE OFFERINGS IS INCREASING PLATFORM ORDER VOLUMES
- PLATFORMS ARE INVESTING IN DELIVERY NETWORKS AND LOGISTICS INFRASTRUCTURE TO IMPROVE SERVICE COVERAGE
- KEY RESTRAINTS
- HIGH OPERATIONAL COSTS ASSOCIATED WITH LAST-MILE DELIVERY ARE IMPACTING PLATFORM PROFITABILITY
- PRICE SENSITIVITY AMONG CONSUMERS IS LIMITING THE ABILITY OF PLATFORMS TO INCREASE DELIVERY FEES
- COMPETITION BETWEEN MAJOR DELIVERY APPS IS LEADING TO HEAVY DISCOUNTING AND PROMOTIONAL CAMPAIGNS
- REGULATORY DISCUSSIONS AROUND GIG WORKER RIGHTS MAY INCREASE OPERATING COSTS FOR DELIVERY PLATFORMS
- KEY DRIVERS
STRATEGIC MARKET ANALYTICS
- GROWTH METRICS
- TAM, SAM & SOM OPPORTUNITY ANALYSIS
- EMERGING MARKET TRENDS & PARADIGM SHIFTS
- PLATFORMS ARE EXPANDING THEIR REVENUE STREAMS THROUGH IN-APP ADVERTISING AND RESTAURANT PROMOTIONAL SERVICES
- THE INTEGRATION OF QUICK COMMERCE AND GROCERY DELIVERY IS EXPANDING THE SCOPE OF DELIVERY PLATFORMS
- SUBSCRIPTION PROGRAMS OFFERING REDUCED DELIVERY FEES ARE GAINING POPULARITY AMONG FREQUENT USERS
- DATA ANALYTICS AND AI-DRIVEN DEMAND FORECASTING ARE BEING USED TO OPTIMIZE DELIVERY FEES AND COMMISSION STRUCTURES
- PORTER’S FIVE FORCES ANALYSIS
- BUYERS POWER
- SUPPLIERS POWER
- SUBSTITUTION
- NEW ENTRANTS
- INDUSTRY RIVALRY
- PESTLE ANALYSIS
- POLITICAL
- ECONOMIC
- SOCIAL LANDSCAPE
- TECHNOLOGY
- LEGAL
- ENVIRONMENTAL
- GROWTH OPPORTUNITY MAPPING & HEATMAP
- GROWTH PROSPECT MAPPING FOR BRAZIL
- MARKET MATURITY & LIFECYCLE ANALYSIS
- MARKET CONCENTRATION ANALYSIS
- GROWTH METRICS
FOOD DELIVERY PLATFORM FEE STRUCTURES VALUE CHAIN & DECISION FRAMEWORK
- VALUE CHAIN ANALYSIS
- MERCHANT ONBOARDING & FEE CONTRACTING
- PLATFORM TECHNOLOGY & FEE ENGINE
- FEE STRUCTURE DESIGN & MONETIZATION
- LOGISTICS & DELIVERY COST MANAGEMENT
- MARKETING, VISIBILITY & DEMAND GENERATION
- SETTLEMENT, ANALYTICS & REGULATORY COMPLIANCE
- KEY BUYING CRITERIA
- COMMISSION LEVELS & FEE TRANSPARENCY
- IMPACT ON MERCHANT PROFITABILITY
- FLEXIBILITY OF FEE MODELS
- DEMAND REACH & ORDER POTENTIAL
- PROMOTION EFFECTIVENESS & VISIBILITY ROI
- SETTLEMENT RELIABILITY & PLATFORM CREDIBILITY
- PRICING MODELS, FEE STRUCTURES & TAKE RATE OPTIMIZATION STRATEGIES
- REGULATORY & POLICY LANDSCAPE ANALYSIS
- VALUE CHAIN ANALYSIS
FOOD DELIVERY PLATFORM FEE STRUCTURES MARKET BY DELIVERY MODE
- PLATFORM-TO-CONSUMER DELIVERY
- MARKET SIZE, FORECAST & SHARE (2022–2034)
- RESTAURANT-TO-CONSUMER DELIVERY
- MARKET SIZE, FORECAST & SHARE (2022–2034)
- PLATFORM-TO-CONSUMER DELIVERY
FOOD DELIVERY PLATFORM FEE STRUCTURES MARKET BY PAYMENT METHOD
- ONLINE PAYMENT
- MARKET SIZE, FORECAST & SHARE (2022–2034)
- CASH ON DELIVERY (COD)
- MARKET SIZE, FORECAST & SHARE (2022–2034)
- ONLINE PAYMENT
FOOD DELIVERY PLATFORM FEE STRUCTURES MARKET BY REVENUE MODEL
- COMMISSION-BASED REVENUE
- MARKET SIZE, FORECAST & SHARE (2022–2034)
- DELIVERY FEE-BASED REVENUE
- MARKET SIZE, FORECAST & SHARE (2022–2034)
- ADVERTISING & PROMOTION REVENUE
- MARKET SIZE, FORECAST & SHARE (2022–2034)
- SUBSCRIPTION-BASED REVENUE
- MARKET SIZE, FORECAST & SHARE (2022–2034)
- COMMISSION-BASED REVENUE
FOOD DELIVERY PLATFORM FEE STRUCTURES MARKET BY PRODUCT TYPE
- MEAL DELIVERY
- MARKET SIZE, FORECAST & SHARE (2022–2034)
- GROCERY DELIVERY
- MARKET SIZE, FORECAST & SHARE (2022–2034)
- MEAL KIT DELIVERY
- MARKET SIZE, FORECAST & SHARE (2022–2034)
- ALCOHOL DELIVERY
- MARKET SIZE, FORECAST & SHARE (2022–2034)
- OTHER PRODUCT TYPES
- MARKET SIZE, FORECAST & SHARE (2022–2034)
- MEAL DELIVERY
COMPETITIVE LANDSCAPE
- KEY STRATEGIC DEVELOPMENTS
- MERGERS & ACQUISITIONS
- PRODUCT LAUNCHES & DEVELOPMENTS
- PARTNERSHIPS & AGREEMENTS
- BUSINESS EXPANSIONS & DIVESTITURES
- COMPETITOR POSITIONING & DIFFERENTIATION MAP
- COMPANY PROFILES
- IFOOD
- COMPANY OVERVIEW
- PRODUCT LIST
- STRENGTHS & CHALLENGES
- RAPPI INC
- COMPANY OVERVIEW
- PRODUCT LIST
- STRENGTHS & CHALLENGES
- 99FOOD
- COMPANY OVERVIEW
- PRODUCT LIST
- STRENGTHS & CHALLENGES
- AIQFOME
- COMPANY OVERVIEW
- PRODUCT LIST
- STRENGTHS & CHALLENGES
- DELIVERY MUCH
- COMPANY OVERVIEW
- PRODUCT LIST
- STRENGTHS & CHALLENGES
- KEETA
- COMPANY OVERVIEW
- PRODUCT LIST
- STRENGTHS & CHALLENGES
- JAMES DELIVERY
- COMPANY OVERVIEW
- PRODUCT LIST
- STRENGTHS & CHALLENGES
- IFOOD
- KEY STRATEGIC DEVELOPMENTS
LIST OF TABLES
TABLE 1: MARKET SNAPSHOT – FOOD DELIVERY PLATFORM FEE STRUCTURES
TABLE 2: PRICING MODELS, FEE STRUCTURES & TAKE RATE OPTIMIZATION STRATEGIES
TABLE 3: REGULATORY & POLICY LANDSCAPE ANALYSIS
TABLE 4: MARKET BY DELIVERY MODE, HISTORICAL YEARS, 2022-2024 (IN $ MILLION)
TABLE 5: MARKET BY DELIVERY MODE, FORECAST YEARS, 2026-2034 (IN $ MILLION)
TABLE 6: MARKET BY PAYMENT METHOD, HISTORICAL YEARS, 2022-2024 (IN $ MILLION)
TABLE 7: MARKET BY PAYMENT METHOD, FORECAST YEARS, 2026-2034 (IN $ MILLION)
TABLE 8: MARKET BY REVENUE MODEL, HISTORICAL YEARS, 2022-2024 (IN $ MILLION)
TABLE 9: MARKET BY REVENUE MODEL, FORECAST YEARS, 2026-2034 (IN $ MILLION)
TABLE 10: MARKET BY PRODUCT TYPE, HISTORICAL YEARS, 2022-2024 (IN $ MILLION)
TABLE 11: MARKET BY PRODUCT TYPE, FORECAST YEARS, 2026-2034 (IN $ MILLION)
TABLE 12: KEY PLAYERS OPERATING IN THE BRAZILIAN MARKET
TABLE 13: LIST OF MERGERS & ACQUISITIONS
TABLE 14: LIST OF PRODUCT LAUNCHES & DEVELOPMENTS
TABLE 15: LIST OF PARTNERSHIPS & AGREEMENTS
TABLE 16: LIST OF BUSINESS EXPANSIONS & DIVESTITURES
LIST OF FIGURES
FIGURE 1: MAJOR MARKET FINDINGS
FIGURE 2: MARKET DYNAMICS
FIGURE 3: KEY MARKET TRENDS
FIGURE 4: PORTER’S FIVE FORCES ANALYSIS
FIGURE 5: GROWTH PROSPECT MAPPING FOR BRAZIL
FIGURE 6: MARKET MATURITY ANALYSIS
FIGURE 7: MARKET CONCENTRATION ANALYSIS
FIGURE 8: VALUE CHAIN ANALYSIS
FIGURE 9: KEY BUYING CRITERIA
FIGURE 10: SEGMENT GROWTH POTENTIAL, BY DELIVERY MODE, IN 2025
FIGURE 11: PLATFORM-TO-CONSUMER DELIVERY MARKET SIZE, 2026-2034 (IN $ MILLION)
FIGURE 12: RESTAURANT-TO-CONSUMER DELIVERY MARKET SIZE, 2026-2034 (IN $ MILLION)
FIGURE 13: SEGMENT GROWTH POTENTIAL, BY PAYMENT METHOD, IN 2025
FIGURE 14: ONLINE PAYMENT MARKET SIZE, 2026-2034 (IN $ MILLION)
FIGURE 15: CASH ON DELIVERY (COD) MARKET SIZE, 2026-2034 (IN $ MILLION)
FIGURE 16: SEGMENT GROWTH POTENTIAL, BY REVENUE MODEL, IN 2025
FIGURE 17: COMMISSION-BASED REVENUE MARKET SIZE, 2026-2034 (IN $ MILLION)
FIGURE 18: DELIVERY FEE-BASED REVENUE MARKET SIZE, 2026-2034 (IN $ MILLION)
FIGURE 19: ADVERTISING & PROMOTION REVENUE MARKET SIZE, 2026-2034 (IN $ MILLION)
FIGURE 20: SUBSCRIPTION-BASED REVENUE MARKET SIZE, 2026-2034 (IN $ MILLION)
FIGURE 21: SEGMENT GROWTH POTENTIAL, BY PRODUCT TYPE, IN 2025
FIGURE 22: MEAL DELIVERY MARKET SIZE, 2026-2034 (IN $ MILLION)
FIGURE 23: GROCERY DELIVERY MARKET SIZE, 2026-2034 (IN $ MILLION)
FIGURE 24: MEAL KIT DELIVERY MARKET SIZE, 2026-2034 (IN $ MILLION)
FIGURE 25: ALCOHOL DELIVERY MARKET SIZE, 2026-2034 (IN $ MILLION)
FIGURE 26: OTHER PRODUCT TYPES MARKET SIZE, 2026-2034 (IN $ MILLION)
FAQ’s
RELATED REPORTS
-

LATIN AMERICA FACIAL RECOGNITION MARKET FORECAST 2019-2028
-

UNITED STATES AI-DRIVEN CLOUD MIGRATION SERVICES MARKET FORECAST 2026-2034
-

UNITED KINGDOM AI-DRIVEN CLOUD MIGRATION SERVICES MARKET FORECAST 2026-2034
-

UNITED ARAB EMIRATES AI-DRIVEN CLOUD MIGRATION SERVICES MARKET FORECAST 2026-2034
-

SOUTH KOREA AI-DRIVEN CLOUD MIGRATION SERVICES MARKET FORECAST 2026-2034
-

SINGAPORE AI-DRIVEN CLOUD MIGRATION SERVICES MARKET FORECAST 2026-2034
-

SAUDI ARABIA AI-DRIVEN CLOUD MIGRATION SERVICES MARKET FORECAST 2026-2034
-

AUSTRALIA AI-DRIVEN CLOUD MIGRATION SERVICES MARKET FORECAST 2026-2034
-

JAPAN AI-DRIVEN CLOUD MIGRATION SERVICES MARKET FORECAST 2026-2034
-

INDIA AI-DRIVEN CLOUD MIGRATION SERVICES MARKET FORECAST 2026-2034