Australia Magnetic Resonance Imaging (MRI) Systems Market by Architecture (Closed MRI Systems, Open MRI Systems) Market by Field Type (High Field System, Low-Mid Field Systems, Ultra High Field Systems) Market by Application (Brain and Neurology MRI System, Spine and Musculoskeletal MRI System, Pelvic and Abdominal MRI System, Oncology MRI System, Vascular MRI System, Cardiology MRI System, Pediatric MRI System, Gastroenterology MRI System, Other Applications), and Geography
AUSTRALIA MAGNETIC RESONANCE IMAGING (MRI) SYSTEMS MARKET OVERVIEW
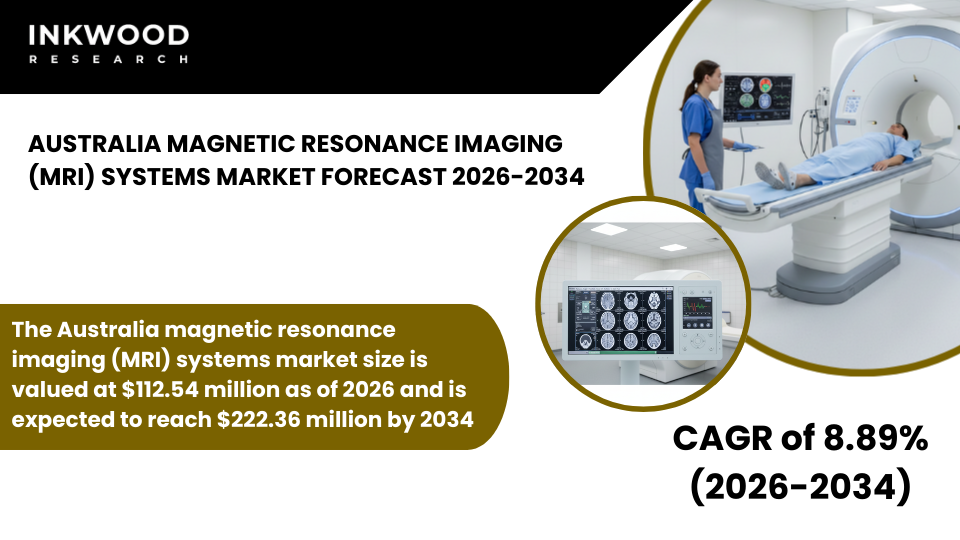
The Australia magnetic resonance imaging (MRI) systems market size is valued at $112.54 million as of 2026 and is expected to reach $222.36 million by 2034, progressing with a CAGR of 8.89% during the forecast years, 2026-2034.
Australia’s mature healthcare infrastructure, combined with comprehensive Medicare funding, establishes a stable foundation for sustained MRI systems market growth. The Therapeutic Goods Administration (TGA) regulates medical device safety and efficacy through the Australian Register of Therapeutic Goods (ARTG), ensuring high-quality standards for all magnetic resonance imaging equipment.
Government reimbursement policies play a pivotal role in driving MRI utilization across public and private healthcare facilities nationwide. Medicare-eligible MRI machines receive substantial rebates for approved clinical indications, making advanced imaging accessible to broader patient populations. Moreover, Australia’s aging demographic drives escalating demand for diagnostic imaging services, particularly neurological and oncological examinations.
Private diagnostic imaging chains expand aggressively throughout metropolitan and regional areas, installing state-of-the-art MRI systems to capture growing market opportunities. Furthermore, technology replacement cycles account for significant market activity as facilities upgrade aging equipment to maintain Medicare eligibility requirements.
The capital sensitivity provisions ensure practices regularly replace equipment reaching end-of-life thresholds. Additionally, workforce shortages of trained radiologists and MRI technologists create operational challenges despite strong equipment availability. Consequently, facilities increasingly adopt AI-powered workflow optimization tools to maximize scanning efficiency and throughput.
To Know More About This Report, Request a Free Sample Copy
Australia maintains a high MRI installation density concentrated primarily in major urban centers, including Sydney, Melbourne, Brisbane, and Perth. Public hospitals operated by state health departments provide comprehensive diagnostic imaging services supported by government funding allocations. Private hospital networks and independent diagnostic imaging centers complement public sector capacity through competitive service offerings. However, regional and rural communities face persistent access challenges due to equipment costs and workforce limitations.
Government initiatives aim to improve diagnostic imaging availability outside metropolitan areas through targeted infrastructure investments. Medicare licensing policies distinguish between fully-eligible and partially-eligible MRI machines, creating complex reimbursement frameworks. Fully-eligible machines receive Medicare rebates for comprehensive clinical indications, whereas partially-eligible machines cover limited service categories.
Moreover, general practitioners gained expanded MRI requesting rights for specific indications, including head, cervical spine, and knee examinations for patients aged 16 and over. This policy change increased primary care access while raising concerns about appropriate utilization management.
Furthermore, specialist referrals continue dominating high-value MRI procedures requiring Medicare reimbursement approval. The bulk-billing model, where providers accept Medicare rebates as full payment, eliminates out-of-pocket costs for eligible patients. Additionally, the TGA recognizes international certifications from the FDA and EU Notified Bodies, streamlining regulatory pathways for global manufacturers.
The Australia magnetic resonance imaging (MRI) systems market is segmented into architecture, field type, and application. The application segment is further categorized into brain and neurology MRI system, spine and musculoskeletal MRI system, pelvic and abdominal MRI system, oncology MRI system, vascular MRI system, cardiology MRI system, pediatric MRI system, gastroenterology MRI system, and other applications.
Spine and musculoskeletal MRI systems represent substantial market demand within Australia, driven by sports-related injuries and occupational health conditions. The country’s active outdoor lifestyle, combined with aging workforce demographics, creates persistent musculoskeletal imaging requirements. These specialized applications encompass spinal pathology assessment, joint derangements, ligament tears, and bone abnormalities across diverse patient populations.
Healthcare facilities prioritize musculoskeletal imaging capabilities when procuring MRI equipment, given high procedure volumes and Medicare reimbursement coverage. Moreover, sports medicine clinics and orthopedic practices rely heavily on detailed musculoskeletal imaging for surgical planning and conservative treatment guidance. Advanced sequences, including fat suppression techniques, cartilage-specific protocols, and dynamic imaging, enhance diagnostic accuracy for complex musculoskeletal conditions.
Furthermore, spine and musculoskeletal applications benefit from wide-bore MRI systems accommodating patients with mobility limitations or claustrophobia concerns. Private diagnostic imaging centers specialize in rapid musculoskeletal MRI services targeting workers’ compensation and insurance-funded examinations. Additionally, teleradiology networks connect regional facilities with metropolitan specialist radiologists for remote interpretation services. Consequently, spine and musculoskeletal MRI capabilities remain essential competitive differentiators for imaging providers throughout Australia.
Some of the top players operating in the Australia magnetic resonance imaging (MRI) systems market include Siemens Healthineers, GE Healthcare, Philips Healthcare, Canon Medical Systems Corp, etc.
Canon Medical Systems Corp operates as a prominent medical imaging technology manufacturer headquartered in Otawara, Japan, maintaining a significant presence throughout the Australian market. The company provides comprehensive MRI system portfolios ranging from compact 1.5T systems to advanced 3T platforms serving diverse clinical applications. Canon’s Vantage series features innovative technologies, including piano key technology for quiet scanning experiences and compressed sensing for accelerated image acquisition.
Their systems emphasize patient comfort through wide-bore designs, ambient lighting, and shortened examination protocols. Moreover, Canon maintains robust service networks across Australia, ensuring rapid technical support and preventive maintenance for installed equipment. The company’s Australian operations support public hospitals, private diagnostic centers, and research institutions requiring reliable imaging solutions. Canon participates actively in Australia’s healthcare technology conferences and professional radiology associations, strengthening relationships with clinical communities.
REPORT SYNOPSIS
| REPORT SCOPE | DETAILS |
|---|---|
| Market Forecast Years | 2026-2034 |
| Base Year | 2025 |
| Market Historical Years | 2022-2024 |
| Forecast Units | Revenue ($ Million) |
| Segments Analyzed | Architecture, Field Type, and Application |
| Country Analyzed | Australia |
| Companies Analyzed | Canon Medical Systems Corporation, FUJIFILM Holdings Corporation, GE HealthCare, Hologic, Inc., Mindray Medical International Limited, Philips Healthcare, Siemens Healthineers |
TABLE OF CONTENTS
RESEARCH SCOPE & METHODOLOGY
- STUDY OBJECTIVES
- METHODOLOGY
- ASSUMPTIONS & LIMITATIONS
EXECUTIVE SUMMARY
- MARKET SIZE & FORECAST
- MARKET OVERVIEW
- SCOPE OF STUDY
- CRISIS SCENARIO ANALYSIS
- MAJOR MARKET FINDINGS
- AUSTRALIA’S MRI SYSTEMS MARKET IS CHARACTERIZED BY HIGH INSTALLATION DENSITY IN PUBLIC AND PRIVATE HOSPITALS SUPPORTED BY A MATURE HEALTHCARE INFRASTRUCTURE
- GOVERNMENT REIMBURSEMENT POLICIES AND MEDICARE FUNDING PLAY A CRITICAL ROLE IN DRIVING MRI UTILIZATION ACROSS DIAGNOSTIC AND ACUTE CARE SETTINGS
- THE MARKET SHOWS STRONG DEMAND FOR HIGH-FIELD AND WIDE-BORE MRI SYSTEMS DUE TO RISING IMAGING VOLUMES AND PATIENT COMFORT REQUIREMENTS
- TECHNOLOGY UPGRADES AND REPLACEMENT DEMAND ACCOUNT FOR A SIGNIFICANT SHARE OF MRI SYSTEM SALES IN THE COUNTRY
MARKET DYNAMICS
- KEY DRIVERS
- INCREASING INCIDENCE OF CHRONIC DISEASES AND AGE-RELATED CONDITIONS IS DRIVING SUSTAINED DEMAND FOR ADVANCED DIAGNOSTIC IMAGING
- EXPANSION OF PRIVATE DIAGNOSTIC IMAGING CHAINS IS SUPPORTING NEW MRI INSTALLATIONS AND SYSTEM UPGRADES
- GOVERNMENT INVESTMENTS IN REGIONAL HEALTHCARE FACILITIES ARE IMPROVING ACCESS TO MRI SERVICES OUTSIDE MAJOR URBAN CENTERS
- GROWING PREFERENCE FOR NON-INVASIVE AND HIGH PRECISION DIAGNOSTICS IS FAVORING MRI OVER ALTERNATIVE IMAGING MODALITIES
- KEY RESTRAINTS
- STRICT REGULATORY APPROVALS AND LICENSING REQUIREMENTS LIMIT THE SPEED OF NEW MRI SYSTEM DEPLOYMENTS
- HIGH CAPITAL COSTS AND ONGOING MAINTENANCE EXPENSES CONSTRAIN PROCUREMENT BY SMALLER HEALTHCARE PROVIDERS
- WORKFORCE SHORTAGES OF TRAINED RADIOLOGISTS AND MRI TECHNOLOGISTS AFFECT OPERATIONAL UTILIZATION RATES
- REIMBURSEMENT CAPS AND BUDGET CONSTRAINTS CAN DELAY SYSTEM REPLACEMENT CYCLES
- KEY DRIVERS
KEY ANALYTICS
- KEY MARKET TRENDS
- INCREASING ADOPTION OF WIDE BORE AND PATIENT-FRIENDLY MRI SYSTEM DESIGNS IS IMPROVING SCAN COMPLIANCE
- INTEGRATION OF AI-BASED IMAGE RECONSTRUCTION TOOLS IS ENHANCING DIAGNOSTIC EFFICIENCY AND THROUGHPUT
- SHIFT TOWARD OUTPATIENT AND DAY CARE IMAGING CENTERS IS INFLUENCING MRI PROCUREMENT STRATEGIES
- GROWING FOCUS ON ENERGY-EFFICIENT AND LOW HELIUM MRI SYSTEMS IS SHAPING TECHNOLOGY PREFERENCES
- PORTER’S FIVE FORCES ANALYSIS
- BUYERS POWER
- SUPPLIERS POWER
- SUBSTITUTION
- NEW ENTRANTS
- INDUSTRY RIVALRY
- GROWTH PROSPECT MAPPING
- GROWTH PROSPECT MAPPING FOR AUSTRALIA
- MARKET MATURITY ANALYSIS
- MARKET CONCENTRATION ANALYSIS
- VALUE CHAIN ANALYSIS
- RAW MAGNETIC COIL MANUFACTURING
- MAGNET AND COMPONENT SUPPLY
- MRI SYSTEM ASSEMBLY
- SOFTWARE & AI INTEGRATION
- DISTRIBUTION & LOGISTICS
- INSTALLATION & VALIDATION
- TRAINING & MAINTENANCE SERVICES
- AFTERMARKET SUPPORT
- KEY BUYING CRITERIA
- IMAGE QUALITY & RESOLUTION
- TOTAL COST OF OWNERSHIP
- PATIENT COMFORT FEATURES
- SERVICE & TECHNICAL SUPPORT
- REGULATORY FRAMEWORK
- KEY MARKET TRENDS
MAGNETIC RESONANCE IMAGING (MRI) SYSTEMS MARKET BY ARCHITECTURE
- CLOSED MRI SYSTEMS
- STANDARD BORE MRI SYSTEMS
- WIDE BORE MRI SYSTEMS
- OPEN MRI SYSTEMS
- CLOSED MRI SYSTEMS
MAGNETIC RESONANCE IMAGING (MRI) SYSTEMS MARKET BY FIELD TYPE
- HIGH FIELD SYSTEMS
- 5T SYSTEM
- 3T SYSTEM
- LOW-MID FIELD SYSTEMS
- ULTRA HIGH FIELD SYSTEMS
- HIGH FIELD SYSTEMS
MAGNETIC RESONANCE IMAGING (MRI) SYSTEMS MARKET BY APPLICATION
- BRAIN AND NEUROLOGY MRI SYSTEM
- SPINE AND MUSCULOSKELETAL MRI SYSTEM
- PELVIC AND ABDOMINAL MRI SYSTEM
- ONCOLOGY MRI SYSTEM
- VASCULAR MRI SYSTEM
- CARDIOLOGY MRI SYSTEM
- PEDIATRIC MRI SYSTEM
- GASTROENTEROLOGY MRI SYSTEM
- OTHER APPLICATIONS
COMPETITIVE LANDSCAPE
- KEY STRATEGIC DEVELOPMENTS
- MERGERS & ACQUISITIONS
- PRODUCT LAUNCHES & DEVELOPMENTS
- PARTNERSHIPS & AGREEMENTS
- BUSINESS EXPANSIONS & DIVESTITURES
- COMPANY PROFILES
- CANON MEDICAL SYSTEMS CORP
- COMPANY OVERVIEW
- PRODUCTS
- STRENGTHS & CHALLENGES
- FUJIFILM HOLDINGS CORPORATION
- COMPANY OVERVIEW
- PRODUCTS
- STRENGTHS & CHALLENGES
- GE HEALTHCARE
- COMPANY OVERVIEW
- PRODUCTS
- STRENGTHS & CHALLENGES
- HOLOGIC INC
- COMPANY OVERVIEW
- PRODUCTS
- STRENGTHS & CHALLENGES
- MINDRAY MEDICAL INTERNATIONAL LIMITED
- COMPANY OVERVIEW
- PRODUCTS
- STRENGTHS & CHALLENGES
- PHILIPS HEALTHCARE
- COMPANY OVERVIEW
- PRODUCTS
- STRENGTHS & CHALLENGES
- SIEMENS HEALTHINEERS
- COMPANY OVERVIEW
- PRODUCTS
- STRENGTHS & CHALLENGES
- CANON MEDICAL SYSTEMS CORP
- KEY STRATEGIC DEVELOPMENTS
LIST OF TABLES
TABLE 1: MARKET SNAPSHOT – MAGNETIC RESONANCE IMAGING (MRI) SYSTEMS
TABLE 2: MARKET BY ARCHITECTURE, HISTORICAL YEARS, 2022-2024 (IN $ MILLION)
TABLE 3: MARKET BY ARCHITECTURE, FORECAST YEARS, 2026-2034 (IN $ MILLION)
TABLE 4: MARKET BY CLOSED MRI SYSTEMS, HISTORICAL YEARS, 2022-2024 (IN $ MILLION)
TABLE 5: MARKET BY CLOSED MRI SYSTEMS, FORECAST YEARS, 2026-2034 (IN $ MILLION)
TABLE 6: MARKET BY FIELD TYPE, HISTORICAL YEARS, 2022-2024 (IN $ MILLION)
TABLE 7: MARKET BY FIELD TYPE, FORECAST YEARS, 2026-2034 (IN $ MILLION)
TABLE 8: MARKET BY HIGH FIELD SYSTEMS, HISTORICAL YEARS, 2022-2024 (IN $ MILLION)
TABLE 9: MARKET BY HIGH FIELD SYSTEMS, FORECAST YEARS, 2026-2034 (IN $ MILLION)
TABLE 10: MARKET BY APPLICATION, HISTORICAL YEARS, 2022-2024 (IN $ MILLION)
TABLE 11: MARKET BY APPLICATION, FORECAST YEARS, 2026-2034 (IN $ MILLION)
TABLE 12: KEY PLAYERS OPERATING IN THE AUSTRALIAN MARKET
TABLE 13: LIST OF MERGERS & ACQUISITIONS
TABLE 14: LIST OF PRODUCT LAUNCHES & DEVELOPMENTS
TABLE 15: LIST OF PARTNERSHIPS & AGREEMENTS
TABLE 16: LIST OF BUSINESS EXPANSIONS & DIVESTITURES
LIST OF FIGURES
FIGURE 1: KEY MARKET TRENDS
FIGURE 2: PORTER’S FIVE FORCES ANALYSIS
FIGURE 3: GROWTH PROSPECT MAPPING FOR AUSTRALIA
FIGURE 4: MARKET MATURITY ANALYSIS
FIGURE 5: MARKET CONCENTRATION ANALYSIS
FIGURE 6: VALUE CHAIN ANALYSIS
FIGURE 7: KEY BUYING CRITERIA
FIGURE 8: SEGMENT GROWTH POTENTIAL, BY ARCHITECTURE, IN 2025
FIGURE 9: CLOSED MRI SYSTEMS MARKET SIZE, 2026-2034 (IN $ MILLION)
FIGURE 10: SEGMENT GROWTH POTENTIAL, BY CLOSED MRI SYSTEMS, IN 2025
FIGURE 11: STANDARD BORE MRI SYSTEMS MARKET SIZE, 2026-2034 (IN $ MILLION)
FIGURE 12: WIDE BORE MRI SYSTEMS MARKET SIZE, 2026-2034 (IN $ MILLION)
FIGURE 13: OPEN MRI SYSTEMS MARKET SIZE, 2026-2034 (IN $ MILLION)
FIGURE 14: SEGMENT GROWTH POTENTIAL, BY FIELD TYPE, IN 2025
FIGURE 15: HIGH FIELD SYSTEMS MARKET SIZE, 2026-2034 (IN $ MILLION)
FIGURE 16: SEGMENT GROWTH POTENTIAL, BY HIGH FIELD SYSTEMS, IN 2025
FIGURE 17: 1.5T SYSTEM MARKET SIZE, 2026-2034 (IN $ MILLION)
FIGURE 18: 3T SYSTEM MARKET SIZE, 2026-2034 (IN $ MILLION)
FIGURE 19: LOW-MID FIELD SYSTEMS MARKET SIZE, 2026-2034 (IN $ MILLION)
FIGURE 20: ULTRA HIGH FIELD SYSTEMS MARKET SIZE, 2026-2034 (IN $ MILLION)
FIGURE 21: SEGMENT GROWTH POTENTIAL, BY APPLICATION, IN 2025
FIGURE 22: BRAIN AND NEUROLOGY MRI SYSTEM MARKET SIZE, 2026-2034 (IN $ MILLION)
FIGURE 23: SPINE AND MUSCULOSKELETAL MRI SYSTEM MARKET SIZE, 2026-2034 (IN $ MILLION)
FIGURE 24: VASCULAR MRI SYSTEM MARKET SIZE, 2026-2034 (IN $ MILLION)
FIGURE 25: PELVIC AND ABDOMINAL MRI SYSTEM MARKET SIZE, 2026-2034 (IN $ MILLION)
FIGURE 26: ONCOLOGY MRI SYSTEM MARKET SIZE, 2026-2034 (IN $ MILLION)
FIGURE 27: CARDIOLOGY MRI SYSTEM MARKET SIZE, 2026-2034 (IN $ MILLION)
FIGURE 28: PEDIATRIC MRI SYSTEM MARKET SIZE, 2026-2034 (IN $ MILLION)
FIGURE 29: GASTROENTEROLOGY MRI SYSTEM MARKET SIZE, 2026-2034 (IN $ MILLION)
FIGURE 30: OTHER APPLICATIONS MARKET SIZE, 2026-2034 (IN $ MILLION)
FAQ’s
RELATED REPORTS
-
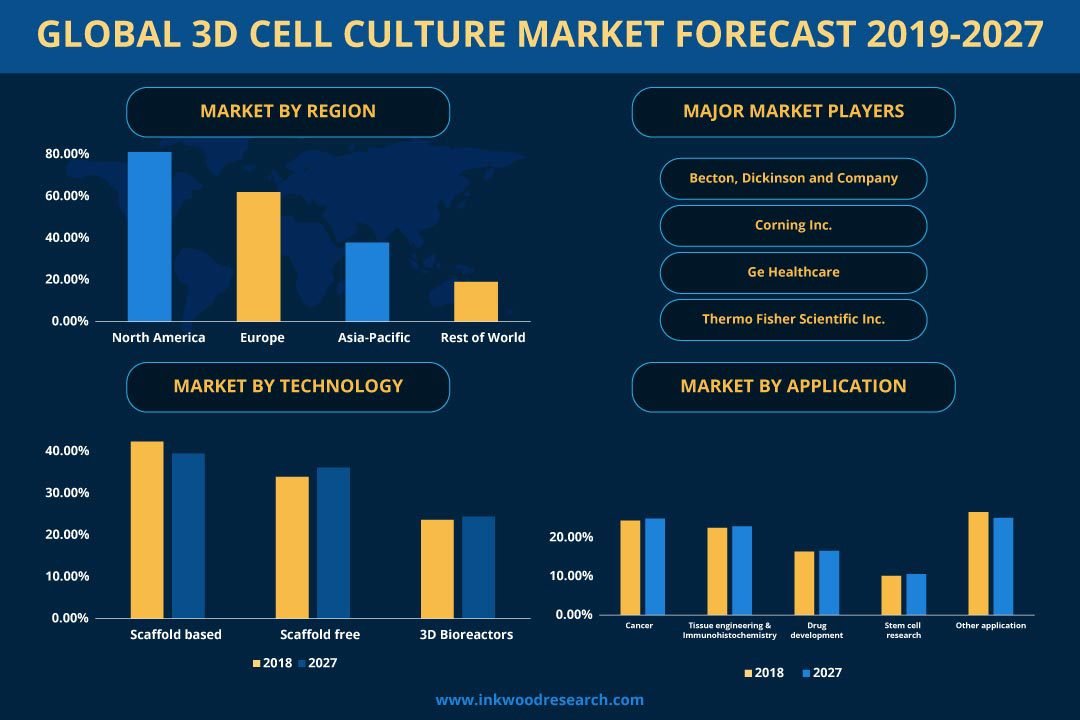
GLOBAL 3D CELL CULTURE MARKET FORECAST 2026
-
NORTH AMERICA 3D CELL CULTURE MARKET FORECAST 2026
-
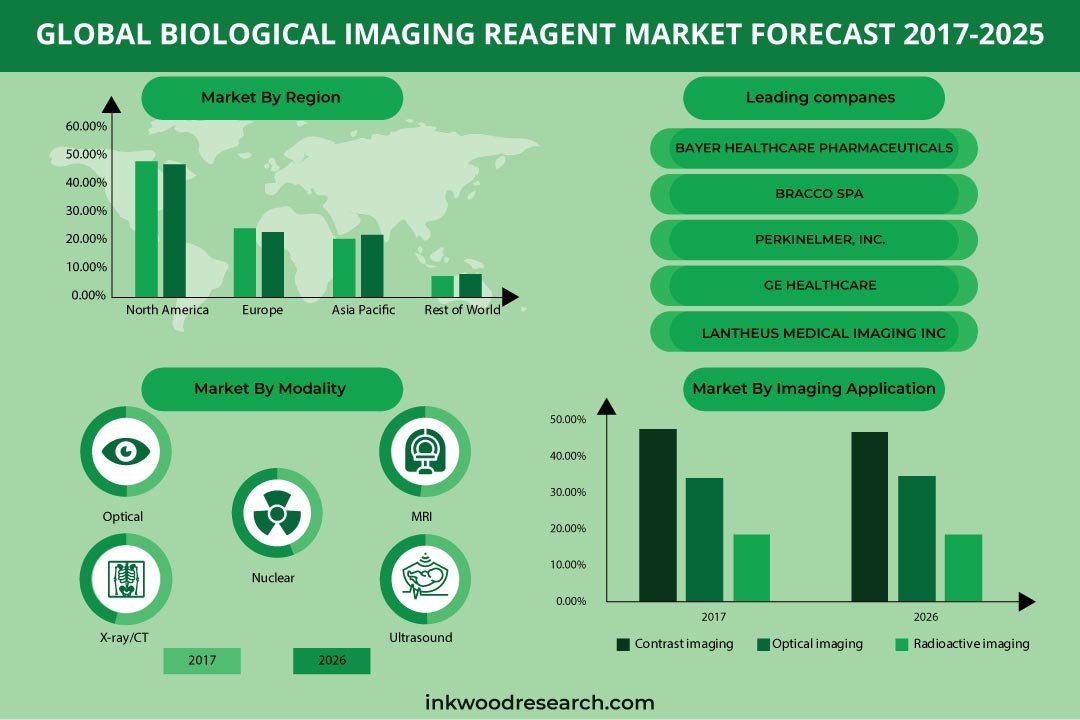
GLOBAL BIOLOGICAL IMAGING REAGENT MARKET FORECAST 2026
-

UNITED STATES AI-DRIVEN CLOUD MIGRATION SERVICES MARKET FORECAST 2026-2034
-

UNITED KINGDOM AI-DRIVEN CLOUD MIGRATION SERVICES MARKET FORECAST 2026-2034
-

UNITED ARAB EMIRATES AI-DRIVEN CLOUD MIGRATION SERVICES MARKET FORECAST 2026-2034
-

SOUTH KOREA AI-DRIVEN CLOUD MIGRATION SERVICES MARKET FORECAST 2026-2034
-

SINGAPORE AI-DRIVEN CLOUD MIGRATION SERVICES MARKET FORECAST 2026-2034
-

SAUDI ARABIA AI-DRIVEN CLOUD MIGRATION SERVICES MARKET FORECAST 2026-2034
-

AUSTRALIA AI-DRIVEN CLOUD MIGRATION SERVICES MARKET FORECAST 2026-2034