Exclusive special offer and discount title banner vector image

UNITED STATES X-RAY TUBE MARKET FORECAST 2024-2032

SCOPE OF THE REPORT

United States X-ray Tube Market by Type (Rotating Anode Tube, Stationary X-ray Tube) Market by End-user (Manufacturing, Healthcare, Food, Aerospace & Defense, Other End-users)


MARKET OVERVIEW

The United States X-ray tube market is expected to progress with a CAGR of 4.67% over the forecast period of 2024-2032. The market was valued at $932.54 million in 2023 and is expected to reach a revenue of $1408.61 million by 2032.

The United States is experiencing a growing geriatric population alongside an increase in chronic diseases driven by sedentary lifestyles and poor dietary choices. The expansion of medical facilities and advancements in infrastructure are expected to further enhance the market. For instance, the Hospital for Special Surgery in New York City has installed a fourth EOS system, which provides low-dose, full-body stereo-radiographic images. This technology allows the generation of both 2D and 3D orthopedic images to assist physicians in diagnosing and treating conditions related to the spine, hips, and knees. 

X-ray tubes are fundamental components in various medical systems, primarily for diagnostic examinations, including dental, angiography, and mammography systems. To expedite detection, major corporations are integrating X-ray technologies with artificial intelligence. For instance, GE has developed AI-powered X-ray devices that reduce the diagnosis time for pneumothorax from eight hours to just fifteen minutes by analyzing X-ray images with AI algorithms.

united-states-x-ray-tube-market-growth-inkwood-research

To Know More About This Report, Request a Free Sample Copy

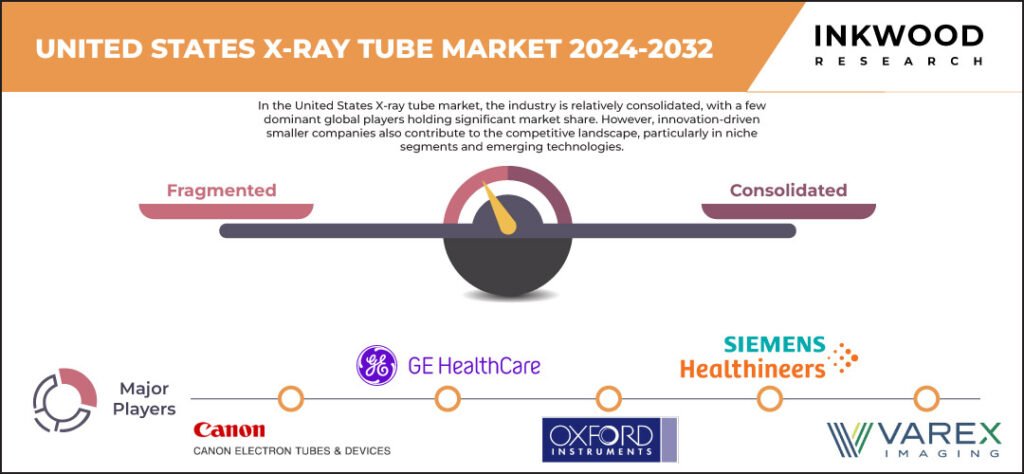
While the most advanced X-ray technology relies heavily on the performance of X-ray tubes, several top manufacturers like Siemens, GE, Canon, and Philips produce their tubes. Other companies, such as Varex, Chronos Imaging, and Dunlee, focus on supplying tubes to US manufacturers, as well as servicing the replacement and refurbished markets. Additionally, some firms like Ray-Pac specialize solely in replacement tubes without collaborating with original equipment manufacturers (OEMs).

The US market has encountered logistical challenges, too. The demand for X-ray tubes surged during the COVID-19 pandemic, leading to significant backlogs. In addition to completed tubes being scarce, the components required for their production have also become harder to obtain and more expensive, with some costs rising by 40–50%. In response to these challenges, companies are expanding their operations. In essence, X-Ray America announced plans in 2022 to establish a production plant in the US for manufacturing X-ray tubes to meet growing customer demands, while Italian company IAE will continue to supply OEMs from its manufacturing site in Italy.

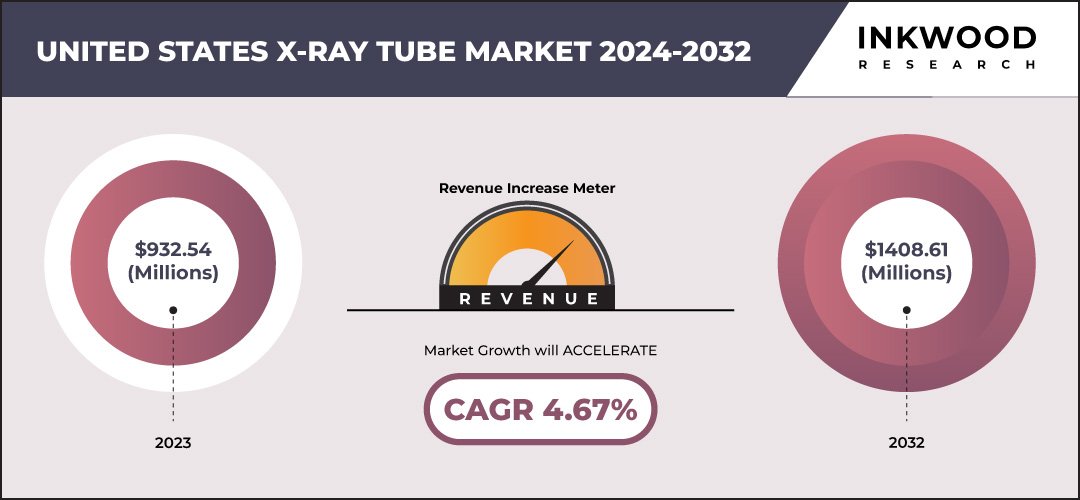
The United States X-ray Tube Market: 4.67% CAGR (2024-2032)

united-states-x-ray-tube-market-size-inkwood-research

Need a custom report or have specific data requirements? Let us know!

The United States X-ray tube market segmentation incorporates the market by type and end-user. The type segment is further differentiated into rotating anode tube and stationary X-ray tube. Rotating anode X-ray tubes are widely used in high-resolution imaging devices like mammography, angiography, and computed tomography (CT), supported by vacuum bearings that rotate the anode through electromagnetic induction. The anode, made from heat-resistant materials such as tungsten-rhenium on a molybdenum core with graphite, withstands the impact of electron beams, enhancing durability and efficiency. These tubes, often constructed with metal or ceramic instead of glass, enable higher currents for faster anode heating, which increases their durability and adoption in medical, industrial, and dental applications.

Technological advancements have further enhanced the performance of rotating anode X-ray tubes, integrating new anode materials, reduced target angles, and faster rotation speeds. This has spurred competition, leading companies like Canon to diversify their product offerings. Canon’s X-ray tubes serve various applications, including general X-ray imaging, mammography, and cardiovascular X-ray systems. They are equipped with advanced features like hydrodynamic bearings and high-capacity anodes for improved performance in CT scanners and mobile X-ray systems.

The simplest X-ray tube uses a stationary anode, where a tungsten insert is embedded in a copper block. The copper efficiently dissipates heat from the tungsten target, but the small target area limits heat dissipation, which in turn restricts the tube’s maximum current and X-ray output. Stationary anodes are generally used for short, low-dose procedures, as they cannot handle the high heat produced by longer or higher-intensity scans.

Stationary anode X-ray tubes are widely employed in compact and lower-cost systems, such as dental X-ray units, portable X-ray machines, and portable fluoroscopy devices. Since they don’t require a cooling system, they are more energy-efficient, making them ideal for such applications. To address heat management challenges, companies like Nanox have developed innovative solutions, including a 5D non-CNT MEMs-based digital cold cathode X-ray source with a stationary anode, which enhances performance while maintaining the cost-effectiveness of stationary anode technology.

Some of the leading players in the United States X-ray tube market are Canon Electron Tubes & Devices Co Ltd (Canon Inc), General Electric Healthcare, etc. 

GE Healthcare, a division of General Electric Company, is a global leader in medical devices. The company specializes in the design, development, manufacturing, and distribution of diagnostic imaging systems, clinical solutions, and products for drug discovery, biopharmaceutical manufacturing, and cellular technologies. Additionally, it offers imaging agents for medical scans and a range of healthcare IT solutions. 

GE Healthcare also delivers services aimed at performance improvement, as well as computerized data management and remote diagnostics and repair for medical equipment. Operating worldwide through subsidiaries and affiliates, GE Healthcare is headquartered in Chicago, Illinois, United States.

REPORT SYNOPSIS

REPORT SCOPEDETAILS
Market Forecast Years2024-2032
Base Year2023
Market Historical Years2018-2022
Forecast UnitsRevenue ($ Million)
Segments Analyzed
Type and End-user
Countries AnalyzedUnited States
Companies AnalyzedCanon Electron Tubes & Devices Co Ltd (Canon Inc), General Electric Healthcare, Siemens AG, Varex Imaging Corporation, YXLON International

TABLE OF CONTENTS

  1. RESEARCH SCOPE & METHODOLOGY
    1. STUDY OBJECTIVES
    2. METHODOLOGY
    3. ASSUMPTIONS & LIMITATIONS
  2. EXECUTIVE SUMMARY
    1. MARKET SIZE & ESTIMATES
    2. COUNTRY SNAPSHOT
    3. COUNTRY ANALYSIS 
    4. SCOPE OF STUDY 
    5. CRISIS SCENARIO ANALYSIS
    6. MAJOR MARKET FINDINGS
      1. AUTOMOTIVE MANUFACTURING IS A KEY SECTOR IN THE MARKET 
      2. GROWING DEMAND FOR MEDICAL IMAGING
  3. MARKET DYNAMICS
    1. KEY DRIVERS
      1. NEED FOR QUALITY CONTROL IN THE MANUFACTURING INDUSTRY
      2. INCREASED DEMAND FROM THE HEALTHCARE INDUSTRY
      3. GROWTH IN THE AEROSPACE & DEFENSE SECTOR
    2. KEY RESTRAINTS
      1. STRINGENT REGULATIONS
  4. KEY ANALYTICS
    1. KEY MARKET TRENDS
      1. INCREASING INTEREST IN MOBILE/WIRELESS X-RAY SYSTEMS
      2. EXPANDING PROSPECTS IN THE FOOD & BEVERAGE SECTOR
      3. ADVANCEMENTS IN TECHNOLOGY DRIVING MARKET EVOLUTION
    2. PESTLE ANALYSIS
      1. POLITICAL
      2. ECONOMICAL
      3. SOCIAL
      4. TECHNOLOGICAL
      5. LEGAL
      6. ENVIRONMENTAL 
    3. PORTER’S FIVE FORCES ANALYSIS
      1. BUYERS POWER
      2. SUPPLIERS POWER
      3. SUBSTITUTION
      4. NEW ENTRANTS
      5. INDUSTRY RIVALRY
    4. GROWTH PROSPECT MAPPING 
    5. MARKET MATURITY ANALYSIS
    6. MARKET CONCENTRATION ANALYSIS
    7. VALUE CHAIN ANALYSIS
      1. RAW MATERIAL & COMPONENT SUPPLIER
      2. DESIGN AND FABRICATION/ASSEMBLY
      3. OEMS 
      4. END-USER  
    8. KEY BUYING CRITERIA
      1. TUBE HOUSING
      2. VACUUM ENVELOPE
      3. FILAMENT ASSEMBLY
      4. ANODE
  5. MARKET BY TYPE
    1. ROTATING ANODE TUBE
      1. MARKET FORECAST FIGURE
      2. SEGMENT ANALYSIS
    2. STATIONARY X-RAY TUBE
      1. MARKET FORECAST FIGURE
      2. SEGMENT ANALYSIS
  6. MARKET BY END-USER
    1. MANUFACTURING
      1. MARKET FORECAST FIGURE
      2. SEGMENT ANALYSIS
    2. HEALTHCARE
      1. MARKET FORECAST FIGURE
      2. SEGMENT ANALYSIS
    3. FOOD
      1. MARKET FORECAST FIGURE
      2. SEGMENT ANALYSIS
    4. AEROSPACE & DEFENSE
      1. MARKET FORECAST FIGURE
      2. SEGMENT ANALYSIS
    5. OTHER END-USERS 
      1. MARKET FORECAST FIGURE
      2. SEGMENT ANALYSIS
  7. COMPETITIVE LANDSCAPE
    1. KEY STRATEGIC DEVELOPMENTS
      1. MERGERS & ACQUISITIONS
      2. PARTNERSHIPS & AGREEMENTS
      3. BUSINESS EXPANSIONS & DIVESTITURES
    2. COMPANY PROFILES
      1. CANON ELECTRON TUBES & DEVICES CO LTD
        1. COMPANY OVERVIEW
        2. PRODUCTS 
        3. STRENGTHS & CHALLENGES
      2. GENERAL ELECTRIC HEALTHCARE
        1. COMPANY OVERVIEW
        2. PRODUCTS 
        3. STRENGTHS & CHALLENGES
      3. SIEMENS AG
        1. COMPANY OVERVIEW
        2. PRODUCTS 
        3. STRENGTHS & CHALLENGES
      4. VAREX IMAGING CORPORATION
        1. COMPANY OVERVIEW
        2. PRODUCTS 
        3. STRENGTHS & CHALLENGES
      5. YXLON INTERNATIONAL
        1. COMPANY OVERVIEW
        2. PRODUCTS 
        3. STRENGTHS & CHALLENGES

LIST OF TABLES

TABLE 1: MARKET SNAPSHOT – X-RAY TUBE

TABLE 2: UNITED STATES X-RAY TUBE MARKET, BY TYPE, HISTORICAL YEARS, 2018-2022 (IN $ MILLION)

TABLE 3: UNITED STATES X-RAY TUBE MARKET, BY TYPE, FORECAST YEARS, 2024-2032 (IN $ MILLION)

TABLE 4: UNITED STATES X-RAY TUBE MARKET, BY END-USER, HISTORICAL YEARS, 2018-2022 (IN $ MILLION)

TABLE 5: UNITED STATES X-RAY TUBE MARKET, BY END-USER, FORECAST YEARS, 2024-2032 (IN $ MILLION)

TABLE 6: LIST OF MERGERS & ACQUISITIONS

TABLE 7: LIST OF PARTNERSHIPS & AGREEMENTS

TABLE 8: LIST OF BUSINESS EXPANSIONS & DIVESTITURES

LIST OF FIGURES

FIGURE 1: KEY MARKET TRENDS

FIGURE 2: PORTER’S FIVE FORCES ANALYSIS

FIGURE 3: GROWTH PROSPECT MAPPING FOR UNITED STATES

FIGURE 4: MARKET MATURITY ANALYSIS

FIGURE 5: MARKET CONCENTRATION ANALYSIS

FIGURE 6: VALUE CHAIN ANALYSIS

FIGURE 7: KEY BUYING CRITERIA

FIGURE 8: UNITED STATES X-RAY TUBE MARKET, GROWTH POTENTIAL, BY TYPE, IN 2023 

FIGURE 9: UNITED STATES X-RAY TUBE MARKET, BY ROTATING ANODE TUBE, 2024-2032 (IN $ MILLION) 

FIGURE 10: UNITED STATES X-RAY TUBE MARKET, BY STATIONARY X-RAY TUBE, 2024-2032 (IN $ MILLION)

FIGURE 11: UNITED STATES X-RAY TUBE MARKET, GROWTH POTENTIAL, BY END-USER, IN 2023

FIGURE 12: UNITED STATES X-RAY TUBE MARKET, BY MANUFACTURING, 2024-2032 (IN $ MILLION) 

FIGURE 13: UNITED STATES X-RAY TUBE MARKET, BY HEALTHCARE, 2024-2032 (IN $ MILLION) 

FIGURE 14: UNITED STATES X-RAY TUBE MARKET, BY FOOD, 2024-2032 (IN $ MILLION) 

FIGURE 15: UNITED STATES X-RAY TUBE MARKET, BY AEROSPACE & DEFENSE, 2024-2032 (IN $ MILLION) 

FIGURE 16: UNITED STATES X-RAY TUBE MARKET, BY OTHER END-USERS, 2024-2032 (IN $ MILLION)

FAQ’s