Exclusive special offer and discount title banner vector image

UNITED STATES SPORT UTILITY VEHICLE (SUV) MARKET FORECAST 2024-2032

SCOPE OF THE REPORT

United States Sport Utility Vehicle (SUV) Market by Drivetrain Type (Two-wheel Drive, Four-wheel Drive, All-wheel Drive) Market by SUV Size (Subcompact SUV, Compact SUV, Mid-size SUV, Full-size SUV) Market by Price Range (Luxury, Mid-range, Budget) Market by Seating Capacity (5-seater, 7-seater, 8-seater & Above) Market by Fuel Type (Gasoline, Diesel, Hybrid, Electric)


MARKET OVERVIEW

The United States sport utility vehicle (SUV) market is forecasted to grow with a CAGR of 5.81% over the projection period of 2024-2032. The market was valued at $169.10 billion in 2023 and is expected to reach a revenue of $280.55 billion by 2032.ย 

The United States SUV market has experienced substantial growth in recent years, driven by a strong consumer preference for these vehicles. According to the United States Environmental Protection Agency, 60% of US consumers favor SUVs due to their perceived safety, ample cargo capacity, and off-road capabilities. This preference has contributed to a steady rise in SUV sales, which now represent nearly half of all new vehicle sales in the country. The widespread appeal of SUVs is largely due to their versatility, making them well-suited for a variety of activities and driving conditions.

Technological advancements and environmental considerations have also played a significant role in shaping the SUV market. Between 2017 and 2022, leading manufacturers like Toyota and Kia achieved notable reductions in CO2 emissions for their SUV models, with decreases of 32 grams per mile and 21 grams per mile, respectively, as reported by the Environmental Protection Agency. Additionally, the average fuel economy for new SUVs improved to 24.1 miles per gallon in 2022. These developments reflect a broader trend towards making SUVs more environmentally friendly and fuel-efficient.

United States Sport Utility Vehicle (SUV) Market Size

To Know More About This Report, Request a Free Sample Copy

Furthermore, the United States SUV market is characterized by a diverse demographic of buyers. Data shows that the majority of new SUV purchasers are between the ages of 25 and 54, with a significant number constituting the 65 and older age group. Additionally, there is a marked preference for SUVs among male buyers, who make up 57% of the market. In terms of income, 40% of SUV buyers have a household income of $100,000 or more. These demographics underscore the broad appeal of SUVs across various age and income groups, further reinforcing their dominant position in the United States automotive market.

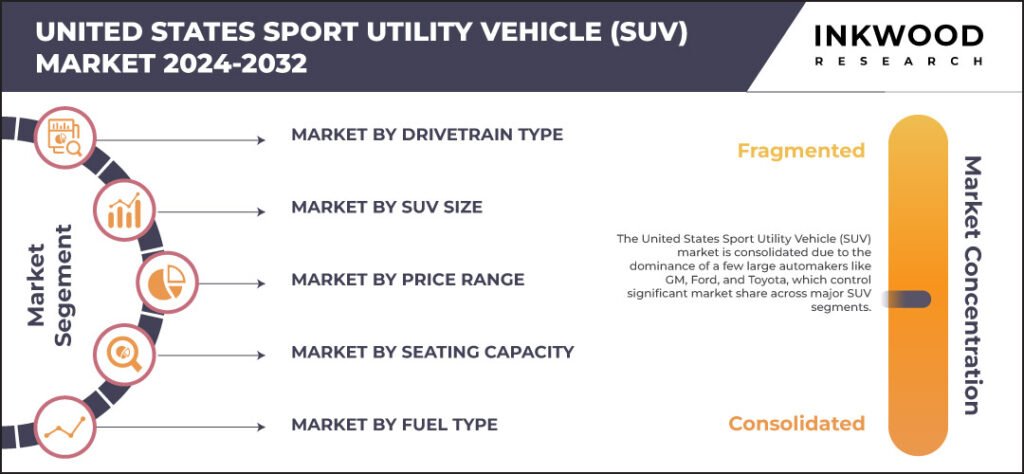
The United States sport utility vehicle (SUV) market segmentation includes drivetrain type, SUV size, price range, seating capacity, and fuel type. The price range segment is further classified into luxury, mid-range, and budget.

Luxury sport utility vehicles (SUVs) cater to affluent consumers who seek a blend of premium features, advanced technology, and superior performance. These vehicles combine the practicality and versatility of traditional SUVs with high-end materials, cutting-edge infotainment systems, and powerful powertrains, leading to a rapid expansion of this market segment in recent years. Premium automakers are continually introducing new models to satisfy the growing demand for upscale SUVs, which typically start at around USD 50,000 and can exceed USD 200,000 for ultra-luxury variants.

United States Sport Utility Vehicle (SUV) Market: 5.81% CAGR (2024-2032)

United States Sport Utility Vehicle (SUV) Market Growth

Need a custom report or have specific data requirements? Let us know!

A standout in this category is the Mercedes-Benz GLE-Class, with prices ranging from approximately $56,150 to $117,850. The GLE offers a selection of powerful engines, including hybrid options, and is equipped with advanced driver assistance systems, such as the MBUX infotainment system, which features artificial intelligence capabilities. Another strong competitor in the luxury SUV market is the BMW X5, priced between $61,600 and $108,900. The X5 is known for its sophisticated design, exceptional driving dynamics, and luxurious interior. It also offers a range of powertrains, including a plug-in hybrid option, appealing to environmentally conscious consumers seeking luxury.

Major companies in the United States sport utility vehicle (SUV) market include Ford Motor Company, Audi AG, BMW AG, Mercedes-Benz Group AG, etc.

Ford Motor Co (Ford), headquartered in the United States, is a global automotive company involved in the design, manufacturing, marketing, and servicing of a wide range of vehicles, including cars, trucks, sport utility vehicles, and electrified vehicles. In addition to its core automotive operations, Ford provides vehicle-related financing and leasing services, with its products marketed under the Ford and Lincoln brand names. The companyโ€™s extensive customer base spans multiple regions, including South America, the Middle East, Europe, North America, Africa, and the Asia Pacific.

Ford operates a variety of facilities around the world, including transmission plants, assembly plants, casting plants, metal stamping plants, engine plants, and other component manufacturing facilities. The company also maintains assembly facilities, manufacturing plants, parts distribution centers, and engineering centers globally.

REPORT SYNOPSIS

REPORT SCOPEDETAILS
Market Forecast Years2024-2032
Base Year2023
Market Historical Years2018-2022
Forecast Units

Revenue ($ Billion)

Segments Analyzed
Drivetrain Type, SUV Size, Price Range, Seating Capacity, and Fuel Type
Countries AnalyzedUnited States
Companies AnalyzedFord Motor Company, Audi AG, BMW AG, Mercedes-Benz Group AG, Toyota Motor Corporation, Volkswagen Group
TABLE OF CONTENTS
  1. RESEARCH SCOPE & METHODOLOGY
    1. STUDY OBJECTIVES
    2. METHODOLOGY
    3. ASSUMPTIONS & LIMITATIONS
  2. EXECUTIVE SUMMARY
    1. MARKET SIZE & ESTIMATES
    2. MARKET OVERVIEW
    3. SCOPE OF STUDY
    4. CRISIS SCENARIO ANALYSIS
      1. IMPACT OF COVID-19 ON THE SPORT UTILITY VEHICLE (SUV) MARKET
    5. MAJOR MARKET FINDINGS
      1. INCREASING ADOPTION OF ELECTRIC SUVS DRIVEN BY ENVIRONMENTAL CONCERNS AND INCENTIVES
      2. GROWING POPULARITY OF CROSSOVER SUVS
  3. MARKET DYNAMICS
    1. KEY DRIVERS
      1. GROWING PREFERENCE FOR SPACIOUS, VERSATILE VEHICLES
      2. ADVANCEMENTS IN SAFETY FEATURES
      3. INCREASING DEMAND FOR OFF-ROAD CAPABILITIES
    2. KEY RESTRAINTS
      1. HIGHER FUEL CONSUMPTION COMPARED TO SMALLER VEHICLES
      2. URBAN PARKING CHALLENGES
      3. HIGH INITIAL PURCHASE COST
  4. KEY ANALYTICS
    1. PARENT MARKET ANALYSIS
    2. KEY MARKET TRENDS
      1. INCREASING PREFERENCE FOR LUXURY SUVS
      2. RISE OF ELECTRIC AND HYBRID SUV MODELS
      3. EXPANSION OF SUV-COUPE MODELS
    3. PORTERโ€™S FIVE FORCES ANALYSIS
      1. BUYERS POWER
      2. SUPPLIERS POWER
      3. SUBSTITUTION
      4. NEW ENTRANTS
      5. INDUSTRY RIVALRY
    4. GROWTH PROSPECT MAPPING
      1. GROWTH PROSPECT MAPPING FOR UNITED STATES
    5. MARKET MATURITY ANALYSIS
    6. MARKET CONCENTRATION ANALYSIS
    7. VALUE CHAIN ANALYSIS
      1. RAW MATERIALS
      2. MANUFACTURERS
      3. DISTRIBUTORS
      4. END USER
    8. KEY BUYING CRITERIA
      1. COST
      2. PRODUCT FEATURES
      3. USABILITY
      4. AVAILABILITY
  5. MARKET BY DRIVETRAIN TYPE
    1. TWO-WHEEL DRIVE
      1. MARKET FORECAST FIGURE
      2. SEGMENT ANALYSIS
    2. FOUR-WHEEL DRIVE
      1. MARKET FORECAST FIGURE
      2. SEGMENT ANALYSIS
    3. ALL-WHEEL DRIVE
      1. MARKET FORECAST FIGURE
      2. SEGMENT ANALYSIS
  6. MARKET BY SUV SIZE
    1. SUBCOMPACT SUV
      1. MARKET FORECAST FIGURE
      2. SEGMENT ANALYSIS
    2. COMPACT SUV
      1. MARKET FORECAST FIGURE
      2. SEGMENT ANALYSIS
    3. MID-SIZE SUV
      1. MARKET FORECAST FIGURE
      2. SEGMENT ANALYSIS
    4. FULL-SIZE SUV
      1. MARKET FORECAST FIGURE
      2. SEGMENT ANALYSIS
  7. MARKET BY PRICE RANGE
    1. LUXURY
      1. MARKET FORECAST FIGURE
      2. SEGMENT ANALYSIS
    2. MID-RANGE
      1. MARKET FORECAST FIGURE
      2. SEGMENT ANALYSIS
    3. BUDGET
      1. MARKET FORECAST FIGURE
      2. SEGMENT ANALYSIS
  8. MARKET BY SEATING CAPACITY
    1. 5-SEATER
      1. MARKET FORECAST FIGURE
      2. SEGMENT ANALYSIS
    2. 7-SEATER
      1. MARKET FORECAST FIGURE
      2. SEGMENT ANALYSIS
    3. 8-SEATER & ABOVE
      1. MARKET FORECAST FIGURE
      2. SEGMENT ANALYSIS
  9. MARKET BY FUEL TYPE
    1. GASOLINE
      1. MARKET FORECAST FIGURE
      2. SEGMENT ANALYSIS
    2. DIESEL
      1. MARKET FORECAST FIGURE
      2. SEGMENT ANALYSIS
    3. HYBRID
      1. MARKET FORECAST FIGURE
      2. SEGMENT ANALYSIS
    4. ELECTRIC
      1. MARKET FORECAST FIGURE
      2. SEGMENT ANALYSIS
  10. COMPETITIVE LANDSCAPE
    1. KEY STRATEGIC DEVELOPMENTS
      1. MERGERS & ACQUISITIONS
      2. PRODUCT LAUNCHES & DEVELOPMENTS
      3. PARTNERSHIPS & AGREEMENTS
      4. BUSINESS EXPANSIONS & DIVESTITURES
    2. COMPANY PROFILES
      1. FORD MOTOR COMPANY
        1. COMPANY OVERVIEW
        2. PRODUCT LIST
        3. STRENGTHS & CHALLENGES
      2. AUDI AG
        1. COMPANY OVERVIEW
        2. PRODUCT LIST
        3. STRENGTHS & CHALLENGES
      3. BMW AG
        1. COMPANY OVERVIEW
        2. PRODUCT LIST
        3. STRENGTHS & CHALLENGES
      4. MERCEDES-BENZ GROUP AG
        1. COMPANY OVERVIEW
        2. PRODUCT LIST
        3. STRENGTHS & CHALLENGES
      5. TOYOTA MOTOR CORPORATION
        1. COMPANY OVERVIEW
        2. PRODUCT LIST
        3. STRENGTHS & CHALLENGES
      6. VOLKSWAGEN GROUP
        1. COMPANY OVERVIEW
        2. PRODUCT LIST
        3. STRENGTHS & CHALLENGES

LIST OF TABLES

TABLE 1: MARKET SNAPSHOT โ€“ UNITED STATES SPORT UTILITY VEHICLE (SUV)

TABLE 2: UNITED STATES SPORT UTILITY VEHICLE (SUV) MARKET, BY DRIVETRAIN TYPE, HISTORICAL YEARS, 2018-2022 (IN $ BILLION)

TABLE 3: UNITED STATES SPORT UTILITY VEHICLE (SUV) MARKET, BY DRIVETRAIN TYPE, FORECAST YEARS, 2024-2032 (IN $ BILLION)

TABLE 4: UNITED STATES SPORT UTILITY VEHICLE (SUV) MARKET, BY SUV SIZE, HISTORICAL YEARS, 2018-2022 (IN $ BILLION)

TABLE 5: UNITED STATES SPORT UTILITY VEHICLE (SUV) MARKET, BY SUV SIZE, FORECAST YEARS, 2024-2032 (IN $ BILLION)

TABLE 6: UNITED STATES SPORT UTILITY VEHICLE (SUV) MARKET, BY PRICE RANGE, HISTORICAL YEARS, 2018-2022 (IN $ BILLION)

TABLE 7: UNITED STATES SPORT UTILITY VEHICLE (SUV) MARKET, BY PRICE RANGE, FORECAST YEARS, 2024-2032 (IN $ BILLION)

TABLE 8: UNITED STATES SPORT UTILITY VEHICLE (SUV) MARKET, BY SEATING CAPACITY, HISTORICAL YEARS, 2018-2022 (IN $ BILLION)

TABLE 9: UNITED STATES SPORT UTILITY VEHICLE (SUV) MARKET, BY SEATING CAPACITY, FORECAST YEARS, 2024-2032 (IN $ BILLION)

TABLE 10: UNITED STATES SPORT UTILITY VEHICLE (SUV) MARKET, BY FUEL TYPE, HISTORICAL YEARS, 2018-2022 (IN $ BILLION)

TABLE 11: UNITED STATES SPORT UTILITY VEHICLE (SUV) MARKET, BY FUEL TYPE, FORECAST YEARS, 2024-2032 (IN $ BILLION)

TABLE 12: LIST OF MERGERS & ACQUISITIONS

TABLE 13: LIST OF PRODUCT LAUNCHES & DEVELOPMENTS

TABLE 14: LIST OF PARTNERSHIPS & AGREEMENTS

TABLE 15: LIST OF BUSINESS EXPANSIONS & DIVESTITURES

LIST OF FIGURES

FIGURE 1: KEY MARKET TRENDS

FIGURE 2: PORTERโ€™S FIVE FORCES ANALYSIS

FIGURE 3: GROWTH PROSPECT MAPPING FOR UNITED STATES

FIGURE 4: MARKET MATURITY ANALYSIS

FIGURE 5: MARKET CONCENTRATION ANALYSIS

FIGURE 6: VALUE CHAIN ANALYSIS

FIGURE 7: KEY BUYING CRITERIA

FIGURE 8: UNITED STATES SPORT UTILITY VEHICLE (SUV) MARKET, GROWTH POTENTIAL, BY DRIVETRAIN TYPE, IN 2023

FIGURE 9: UNITED STATES SPORT UTILITY VEHICLE (SUV) MARKET, BY TWO-WHEEL DRIVE, 2024-2032 (IN $ BILLION)

FIGURE 10: UNITED STATES SPORT UTILITY VEHICLE (SUV) MARKET, BY FOUR-WHEEL DRIVE, 2024-2032 (IN $ BILLION)

FIGURE 11: UNITED STATES SPORT UTILITY VEHICLE (SUV) MARKET, BY ALL-WHEEL DRIVE, 2024-2032 (IN $ BILLION)

FIGURE 12: UNITED STATES SPORT UTILITY VEHICLE (SUV) MARKET, GROWTH POTENTIAL, BY SUV SIZE, IN 2023

FIGURE 13: UNITED STATES SPORT UTILITY VEHICLE (SUV) MARKET, BY SUBCOMPACT SUV, 2024-2032 (IN $ BILLION)

FIGURE 14: UNITED STATES SPORT UTILITY VEHICLE (SUV) MARKET, BY COMPACT SUV, 2024-2032 (IN $ BILLION)

FIGURE 15: UNITED STATES SPORT UTILITY VEHICLE (SUV) MARKET, BY MID-SIZE SUV, 2024-2032 (IN $ BILLION)

FIGURE 16: UNITED STATES SPORT UTILITY VEHICLE (SUV) MARKET, BY FULL-SIZE SUV, 2024-2032 (IN $ BILLION)

FIGURE 17: UNITED STATES SPORT UTILITY VEHICLE (SUV) MARKET, GROWTH POTENTIAL, BY PRICE RANGE, IN 2023

FIGURE 18: UNITED STATES SPORT UTILITY VEHICLE (SUV) MARKET, BY LUXURY, 2024-2032 (IN $ BILLION)

FIGURE 19: UNITED STATES SPORT UTILITY VEHICLE (SUV) MARKET, BY MID-RANGE, 2024-2032 (IN $ BILLION)

FIGURE 20: UNITED STATES SPORT UTILITY VEHICLE (SUV) MARKET, BY BUDGET, 2024-2032 (IN $ BILLION)

FIGURE 21: UNITED STATES SPORT UTILITY VEHICLE (SUV) MARKET, GROWTH POTENTIAL, BY SEATING CAPACITY, IN 2023

FIGURE 22: UNITED STATES SPORT UTILITY VEHICLE (SUV) MARKET, BY 5-SEATER, 2024-2032 (IN $ BILLION)

FIGURE 23: UNITED STATES SPORT UTILITY VEHICLE (SUV) MARKET, BY 7-SEATER, 2024-2032 (IN $ BILLION)

FIGURE 24: UNITED STATES SPORT UTILITY VEHICLE (SUV) MARKET, BY 8-SEATER & ABOVE, 2024-2032 (IN $ BILLION)

FIGURE 25: UNITED STATES SPORT UTILITY VEHICLE (SUV) MARKET, GROWTH POTENTIAL, BY FUEL TYPE, IN 2023

FIGURE 26: UNITED STATES SPORT UTILITY VEHICLE (SUV) MARKET, BY GASOLINE, 2024-2032 (IN $ BILLION)

FIGURE 27: UNITED STATES SPORT UTILITY VEHICLE (SUV) MARKET, BY DIESEL, 2024-2032 (IN $ BILLION)

FIGURE 28: UNITED STATES SPORT UTILITY VEHICLE (SUV) MARKET, BY HYBRID, 2024-2032 (IN $ BILLION)

FIGURE 29: UNITED STATES SPORT UTILITY VEHICLE (SUV) MARKET, BY ELECTRIC, 2024-2032 (IN $ BILLION)

FAQ’s