
GLOBAL SYNGAS MARKET FORECAST 2018-2026
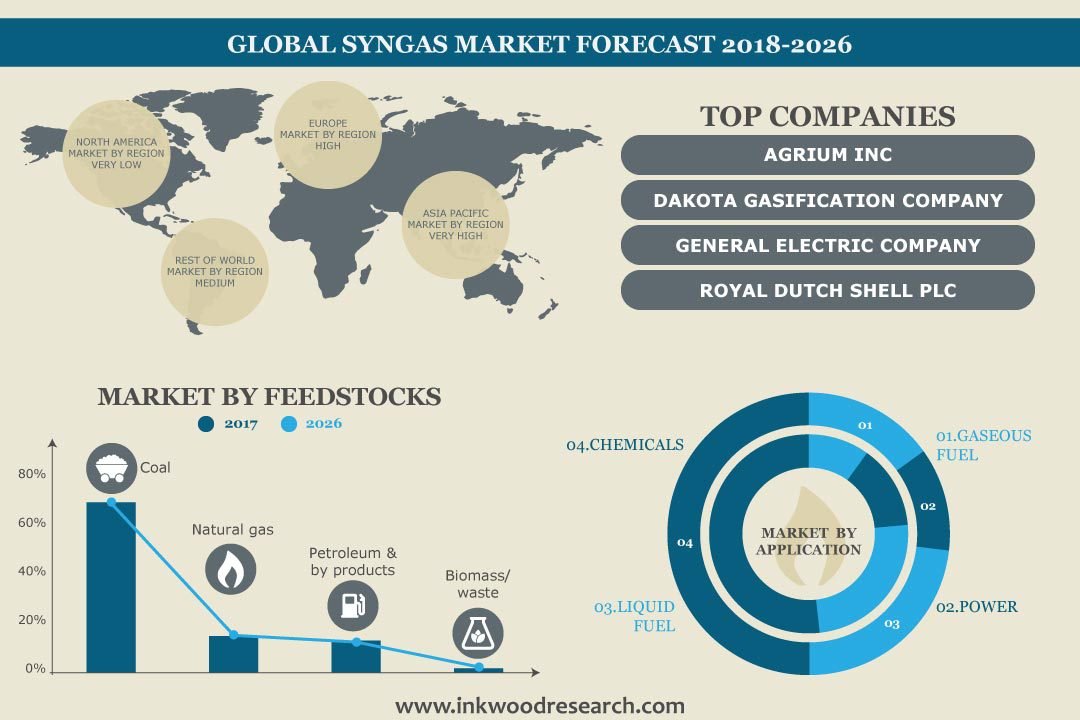
Global Syngas Market Is Segmented by Feedstock (Biomass/waste, Petroleum, and by-products, Natural Gas, Coal) Market by Application (Gaseous Fuel, Power, Liquid Fuel, Chemicals) by Geography
Syngas is a fuel gas mixture that consists of hydrogen and carbon dioxide. It is a versatile intermediate for the production of methanol, ammonia, and SNG. The composition of substances in syngas varies depending upon the chemical composition of the feedstock. Syngas can be produced from any hydrocarbon feedstock, by reaction with either steam or oxygen.
Global syngas market is anticipated to witness a CAGR of 9.54% over the forecast period. The base year considered for the market study is 2017 and the forecasted period is between 2018-2026. Several factors aiding to market growth are:
- Rising demand for electricity, fuel, and agricultural products
- Flexibility in feedstock
- Use of gasification techniques
- Conversion of underground coal gasification (UCG) offers ample opportunities
- Increasing research & development investments
To learn more about this report, request a free sample copy
The market is expected to grow significantly over the forecast period with high demand for industrial chemicals, fuels, agriculture products, and electricity worldwide. With growing electricity demand, the focus of power generation companies is shifting to multiple alternatives, syngas being one of them. In addition, growing environmental concerns and increasing government initiatives worldwide to increase the use of cleaner fuels are aiding market growth.
In 2017, Coal segment dominated the feedstock segment by accounting for the largest share of XX%. Coal, an abundantly available raw material, is needed for the production of syngas. Coal gasification is versatile and is the cleanest method to convert coal into hydrogen, electricity, and other valuable products. The environmental benefit offered by coal gasification is one of the primary drivers of this segment, as it has extremely low sulphur oxide and nitrogen oxide emission levels. Furthermore, Biomass & waste segment is anticipated to exhibit the fastest pace during the forecast period. The environment-friendly and carbon-neutral nature of biomass as feedstock will aid the market growth during the forecast period. It can also be used in combination with other feedstock such as coal and natural gas. The co-firing technique will provide fuel flexibility, and hence, boost market growth.
However, stringent emission regulations are the major factors hindering the Syngas market. The governments of several countries have set standards to reduce pollution. Moreover, apart from massive capital investments, other barriers to the growth of the syngas market include longer construction time, and annual maintenance and operating costs. The cost to construct and operate a gasification plant is significantly higher, and it deters investors. Apart from massive capital investments, other barriers to the growth of the syngas market include longer construction time, and annual maintenance and operating costs. The cost to construct and operate a gasification plant is significantly higher, and it deters investors.
The global syngas market report includes segmentation on the basis of feedstock and application.
Market by Feedstock:
- Biomass/waste
- Petroleum and by-products
- Natural gas
- Coal
Market by Applications:
- Gaseous fuel
- Power
- Liquid fuel
- Chemicals
The revenues generated through the sales of syngas for feedstock as well as the applications are considered in this analysis to calculate the market size by considering 2017 as the base year.
The report sizes all the submarkets and also gives a detailed geographic split of the four major markets, which include:
- Syngas North America Market: the United States & Canada
- Syngas Europe Market: United Kingdom, France, Germany, Spain, Italy, Nordic Countries, Netherland, Russia & Rest of Europe
- Syngas Asia-Pacific Market: China, India, Japan & Rest of Asia Pacific
- Rest of World: Latin America, Middle East & Africa
Geographically, Asia Pacific syngas market accounted for the largest share of global syngas market in 2017. The production of syngas in Asia Pacific region is anticipated to increase primarily due to rising number of upcoming and operating production plants in the region. Owing to economic sourcing and reduced manufacturing costs, vendors have achieved a low-cost advantage in this region. China, Mongolia, India, and South Korea are countries with an increased number of installations. China’s contribution to the market will be the focus point with many projects in the pipeline. By 2020, China targets to raise the syngas output to 50 bcm/y. India, Japan, Taiwan, and Singapore have also been increasing their syngas production. For instance, Reliance Jamnagar refinery in India is undertaking a project that will gasify petcoke to produce electricity, SNG, hydrogen, and chemicals. Also, the reduction in coal prices makes the market economically viable in the region.
The Syngas Market is primarily segmented based on the feedstock which is sub-divided into biomass/waste, petroleum, and by-products, natural gas, and coal. Furthermore, the market has been segmented on the basis of Applications, which includes Gaseous Fuel, Liquid Fuel, Chemicals & Power.
The global syngas market is highly diversified and has a large number of players. It consists of major syngas producers, production technology licensors, and producers of the syngas derivatives. The key players in the syngas production market are:
- Shell
- Sasol Limited
- General Electric Company
- Dakota Gasification Company
- Haldor Topsoe
Company profiles of prominent market players are discussed in detail in this report. Most of the companies look for strategies such as merger & acquisition, partnership, contracts, agreements, and new product launch in order to gain a competitive edge over each other. For instance, in May 2018, Air Products & Chemicals inaugurated its new world-scale industrial gas complex within the Integrated Refinery Expansion Project (IREP) of the BPCL Kochi Refinery located in Kochi, India. In January 2018, Nutrien Ltd. completed the merger of equals between Agrium Inc. (Agrium) and Potash Corporation of Saskatchewan Inc. (PotashCorp), to create the world’s premier provider of crop inputs and services.
Key findings of Global Syngas Market:
- The production of syngas in the Asia Pacific is anticipated to increase primarily due to the rising number of upcoming and operating production plants in the region
- The biomass feedstock segment is expected to grow significantly during the forecast period, posting a CAGR of 12.60%
- The flexibility in feedstock and rising demand for fuel and electricity have a positive impact on the growth of the syngas market
- The underground coal gasification process is a major trend that will drive the market growth
- RESEARCH SCOPE
- STUDY GOALS
- SCOPE OF THE MARKET STUDY
- WHO WILL FIND THIS REPORT USEFUL?
- STUDY AND FORECASTING YEARS
- RESEARCH METHODOLOGY
- SOURCES OF DATA
- SECONDARY DATA
- PRIMARY DATA
- TOP-DOWN APPROACH
- BOTTOM-UP APPROACH
- DATA TRIANGULATION
- SOURCES OF DATA
- EXECUTIVE SUMMARY
- MARKET SUMMARY
- KEY FINDINGS
- ASIA PACIFIC HOLDS THE LARGEST MARKET SHARE
- GASIFICATION TECHNOLOGY IS GAINING POPULARITY
- INCREASING RESEARCH & DEVELOPMENT INVESTMENTS
- MARKET DYNAMICS
- MARKET DEFINITION & SCOPE
- DRIVERS
- FLEXIBILITY IN FEEDSTOCK
- USE OF GASIFICATION TECHNIQUES
- RISING DEMAND FOR ELECTRICITY, FUEL, AND AGRICULTURAL PRODUCTS
- RESTRAINTS
- STRINGENT EMISSION REGULATIONS
- OPPORTUNITIES
- CONVERSION OF UNDERGROUND COAL GASIFICATION (UCG) OFFERS AMPLE OPPORTUNITIES
- HIGH RATE OF ADOPTION IN ASIA PACIFIC
- CHALLENGES
- HIGH CAPITAL INVESTMENT
- COMPLEXITY IN SYNGAS PRODUCTION PROCESS
- MARKET BY FEEDSTOCK
- BIOMASS/WASTE
- PETROLEUM & BY-PRODUCTS
- NATURAL GAS
- COAL
- MARKET BY APPLICATION
- GASEOUS FUEL
- POWER
- LIQUID FUEL
- CHEMICALS
- KEY ANALYTICS
- PORTER’S FIVE FORCES MODEL
- THREAT OF NEW ENTRANTS
- THREAT OF SUBSTITUTES
- BARGAINING POWER OF BUYERS
- BARGAINING POWER OF SUPPLIERS
- THREAT OF RIVALRY
- VENDOR LANDSCAPE
- OPPORTUNITY MATRIX
- VALUE CHAIN ANALYSIS
- PORTER’S FIVE FORCES MODEL
- GEOGRAPHICAL ANALYSIS
- NORTH AMERICA
- UNITED STATES
- CANADA
- EUROPE
- UNITED KINGDOM
- FRANCE
- GERMANY
- SPAIN
- ITALY
- NORDIC COUNTRIES
- NETHERLAND
- RUSSIA
- REST OF EUROPE
- ASIA-PACIFIC
- INDIA
- CHINA
- JAPAN
- REST OF ASIA PACIFIC
- REST OF WORLD
- LATIN AMERICA
- MIDDLE EAST & NORTH AFRICA
- REST OF AFRICA
- NORTH AMERICA
- COMPANY PROFILES
- AIR LIQUIDE SA
- AIR PRODUCTS & CHEMICALS
- DAKOTA GASIFICATION COMPANY
- GENERAL ELECTRIC COMPANY
- HALDOR TOPSOE A/S
- KBR INC.
- NUTRIEN (MERGER OF POTASHCORP AND AGRIUM)
- ROYAL DUTCH SHELL PLC
- SASOL LIMITED
- TECHNIP (MERGER WITH FMC: TECHNIPFMC)
- THE LINDE GROUP
- YARA INTERNATIONAL
TABLE LIST
TABLE 1: TYPICAL RANGE FOR COMPOSITION OF SYNGAS
TABLE 2: GLOBAL SYNGAS MARKET, BY GEOGRAPHY, 2018-2026 (MW)
TABLE 3: GLOBAL SYNGAS MARKET, BY FEEDSTOCK, 2018-2026 (MW)
TABLE 4: PETCOKE GASIFICATION PROJECTS
TABLE 5: GLOBAL SYNGAS MARKET, BY APPLICATION 2018-2026 (MW)
TABLE 6: VENDOR LANDSCAPE
TABLE 7: OPPORTUNITY MATRIX
TABLE 8: GLOBAL SYNGAS MARKET, BY GEOGRAPHY, 2018-2026 (MW)
TABLE 9: NORTH AMERICA SYNGAS MARKET, BY COUNTRY, 2018-2026 (MW)
TABLE 10: EUROPE SYNGAS MARKET, BY COUNTRY, 2018-2026(MW)
TABLE 11: ASIA-PACIFIC SYNGAS MARKET, BY COUNTRY, 2018-2026(MW)
TABLE 12: REST OF WORLD SYNGAS MARKET, BY REGION, 2018-2026(MW)
FIGURE LIST
FIGURE 1: GLOBAL SYNGAS MARKET, BY FEEDSTOCK, 2018-2026 (MW)
FIGURE 2: ASIA PACIFIC SYNGAS MARKET, 2018-2026 (MW)
FIGURE 3: GASIFICATION PROCESS
FIGURE 4: FEEDSTOCK USED FOR SYNGAS PRODUCTION
FIGURE 5: CATALYTIC CONVERSION OF SYNGAS
FIGURE 6: BARRIERS FOR SYNGAS PRODUCTION PLANTS
FIGURE 7: GLOBAL SYNGAS MARKET, BY BIOMASS/WASTE 2018-2026 (MW)
FIGURE 8: BIOMASS TO SYNGAS CONVERSION PROCESS
FIGURE 9: GLOBAL SYNGAS MARKET, BY PETROLEUM & BY-PRODUCTS 2018-2026 (MW)
FIGURE 10: GLOBAL SYNGAS MARKET, BY NATURAL GAS 2018-2026 (MW)
FIGURE 11: GLOBAL SYNGAS MARKET, BY COAL 2018-2026 (MW)
FIGURE 12: ADVANTAGES OF UCG PROCESS
FIGURE 13: GLOBAL SYNGAS MARKET, BY GASEOUS FUEL 2018-2026 (MW)
FIGURE 14: GLOBAL SYNGAS MARKET, BY POWER 2018-2026 (MW)
FIGURE 15: SYNGAS POWER GENERATION
FIGURE 16: GLOBAL SYNGAS MARKET, BY LIQUID FUEL 2018-2026 (MW)
FIGURE 17: APPLICATION OF LIQUID FUEL
FIGURE 18: GLOBAL SYNGAS MARKET, BY CHEMICALS 2018-2026 (MW)
FIGURE 19: METHANOL DERIVED PRODUCTS RANGE
FIGURE 20: APPLICATIONS OF DIMETHYL ETHER
FIGURE 21: PORTER’S FIVE FORCE ANALYSIS
FIGURE 22: VALUE CHAIN ANALYSIS
FIGURE 23: GLOBAL SYNGAS MARKET, REGIONAL OUTLOOK, 2017 & 2026 (IN %)
FIGURE 24: UNITED STATES SYNGAS MARKET, 2018-2026 (MW)
FIGURE 25: CANADA SYNGAS MARKET, 2018-2026 (MW)
FIGURE 26: UNITED KINGDOM SYNGAS MARKET, 2018-2026 (MW)
FIGURE 27: FRANCE SYNGAS MARKET, 2018-2026 (MW)
FIGURE 28: GERMANY SYNGAS MARKET, 2018-2026 (MW)
FIGURE 29: SPAIN SYNGAS MARKET, 2018-2026 (MW)
FIGURE 30: ITALY SYNGAS MARKET, 2018-2026 (MW)
FIGURE 31: NORDIC COUNTRIES SYNGAS MARKET, 2018-2026 (MW)
FIGURE 32: NETHERLAND SYNGAS MARKET, 2018-2026 (MW)
FIGURE 33: RUSSIA SYNGAS MARKET, 2018-2026 (MW)
FIGURE 34: REST OF EUROPE SYNGAS MARKET, 2018-2026 (MW)
FIGURE 35: INDIA SYNGAS MARKET, 2018-2026 (MW)
FIGURE 36: CHINA SYNGAS MARKET, 2018-2026 (MW)
FIGURE 37: JAPAN SYNGAS MARKET, 2018-2026 (MW)
FIGURE 38: REST OF ASIA PACIFIC SYNGAS MARKET, 2018-2026 (MW)
FIGURE 39: LATIN AMERICA SYNGAS MARKET, 2018-2026 (MW)
FIGURE 40: MIDDLE EAST & NORTH AFRICA SYNGAS MARKET, 2018-2026 (MW)
FIGURE 41: REST OF AFRICA SYNGAS MARKET, 2018-2026 (MW)
- MARKET BY FEEDSTOCK
- BIOMASS/WASTE
- PETROLEUM & BY-PRODUCTS
- NATURAL GAS
- COAL
- MARKET BY APPLICATION
- GASEOUS FUEL
- POWER
- LIQUID FUEL
- CHEMICALS
- GEOGRAPHICAL ANALYSIS
- NORTH AMERICA
- UNITED STATES
- CANADA
- EUROPE
- UNITED KINGDOM
- FRANCE
- GERMANY
- SPAIN
- ITALY
- NORDIC COUNTRIES
- NETHERLAND
- RUSSIA
- REST OF EUROPE
- ASIA-PACIFIC
- INDIA
- CHINA
- JAPAN
- REST OF ASIA PACIFIC
- REST OF WORLD
- LATIN AMERICA
- MIDDLE EAST & NORTH AFRICA
- REST OF AFRICA
- NORTH AMERICA
To request a free sample copy of this report, please complete the form below :
We offer 10% free customization including country-level data, niche applications and competitive landscape with every report.