

GLOBAL PROTEIN EXPRESSION MARKET FORECAST 2019-2028
Global Protein Expression Market by Product Type (Reagents, Expression Vectors, Competent Cells, Instruments, Services) by Application (Therapeutic, Industrial, Research) by End-user (Pharmaceutical & Biotechnology Companies, Academic Research Institutes, Contract Research Organizations, Other End-users) and by Geography.
Inkwood Research estimates that the global protein expression market will register a CAGR of 10.99% during the forecast period, reaching a revenue of $2.53 billion by 2028. The base year of the market study is 2018. The forecasted period is between 2019-2028.
The global protein expression market growth is driven by:
- Worldwide rise in healthcare expenditure
- Increasing R&D in the fields of genomics and proteomics
- Increasing number of chronic disease
To learn more about this report, request a free sample copy
There has been a growing prevalence of chronic diseases across the globe. In 2001, the proportion of chronic diseases was 46% of the total disease burden worldwide, which is expected to reach 57% by 2020. Cardiovascular diseases account for more than half of the chronic disease burden, while diabetes prevalence is growing at an alarming pace. The situation is alike in developed as well as developing regions. There is a rise in demand to treat and manage these chronic diseases, owing to such increasing prevalence,. Protein expression systems are widely used in therapeutic applications, which target major indications such as chronic diseases. Such factors are set to influence the growth of the market.
The reagents segment dominates the global protein expression market by product, with around 53.84% market share in 2019. In modern medicine, reagents are recognized as the largest segment in the protein expression market. Regents play an important role, owing to an increase in research activities and large-scale production of antibodies and vaccines. Further, significant advancements in protein expression have resulted in the development of novel vaccines and antibodies. Due to the wide application of these products in the research and production of biopharmaceuticals, the reagents segment was the largest revenue grossing segment in the market. It is expected that repeated buying of reagents for various applications, including therapeutic, commercial, and research would fuel the market growth.
Moreover, the services category of the product segment is estimated to record the highest CAGR of around 12.50% during the forecast period. Protein expression consists of various service categories such as protein libraries, proteins for use in diagnostic kits, protein microarrays, recombinant antigens for vaccine development, proteins for functional studies and enzymatic assays, proteins for structure studies, protein-protein and ligand interactions studies, drug screening target, and biomarker development. Furthermore, service providers are furnished with advanced products, state-of-the-art facilities, and research specialists, which is likely to increase the demand for protein expression services by manufacturers and research laboratories.
The market growth is hindered by a lack of effective systems for post-translational modifications, high cost of protein expression systems. The high cost of cell-free protein expression systems, along with competent cells and reagents required for the protein expression, is a factor that is responsible for hindering the growth of the protein expression market. However, with technological advancements, novel and cost-effective cell-free protein expression systems are expected to be developed, which can be further utilized as a platform to manufacture medicines. Although the use of CFPE is now limited, with aforementioned technological advancements, there is a possibility for these systems to be implied on a large scale, which is likely to exponentially boost the CFPE market in the forecast period. Thus, the high cost of protein expression systems, high cost of reagents, and the limitations of CFPE to small-scale capacity are expected to hinder the growth of the market during the forecast period.
The report scope of the global protein expression market covers the segmentation analysis of product type, application, and end-user.
Market by Product Type:
- Reagents
- Expression
- Competent
- Instruments
- Services
Market by Application:
- Therapeutic
- Industrial
- Research
Market by End-user:
- Contract research organizations
- Academic research institutes
- Pharmaceutical & biotechnology companies
- Other end users
On the basis of geography, the global protein expression market has been segmented into four major regions:
- North America: the United States and Canada
- Europe: the United Kingdom, Germany, France, Italy, Russia, Belgium, Poland, and Rest of Europe
- Asia Pacific: China, Japan, India, South Korea, Indonesia, Thailand, Vietnam, Australia & New Zealand, and Rest of Asia Pacific
- Rest of World: Latin America, the Middle East & Africa
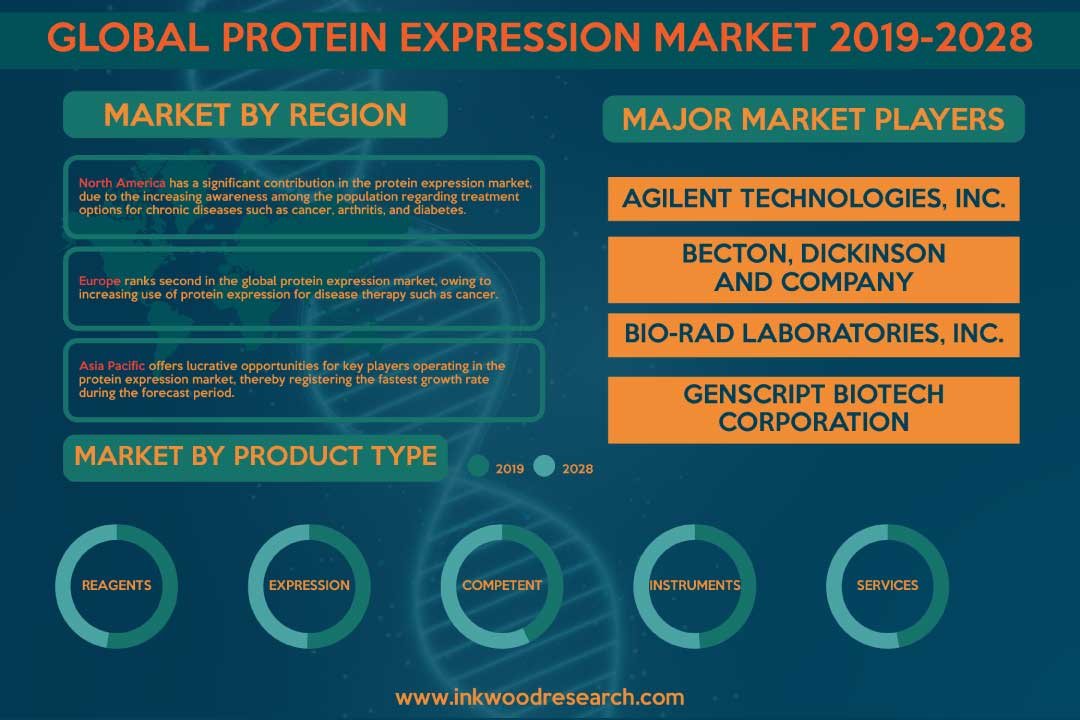
Geographically, North America dominated with a market share of 38.79% in terms of revenue in 2019. There is an increasing awareness among the population regarding treatment options for chronic diseases such as cancer, arthritis, and diabetes. The market prospects are mainly attributed to the rising incidence of the aging population and chronic diseases in North America. The use of protein expression to discover affordable and available treatment options for chronic diseases such as cancer, has increased over the years in this region. Furthermore, increased funding by various companies in their respective research and development sectors has further anticipated the growth of the market. These factors contribute to the increasing demand for protein expression in North America.
On the other hand, Asia Pacific is anticipated to be the fastest-growing region with a CAGR of xx% during the forecast period. The market is growing at a significant pace, attributed to improvements in healthcare standards, a surge in disposable income, and advancements in technology for the development of advanced proteins for the treatment of chronic disease. Furthermore, a rise in awareness toward early detection of the medical condition also contributes to the growth of the market in the region.
The key players involved in the global protein expression market are:
- Agilent Technologies Inc
- Becton, Dickinson and Company
- Bio-Rad Laboratories Inc
- Bio-Rad Laboratories Inc
- Others
In January 2020. Agilent Technologies Inc announced that it is collaborating with IIT Delhi to promote biopharmaceutical research.
Key findings of the global protein expression market:
- North America dominates the global protein expression market by capturing the largest market share in 2018.
- The Asia Pacific protein expression market is anticipated to grow at the highest CAGR of xx% during the forecast period, 2019-2028.
- Reagents segment accounts for the largest share in the protein expression market, and is projected to grow with a CAGR of xx% during the forecasted period.
- The research segment in the global protein expression market by application is projected to grow fastest amongst the application in the market at CAGR of xx% during the forecasted period.
- RESEARCH SCOPE & METHODOLOGY
- STUDY OBJECTIVES
- SCOPE OF STUDY
- METHODOLOGY
- ASSUMPTIONS & LIMITATIONS
- EXECUTIVE SUMMARY
- MARKET SIZE & ESTIMATES
- MARKET OVERVIEW
- MARKET DYNAMICS
- MARKET DEFINITION
- KEY DRIVERS
- INCREASING NUMBER OF CHRONIC DISEASE
- WORLDWIDE RISE IN HEALTHCARE EXPENDITURE
- INCREASING R&D IN THE FIELDS OF GENOMICS AND PROTEOMICS
- KEY RESTRAINTS
- HIGH COST OF PROTEIN EXPRESSION SYSTEMS
- LACK OF EFFECTIVE SYSTEMS FOR POST-TRANSLATIONAL MODIFICATIONS
- KEY ANALYTICS
- KEY INVESTMENT INSIGHTS
- PORTER’S FIVE FORCE ANALYSIS
- BUYER POWER
- SUPPLIER POWER
- SUBSTITUTION
- NEW ENTRANTS
- INDUSTRY RIVALRY
- OPPORTUNITY MATRIX
- VENDOR LANDSCAPE
- MARKET BY PRODUCT TYPE
- REAGENTS
- EXPRESSION VECTORS
- COMPETENT CELLS
- INSTRUMENTS
- SERVICES
- MARKET BY APPLICATION
- THERAPEUTIC
- INDUSTRIAL
- RESEARCH
- MARKET BY END-USER
- PHARMACEUTICAL & BIOTECHNOLOGY COMPANIES
- ACADEMIC RESEARCH INSTITUTES
- CONTRACT RESEARCH ORGANIZATIONS
- OTHER END-USERS
- GEOGRAPHICAL ANALYSIS
- NORTH AMERICA
- UNITED STATES
- CANADA
- EUROPE
- UNITED KINGDOM
- GERMANY
- FRANCE
- ITALY
- RUSSIA
- BELGIUM
- POLAND
- REST OF EUROPE
- ASIA PACIFIC
- CHINA
- JAPAN
- INDIA
- SOUTH KOREA
- INDONESIA
- THAILAND
- VIETNAM
- AUSTRALIA & NEW ZEALAND
- REST OF ASIA PACIFIC
- REST OF WORLD
- LATIN AMERICA
- MIDDLE EAST & AFRICA
- NORTH AMERICA
- COMPANY PROFILES
- AGILENT TECHNOLOGIES INC
- BECTON, DICKINSON AND COMPANY
- BIO-RAD LABORATORIES INC
- GENSCRIPT BIOTECH CORPORATION
- LIFESENSORS INC
- MERCK KGAA
- PROMEGA CORPORATION
- QIAGEN N.V.
- TAKARA HOLDINGS INC
- THERMO FISHER SCIENTIFIC INC
- LONZA INC
- NEW ENGLAND BIOLABS
- BIOTECHRABBIT GMBH
- PROMAB BIOTECHNOLOGIES GMBH
- PEAK PROTEINS LTD
TABLE LIST
TABLE 1: MARKET SNAPSHOT – PROTEIN EXPRESSION
TABLE 2: GLOBAL PROTEIN EXPRESSION MARKET, BY PRODUCT TYPE, HISTORICAL YEARS, 2016-2019 (IN $ MILLION)
TABLE 3: GLOBAL PROTEIN EXPRESSION MARKET, BY PRODUCT TYPE, FORECAST YEARS, 2019-2028 (IN $ MILLION)
TABLE 4: GLOBAL REAGENTS MARKET, BY REGION, HISTORICAL YEARS, 2016-2019 (IN $ MILLION)
TABLE 5: GLOBAL REAGENTS MARKET, BY REGION, FORECAST YEARS, 2019-2028 (IN $ MILLION)
TABLE 6: GLOBAL EXPRESSION VECTORS MARKET, BY REGION, HISTORICAL YEARS, 2016-2019 (IN $ MILLION)
TABLE 7: GLOBAL EXPRESSION VECTORS MARKET, BY REGION, FORECAST YEARS, 2019-2028 (IN $ MILLION)
TABLE 8: GLOBAL COMPETENT CELLS MARKET, BY REGION, HISTORICAL YEARS, 2016-2019 (IN $ MILLION)
TABLE 9: GLOBAL COMPETENT CELLS MARKET, BY REGION, FORECAST YEARS, 2019-2028 (IN $ MILLION)
TABLE 10: GLOBAL INSTRUMENTS MARKET, BY REGION, HISTORICAL YEARS, 2016-2019 (IN $ MILLION)
TABLE 11: GLOBAL INSTRUMENTS MARKET, BY REGION, FORECAST YEARS, 2019-2028 (IN $ MILLION)
TABLE 12: GLOBAL SERVICES MARKET, BY REGION, HISTORICAL YEARS, 2016-2019 (IN $ MILLION)
TABLE 13: GLOBAL SERVICES MARKET, BY REGION, FORECAST YEARS, 2019-2028 (IN $ MILLION)
TABLE 14: GLOBAL PROTEIN EXPRESSION MARKET, BY APPLICATION, HISTORICAL YEARS, 2016-2019 (IN $ MILLION)
TABLE 15: GLOBAL PROTEIN EXPRESSION MARKET, BY APPLICATION, FORECAST YEARS, 2019-2028 (IN $ MILLION)
TABLE 16: GLOBAL THERAPEUTIC MARKET, BY REGION, HISTORICAL YEARS, 2016-2019 (IN $ MILLION)
TABLE 17: GLOBAL THERAPEUTIC MARKET, BY REGION, FORECAST YEARS, 2019-2028 (IN $ MILLION)
TABLE 18: GLOBAL INDUSTRIAL MARKET, BY REGION, HISTORICAL YEARS, 2016-2019 (IN $ MILLION)
TABLE 19: GLOBAL INDUSTRIAL MARKET, BY REGION, FORECAST YEARS, 2019-2028 (IN $ MILLION)
TABLE 20: GLOBAL RESEARCH MARKET, BY REGION, HISTORICAL YEARS, 2016-2019 (IN $ MILLION)
TABLE 21: GLOBAL RESEARCH MARKET, BY REGION, FORECAST YEARS, 2019-2028 (IN $ MILLION)
TABLE 22: GLOBAL PROTEIN EXPRESSION MARKET, BY END-USER, HISTORICAL YEARS, 2016-2019 (IN $ MILLION)
TABLE 23: GLOBAL PROTEIN EXPRESSION MARKET, BY END-USER, FORECAST YEARS, 2019-2028 (IN $ MILLION)
TABLE 24: GLOBAL PHARMACEUTICAL & BIOTECHNOLOGY COMPANIES MARKET, BY REGION, HISTORICAL YEARS, 2016-2019 (IN $ MILLION)
TABLE 25: GLOBAL PHARMACEUTICAL & BIOTECHNOLOGY COMPANIES MARKET, BY REGION, FORECAST YEARS, 2019-2028 (IN $ MILLION)
TABLE 26: GLOBAL ACADEMIC RESEARCH INSTITUTES MARKET, BY REGION, HISTORICAL YEARS, 2016-2019 (IN $ MILLION)
TABLE 27: GLOBAL ACADEMIC RESEARCH INSTITUTES MARKET, BY REGION, FORECAST YEARS, 2019-2028 (IN $ MILLION)
TABLE 28: GLOBAL CONTRACT RESEARCH ORGANIZATIONS MARKET, BY REGION, HISTORICAL YEARS, 2016-2019 (IN $ MILLION)
TABLE 29: GLOBAL CONTRACT RESEARCH ORGANIZATIONS MARKET, BY REGION, FORECAST YEARS, 2019-2028 (IN $ MILLION)
TABLE 30: GLOBAL OTHER END-USERS MARKET, BY REGION, HISTORICAL YEARS, 2016-2019 (IN $ MILLION)
TABLE 31: GLOBAL OTHER END-USERS MARKET, BY REGION, FORECAST YEARS, 2019-2028 (IN $ MILLION)
TABLE 32: GLOBAL PROTEIN EXPRESSION MARKET, BY GEOGRAPHY, HISTORICAL YEARS, 2016-2019 (IN $ MILLION)
TABLE 33: GLOBAL PROTEIN EXPRESSION MARKET, BY GEOGRAPHY, FORECAST YEARS, 2019-2028 (IN $ MILLION)
TABLE 34: NORTH AMERICA PROTEIN EXPRESSION MARKET, BY COUNTRY, HISTORICAL YEARS, 2016-2019 (IN $ MILLION)
TABLE 35: NORTH AMERICA PROTEIN EXPRESSION MARKET, BY COUNTRY, FORECAST YEARS, 2019-2028 (IN $ MILLION)
TABLE 36: EUROPE PROTEIN EXPRESSION MARKET, BY COUNTRY, HISTORICAL YEARS, 2016-2019 (IN $ MILLION)
TABLE 37: EUROPE PROTEIN EXPRESSION MARKET, BY COUNTRY, FORECAST YEARS, 2019-2028 (IN $ MILLION)
TABLE 38: ASIA PACIFIC PROTEIN EXPRESSION MARKET, BY COUNTRY, HISTORICAL YEARS, 2016-2019 (IN $ MILLION)
TABLE 39: ASIA PACIFIC PROTEIN EXPRESSION MARKET, BY COUNTRY, FORECAST YEARS, 2019-2028 (IN $ MILLION)
TABLE 40: REST OF WORLD PROTEIN EXPRESSION MARKET, BY REGION, HISTORICAL YEARS, 2016-2019 (IN $ MILLION)
TABLE 41: REST OF WORLD PROTEIN EXPRESSION MARKET, BY REGION, FORECAST YEARS, 2019-2028 (IN $ MILLION)
FIGURE LIST
FIGURE 1: KEY INVESTMENT INSIGHTS
FIGURE 2: PORTER’S FIVE FORCE ANALYSIS
FIGURE 3: OPPORTUNITY MATRIX
FIGURE 4: VENDOR LANDSCAPE
FIGURE 5: GLOBAL PROTEIN EXPRESSION MARKET, GROWTH POTENTIAL, BY PRODUCT TYPE, IN 2019
FIGURE 6: GLOBAL PROTEIN EXPRESSION MARKET, BY REAGENTS, 2019-2028 (IN $ MILLION)
FIGURE 7: GLOBAL PROTEIN EXPRESSION MARKET, BY EXPRESSION VECTORS, 2019-2028 (IN $ MILLION)
FIGURE 8: GLOBAL PROTEIN EXPRESSION MARKET, BY COMPETENT CELLS, 2019-2028 (IN $ MILLION)
FIGURE 9: GLOBAL PROTEIN EXPRESSION MARKET, BY INSTRUMENTS, 2019-2028 (IN $ MILLION)
FIGURE 10: GLOBAL PROTEIN EXPRESSION MARKET, BY SERVICES, 2019-2028 (IN $ MILLION)
FIGURE 11: GLOBAL PROTEIN EXPRESSION MARKET, GROWTH POTENTIAL, BY APPLICATION, IN 2019
FIGURE 12: GLOBAL PROTEIN EXPRESSION MARKET, BY THERAPEUTIC, 2019-2028 (IN $ MILLION)
FIGURE 13: GLOBAL PROTEIN EXPRESSION MARKET, BY INDUSTRIAL, 2019-2028 (IN $ MILLION)
FIGURE 14: GLOBAL PROTEIN EXPRESSION MARKET, BY RESEARCH, 2019-2028 (IN $ MILLION)
FIGURE 15: GLOBAL PROTEIN EXPRESSION MARKET, GROWTH POTENTIAL, BY END-USER, IN 2019
FIGURE 16: GLOBAL PROTEIN EXPRESSION MARKET, BY PHARMACEUTICAL & BIOTECHNOLOGY COMPANIES, 2019-2028 (IN $ MILLION)
FIGURE 17: GLOBAL PROTEIN EXPRESSION MARKET, BY ACADEMIC RESEARCH INSTITUTES, 2019-2028 (IN $ MILLION)
FIGURE 18: GLOBAL PROTEIN EXPRESSION MARKET, BY CONTRACT RESEARCH ORGANIZATIONS, 2019-2028 (IN $ MILLION)
FIGURE 19: GLOBAL PROTEIN EXPRESSION MARKET, BY OTHER END-USERS, 2019-2028 (IN $ MILLION)
FIGURE 20: NORTH AMERICA PROTEIN EXPRESSION MARKET, REGIONAL OUTLOOK, 2019 & 2028 (IN %)
FIGURE 21: UNITED STATES PROTEIN EXPRESSION MARKET, 2019-2028 (IN $ MILLION)
FIGURE 22: CANADA PROTEIN EXPRESSION MARKET, 2019-2028 (IN $ MILLION)
FIGURE 23: EUROPE PROTEIN EXPRESSION MARKET, REGIONAL OUTLOOK, 2019 & 2028 (IN %)
FIGURE 24: UNITED KINGDOM PROTEIN EXPRESSION MARKET, 2019-2028 (IN $ MILLION)
FIGURE 25: GERMANY PROTEIN EXPRESSION MARKET, 2019-2028 (IN $ MILLION)
FIGURE 26: FRANCE PROTEIN EXPRESSION MARKET, 2019-2028 (IN $ MILLION)
FIGURE 27: ITALY PROTEIN EXPRESSION MARKET, 2019-2028 (IN $ MILLION)
FIGURE 28: RUSSIA PROTEIN EXPRESSION MARKET, 2019-2028 (IN $ MILLION)
FIGURE 29: BELGIUM PROTEIN EXPRESSION MARKET, 2019-2028 (IN $ MILLION)
FIGURE 30: POLAND PROTEIN EXPRESSION MARKET, 2019-2028 (IN $ MILLION)
FIGURE 31: REST OF EUROPE PROTEIN EXPRESSION MARKET, 2019-2028 (IN $ MILLION)
FIGURE 32: ASIA PACIFIC PROTEIN EXPRESSION MARKET, REGIONAL OUTLOOK, 2019 & 2028 (IN %)
FIGURE 33: CHINA PROTEIN EXPRESSION MARKET, 2019-2028 (IN $ MILLION)
FIGURE 34: JAPAN PROTEIN EXPRESSION MARKET, 2019-2028 (IN $ MILLION)
FIGURE 35: INDIA PROTEIN EXPRESSION MARKET, 2019-2028 (IN $ MILLION)
FIGURE 36: SOUTH KOREA PROTEIN EXPRESSION MARKET, 2019-2028 (IN $ MILLION)
FIGURE 37: INDONESIA PROTEIN EXPRESSION MARKET, 2019-2028 (IN $ MILLION)
FIGURE 38: THAILAND PROTEIN EXPRESSION MARKET, 2019-2028 (IN $ MILLION)
FIGURE 39: VIETNAM PROTEIN EXPRESSION MARKET, 2019-2028 (IN $ MILLION)
FIGURE 40: AUSTRALIA & NEW ZEALAND PROTEIN EXPRESSION MARKET, 2019-2028 (IN $ MILLION)
FIGURE 41: REST OF ASIA PACIFIC PROTEIN EXPRESSION MARKET, 2019-2028 (IN $ MILLION)
FIGURE 42: REST OF WORLD PROTEIN EXPRESSION MARKET, REGIONAL OUTLOOK, 2019 & 2028 (IN %)
FIGURE 43: LATIN AMERICA PROTEIN EXPRESSION MARKET, 2019-2028 (IN $ MILLION)
FIGURE 44: MIDDLE EAST & AFRICA PROTEIN EXPRESSION MARKET, 2019-2028 (IN $ MILLION)
- MARKET BY PRODUCT TYPE
- REAGENTS
- EXPRESSION VECTORS
- COMPETENT CELLS
- INSTRUMENTS
- SERVICES
- MARKET BY APPLICATION
- THERAPEUTIC
- INDUSTRIAL
- RESEARCH
- MARKET BY END-USER
- PHARMACEUTICAL & BIOTECHNOLOGY COMPANIES
- ACADEMIC RESEARCH INSTITUTES
- CONTRACT RESEARCH ORGANIZATIONS
- OTHER END-USERS
- GEOGRAPHICAL ANALYSIS
- NORTH AMERICA
- UNITED STATES
- CANADA
- EUROPE
- UNITED KINGDOM
- GERMANY
- FRANCE
- ITALY
- RUSSIA
- BELGIUM
- POLAND
- REST OF EUROPE
- ASIA PACIFIC
- CHINA
- JAPAN
- INDIA
- SOUTH KOREA
- INDONESIA
- THAILAND
- VIETNAM
- AUSTRALIA & NEW ZEALAND
- REST OF ASIA PACIFIC
- REST OF WORLD
- LATIN AMERICA
- MIDDLE EAST & AFRICA
- NORTH AMERICA
To request a free sample copy of this report, please complete the form below :
We offer 10% free customization including country-level data, niche applications and competitive landscape with every report.
Choose License Type
RELATED REPORTS
-

POLAND MOBILE IMAGING SERVICES MARKET FORECAST 2025-2032
-

UNITED STATES MOBILE IMAGING SERVICES MARKET FORECAST 2025-2032
-

INDIA MOBILE IMAGING SERVICES MARKET FORECAST 2025-2032
-

ASIA-PACIFIC MOBILE IMAGING SERVICES MARKET FORECAST 2025-2032
-

EUROPE MOBILE IMAGING SERVICES MARKET FORECAST 2025-2032
-

NORTH AMERICA MOBILE IMAGING SERVICES MARKET FORECAST 2025-2032
-

GLOBAL MOBILE IMAGING SERVICES MARKET FORECAST 2025-2032
-

UNITED KINGDOM SEMEN ANALYSIS MARKET FORECAST 2025-2032
-

INDIA SEMEN ANALYSIS MARKET FORECAST 2025-2032
-

JAPAN SEMEN ANALYSIS MARKET FORECAST 2025-2032