

GLOBAL OPIOIDS DRUGS MARKET FORECAST 2019-2028
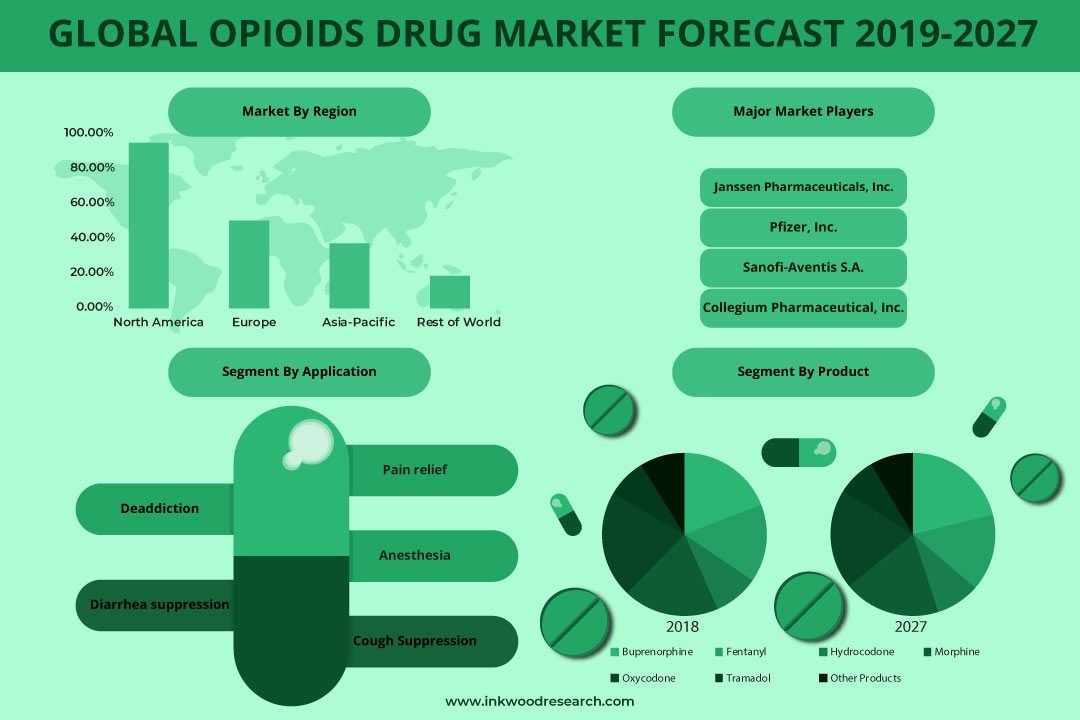
Global Opioids Drug Market by Products (Buprenorphine, Fentanyl, Hydrocodone, Morphine, Oxycodone, Tramadol and Other Products), by Application (Pain Relief, Anesthesia, Cough Suppression, Diarrhea Suppression, Deaddiction) and by Geography.
The global opioids drugs market is anticipated to grow at a CAGR of 2.48% between 2019 and 2028 and is anticipated to generate revenue of $33.62 billion by 2028. Opioids are prescription-only drugs and are the cornerstone of moderate to severe pain. The opioid drug market is a fragmented market with numerous small and large players.
The factors boosting the global opioids drugs market growth are:
- Surging prevalence of chronic pain
- Rising incidence of road accidents and surgical procedures
- Usage of abuse-deterrent formulations to restrict the opioid abuse
- Growing palliative care for intensely suffering patients
To know more about this report, request a free sample copy
The important drivers increasing growth in the global opioids drugs market are escalating palliative care for patients suffering intensely and the usage of abuse-deterrent preparations to restrict opioid abuse. Palliative care treats symptoms such as depression, pain, nausea, sleep disorders, anxiety, loss of appetite, and other stress-related disorders. Palliative care improves the quality of life of patients, who are suffering from life-threatening illnesses. The development of abuse-deterrent formulations of opioid medications is likely to decrease the abuse, addiction, and misuse of opioid drugs.
In 2019, oxycodone accounted for the largest market share of 20.96% in the product segment. Buprenorphine is anticipated to be the fastest-growing product. Buprenorphine has a strong empathy for the opioid receptor. Buprenorphine is a derivative of the opioid alkaloid, and is more potent than morphine. It acts as a partial agonist at mu and kappa opioid receptors and as an antagonist at delta receptors. Several federal initiatives have been taken to increase the treatment access for opioid use disorder, which is anticipated to create opportunities for continued strong growth of the buprenorphine market during the forecast period.
The increasing number of lawsuits cases against opioid manufacturers and rising occurrence of deaths related to opioid overdose are the major factors hindering the opioids drugs market growth. The growing opioid crisis has led to the filing of lawsuits against pharmaceuticals companies who are manufacturing opioid drugs. The lawsuits are filed against the companies claiming that the drug manufacturers hid evidence of the addiction consequences of opioid drugs. The number of death due to drug overdose is increasing tremendously, and opioids are contributing significantly towards such health issues. The opioid addiction and growing trend of opioid abuse are the major factors contributing to the high death rate related to opioid overdose.
The report on the global opioids drugs market includes the segmentation analysis of product and application.
Product is segmented into:
- Buprenorphine
- Fentanyl
- Hydrocodone
- Morphine
- Oxycodone
- Tramadol
- Other products
Application is segmented into:
- Pain relief
- Cancer pain
- Postoperative pain management
- Low back pain
- Orthopedic
- Fibromyalgia
- Neuropathic
- Anesthesia
- Cough suppression
- Diarrhea suppression
- Deaddiction
Geographically, the global opioids drugs market has been segmented on the basis of four major regions, which includes:
- North America: the United States and Canada
- Asia Pacific: China, Japan, Indonesia, India, South Korea, Thailand, Vietnam, Australia, New Zealand, and Rest of Asia Pacific
- Europe: The United Kingdom, Germany, Russia, Italy, Belgium, France, Poland, and Rest of Europe
- Rest of World: Latin America, the Middle East & Africa
In 2019, North America captured the market share of approx. 47.79% in terms of revenue. Opioids are commonly used for severe chronic pain. However, in the United States, there is an increasing trend of its long-term usage and abuse, leading to high physical dependence, addiction, and withdrawal symptoms. Moreover, the implementation of government policies, rising incidence of opioids abuse and addiction, and stringent regulatory scenarios for opioid drugs sale are impeding the growth of the market in Canada.
On the other hand, the Asia Pacific market region is anticipated to the fastest-growing region for the opioids drugs market. There is a stigma, such as addiction associated with the use of opioids among physicians and patients. In order to tackle this, China’s government launched a ‘good pain management’ program in 2011, which aims at standardizing the treatment of cancer pain, thereby improving the quality of cancer patient’s life. According to the study published in 2015, on chronic pain in the Japanese Community, in the Public Library of Science (PLOS), there is a high prevalence and severity of chronic pain in the adult Japanese population.
The renowned market players of the global opioids drugs market are:
- Allergan Plc
- Cipher Pharmaceuticals Inc
- Johnson & Johnson
- Lupin Ltd
- Pfizer Inc
Key strategies adopted by some of the opioids drugs companies are:
In January 2020, Allergan Plc announced that the Food and Drug Administration has accepted the company’s New Drug Application for DURYSTA (bimatoprost implant). The approval made DURYSTA becomes the first biodegradable, intracameral sustained-release implant designated to reduce intraocular pressure in patients with open-angle glaucoma (OAG) or ocular hypertension (OHT). Furthermore, in 2020, Daiichi Sankyo Company, announced that it has entered into a strategic partnership with Ultragenyx Pharmaceutical Inc.
Key findings of the global opioids drugs market are:
- The increasing use of extended-release opioid formulations is driving market growth.
- A wide range of application of opioids is used in therapeutic pain management.
- Oxycodone holds the largest market share in terms of revenue in the product segment.
- Anesthesia is the majorly used application in invasive surgical procedures.
- RESEARCH SCOPE & METHODOLOGY
- STUDY OBJECTIVES
- SCOPE OF STUDY
- METHODOLOGY
- ASSUMPTIONS & LIMITATIONS
- EXECUTIVE SUMMARY
- MARKET SIZE & ESTIMATES
- MARKET OVERVIEW
- MARKET DYNAMICS
- MARKET DEFINITION
- KEY DRIVERS
- INCREASING ROAD ACCIDENTS AND SURGICAL PROCEDURES
- ESCALATING PALLIATIVE CARE FOR PATIENTS SUFFERING INTENSELY
- USAGE OF ABUSE DETERRENT FORMULATIONS TO RESTRICT THE OPIOID ABUSE
- GROWING OCCURRENCE OF CHRONIC PAIN
- KEY RESTRAINTS
- MISUSE OF OPIOIDS
- STRINGENT REGULATORY FRAMEWORK
- OPIOID CRISIS ACROSS THE GLOBE
- INCREASING NUMBER OF LAWSUITS CASES AGAINST OPIOIDS MANUFACTURERS
- RISING OCCURRENCE OF DEATHS RELATED TO OPIOID OVERDOSE
- KEY ANALYTICS
- KEY INVESTMENT INSIGHTS
- PORTER’S FIVE FORCE ANALYSIS
- BUYER POWER
- SUPPLIER POWER
- SUBSTITUTION
- NEW ENTRANTS
- INDUSTRY RIVALRY
- OPPORTUNITY MATRIX
- VENDOR LANDSCAPE
- REGULATORY FRAMEWORK
- PIPELINE ANALYSIS
- INDUSTRY EVENTS IN OPIOID DRUGS MARKET
- TECHNOLOGICAL ADVANCEMENT
- MARKET BY PRODUCT
- BUPRENORPHINE
- FENTANYL
- HYDROCODONE
- MORPHINE
- OXYCODONE
- TRAMADOL
- OTHER PRODUCTS
- MARKET BY APPLICATION
- PAIN RELIEF
- CANCER PAIN
- POSTOPERATIVE PAIN MANAGEMENT
- LOW BACK PAIN
- ORTHOPEDIC
- FIBROMYALGIA
- NEUROPATHIC
- ANESTHESIA
- COUGH SUPPRESSION
- DIARRHEA SUPPRESSION
- DEADDICTION
- PAIN RELIEF
- GEOGRAPHICAL ANALYSIS
- NORTH AMERICA
- UNITED STATES
- CANADA
- EUROPE
- UNITED KINGDOM
- GERMANY
- FRANCE
- ITALY
- RUSSIA
- BELGIUM
- POLAND
- REST OF EUROPE
- ASIA PACIFIC
- CHINA
- JAPAN
- INDIA
- SOUTH KOREA
- INDONESIA
- THAILAND
- VIETNAM
- AUSTRALIA & NEW ZEALAND
- REST OF ASIA PACIFIC
- REST OF WORLD
- LATIN AMERICA
- MIDDLE EAST AND AFRICA
- NORTH AMERICA
- COMPANY PROFILES
- ACURA PHARMACEUTICALS INC
- ALLERGAN PLC
- BIODELIVERY SCIENCES INTERNATIONAL INC
- CIPHER PHARMACEUTICALS INC
- COLLEGIUM PHARMACEUTICAL INC
- DAIICHI SANKYO INC
- EGALET CORP
- HIKMA PHARMACEUTICALS PLC
- INDIVIOR INC
- JANSSEN PHARMACEUTICALS INC
- JOHNSON & JOHNSON
- LANNETT CO. INC
- LUPIN LTD
- MYLAN NV
- PFIZER INC
- PURDUE PHARMA LP
- SANOFI-AVENTIS S.A
- SUN PHARMACEUTICAL INDUSTRIES LIMITED (SUN PHARMA)
- TEVA PHARMACEUTICAL INDUSTRIES LTD
LIST OF TABLES
TABLE 1: MARKET SNAPSHOT – OPIOIDS DRUGS
TABLE 2: FDA APPROVED OPIOIDS WITH ADF LABELLING
TABLE 3: NUMBER OF LAWSUITS CASES SETTLED BY OPIOIDS MANUFACTURING COMPANIES AND PHARMACIES, 2015–2027
TABLE 4: LIST OF ER/LA OPIOID BRANDED DRUGS 2017
TABLE 5: LIST OF ER/LA OPIOID GENERIC DRUGS 2017
TABLE 6: CDC GUIDELINES ON PRESCRIBING OPIOIDS
TABLE 7: PIPELINE ANALYSIS OF OPIOID DRUGS
TABLE 8: GLOBAL OPIOIDS DRUGS MARKET, BY PRODUCT, HISTORICAL YEARS, 2016-2019 (IN $ MILLION)
TABLE 9: GLOBAL OPIOIDS DRUGS MARKET, BY PRODUCT, FORECAST YEARS, 2019-2028 (IN $ MILLION)
TABLE 10: GLOBAL BUPRENORPHINE MARKET, BY REGION, HISTORICAL YEARS, 2016-2019 (IN $ MILLION)
TABLE 11: GLOBAL BUPRENORPHINE MARKET, BY REGION, FORECAST YEARS, 2019-2028 (IN $ MILLION)
TABLE 12: GLOBAL FENTANYL MARKET, BY REGION, HISTORICAL YEARS, 2016-2019 (IN $ MILLION)
TABLE 13: GLOBAL FENTANYL MARKET, BY REGION, FORECAST YEARS, 2019-2028 (IN $ MILLION)
TABLE 14: GLOBAL HYDROCODONE MARKET, BY REGION, HISTORICAL YEARS, 2016-2019 (IN $ MILLION)
TABLE 15: GLOBAL HYDROCODONE MARKET, BY REGION, FORECAST YEARS, 2019-2028 (IN $ MILLION)
TABLE 16: GLOBAL MORPHINE MARKET, BY REGION, HISTORICAL YEARS, 2016-2019 (IN $ MILLION)
TABLE 17: GLOBAL MORPHINE MARKET, BY REGION, FORECAST YEARS, 2019-2028 (IN $ MILLION)
TABLE 18: GLOBAL OXYCODONE MARKET, BY REGION, HISTORICAL YEARS, 2016-2019 (IN $ MILLION)
TABLE 19: GLOBAL OXYCODONE MARKET, BY REGION, FORECAST YEARS, 2019-2028 (IN $ MILLION)
TABLE 20: GLOBAL TRAMADOL MARKET, BY REGION, HISTORICAL YEARS, 2016-2019 (IN $ MILLION)
TABLE 21: GLOBAL TRAMADOL MARKET, BY REGION, FORECAST YEARS, 2019-2028 (IN $ MILLION)
TABLE 22: GLOBAL OTHER PRODUCTS MARKET, BY REGION, HISTORICAL YEARS, 2016-2019 (IN $ MILLION)
TABLE 23: GLOBAL OTHER PRODUCTS MARKET, BY REGION, FORECAST YEARS, 2019-2028 (IN $ MILLION)
TABLE 24: GLOBAL OPIOIDS DRUGS MARKET, BY APPLICATION, HISTORICAL YEARS, 2016-2019 (IN $ MILLION)
TABLE 25: GLOBAL OPIOIDS DRUGS MARKET, BY APPLICATION, FORECAST YEARS, 2019-2028 (IN $ MILLION)
TABLE 26: GLOBAL PAIN RELIEF MARKET, BY REGION, HISTORICAL YEARS, 2016-2019 (IN $ MILLION)
TABLE 27: GLOBAL PAIN RELIEF MARKET, BY REGION, FORECAST YEARS, 2019-2028 (IN $ MILLION)
TABLE 28: GLOBAL PAIN RELIEF MARKET, BY TYPE, HISTORICAL YEARS, 2016-2019 (IN $ MILLION)
TABLE 29: GLOBAL PAIN RELIEF MARKET, BY TYPE, FORECAST YEARS, 2019-2028 (IN $ MILLION)
TABLE 30: GLOBAL CANCER PAIN MARKET, BY REGION, HISTORICAL YEARS, 2016-2019 (IN $ MILLION)
TABLE 31: GLOBAL CANCER PAIN MARKET, BY REGION, FORECAST YEARS, 2019-2028 (IN $ MILLION)
TABLE 32: GLOBAL POSTOPERATIVE PAIN MANAGEMENT MARKET, BY REGION, HISTORICAL YEARS, 2016-2019 (IN $ MILLION)
TABLE 33: GLOBAL POSTOPERATIVE PAIN MANAGEMENT MARKET, BY REGION, FORECAST YEARS, 2019-2028 (IN $ MILLION)
TABLE 34: GLOBAL LOW BACK PAIN MARKET, BY REGION, HISTORICAL YEARS, 2016-2019 (IN $ MILLION)
TABLE 35: GLOBAL LOW BACK PAIN MARKET, BY REGION, FORECAST YEARS, 2019-2028 (IN $ MILLION)
TABLE 36: GLOBAL ORTHOPEDIC MARKET, BY REGION, HISTORICAL YEARS, 2016-2019 (IN $ MILLION)
TABLE 37: GLOBAL ORTHOPEDIC MARKET, BY REGION, FORECAST YEARS, 2019-2028 (IN $ MILLION)
TABLE 38: GLOBAL FIBROMYALGIA MARKET, BY REGION, HISTORICAL YEARS, 2016-2019 (IN $ MILLION)
TABLE 39: GLOBAL FIBROMYALGIA MARKET, BY REGION, FORECAST YEARS, 2019-2028 (IN $ MILLION)
TABLE 40: GLOBAL NEUROPATHIC MARKET, BY REGION, HISTORICAL YEARS, 2016-2019 (IN $ MILLION)
TABLE 41: GLOBAL NEUROPATHIC MARKET, BY REGION, FORECAST YEARS, 2019-2028 (IN $ MILLION)
TABLE 42: GLOBAL ANESTHESIA MARKET, BY REGION, HISTORICAL YEARS, 2016-2019 (IN $ MILLION)
TABLE 43: GLOBAL ANESTHESIA MARKET, BY REGION, FORECAST YEARS, 2019-2028 (IN $ MILLION)
TABLE 44: GLOBAL COUGH SUPPRESSION MARKET, BY REGION, HISTORICAL YEARS, 2016-2019 (IN $ MILLION)
TABLE 45: GLOBAL COUGH SUPPRESSION MARKET, BY REGION, FORECAST YEARS, 2019-2028 (IN $ MILLION)
TABLE 46: GLOBAL DIARRHEA SUPPRESSION MARKET, BY REGION, HISTORICAL YEARS, 2016-2019 (IN $ MILLION)
TABLE 47: GLOBAL DIARRHEA SUPPRESSION MARKET, BY REGION, FORECAST YEARS, 2019-2028 (IN $ MILLION)
TABLE 48: GLOBAL DEADDICTION MARKET, BY REGION, HISTORICAL YEARS, 2016-2019 (IN $ MILLION)
TABLE 49: GLOBAL DEADDICTION MARKET, BY REGION, FORECAST YEARS, 2019-2028 (IN $ MILLION)
TABLE 50: GLOBAL OPIOIDS DRUGS MARKET, BY GEOGRAPHY, HISTORICAL YEARS, 2016-2019 (IN $ MILLION)
TABLE 51: GLOBAL OPIOIDS DRUGS MARKET, BY GEOGRAPHY, FORECAST YEARS, 2019-2028 (IN $ MILLION)
TABLE 52: NORTH AMERICA OPIOIDS DRUGS MARKET, BY COUNTRY, HISTORICAL YEARS, 2016-2019 (IN $ MILLION)
TABLE 53: NORTH AMERICA OPIOIDS DRUGS MARKET, BY COUNTRY, FORECAST YEARS, 2019-2028 (IN $ MILLION)
TABLE 54: EUROPE OPIOIDS DRUGS MARKET, BY COUNTRY, HISTORICAL YEARS, 2016-2019 (IN $ MILLION)
TABLE 55: EUROPE OPIOIDS DRUGS MARKET, BY COUNTRY, FORECAST YEARS, 2019-2028 (IN $ MILLION)
TABLE 56: ASIA PACIFIC OPIOIDS DRUGS MARKET, BY COUNTRY, HISTORICAL YEARS, 2016-2019 (IN $ MILLION)
TABLE 57: ASIA PACIFIC OPIOIDS DRUGS MARKET, BY COUNTRY, FORECAST YEARS, 2019-2028 (IN $ MILLION)
TABLE 58: REST OF WORLD OPIOIDS DRUGS MARKET, BY REGION, HISTORICAL YEARS, 2016-2019 (IN $ MILLION)
TABLE 59: REST OF WORLD OPIOIDS DRUGS MARKET, BY REGION, FORECAST YEARS, 2019-2028 (IN $ MILLION)
LIST OF FIGURES
FIGURE 1: KEY INVESTMENT INSIGHTS
FIGURE 2: PORTER’S FIVE FORCE ANALYSIS
FIGURE 3: OPPORTUNITY MATRIX
FIGURE 4: VENDOR LANDSCAPE
FIGURE 5: GLOBAL OPIOIDS DRUGS MARKET, GROWTH POTENTIAL, BY PRODUCT, IN 2019
FIGURE 6: GLOBAL OPIOIDS DRUGS MARKET, BY BUPRENORPHINE, 2019-2028 (IN $ MILLION)
FIGURE 7: GLOBAL OPIOIDS DRUGS MARKET, BY FENTANYL, 2019-2028 (IN $ MILLION)
FIGURE 8: GLOBAL OPIOIDS DRUGS MARKET, BY HYDROCODONE, 2019-2028 (IN $ MILLION)
FIGURE 9: GLOBAL OPIOIDS DRUGS MARKET, BY MORPHINE, 2019-2028 (IN $ MILLION)
FIGURE 10: GLOBAL OPIOIDS DRUGS MARKET, BY OXYCODONE, 2019-2028 (IN $ MILLION)
FIGURE 11: GLOBAL OPIOIDS DRUGS MARKET, BY TRAMADOL, 2019-2028 (IN $ MILLION)
FIGURE 12: GLOBAL OPIOIDS DRUGS MARKET, BY OTHER PRODUCTS, 2019-2028 (IN $ MILLION)
FIGURE 13: GLOBAL OPIOIDS DRUGS MARKET, GROWTH POTENTIAL, BY APPLICATION, IN 2019
FIGURE 14: GLOBAL OPIOIDS DRUGS MARKET, BY PAIN RELIEF, 2019-2028 (IN $ MILLION)
FIGURE 15: GLOBAL OPIOIDS DRUGS MARKET, BY CANCER PAIN, 2019-2028 (IN $ MILLION)
FIGURE 16: GLOBAL OPIOIDS DRUGS MARKET, BY POSTOPERATIVE PAIN MANAGEMENT, 2019-2028 (IN $ MILLION)
FIGURE 17: GLOBAL OPIOIDS DRUGS MARKET, BY LOW BACK PAIN, 2019-2028 (IN $ MILLION)
FIGURE 18: GLOBAL OPIOIDS DRUGS MARKET, BY ORTHOPEDIC, 2019-2028 (IN $ MILLION)
FIGURE 19: GLOBAL OPIOIDS DRUGS MARKET, BY FIBROMYALGIA, 2019-2028 (IN $ MILLION)
FIGURE 20: GLOBAL OPIOIDS DRUGS MARKET, BY NEUROPATHIC, 2019-2028 (IN $ MILLION)
FIGURE 21: GLOBAL OPIOIDS DRUGS MARKET, BY ANESTHESIA, 2019-2028 (IN $ MILLION)
FIGURE 22: GLOBAL OPIOIDS DRUGS MARKET, BY COUGH SUPPRESSION, 2019-2028 (IN $ MILLION)
FIGURE 23: GLOBAL OPIOIDS DRUGS MARKET, BY DIARRHEA SUPPRESSION, 2019-2028 (IN $ MILLION)
FIGURE 24: GLOBAL OPIOIDS DRUGS MARKET, BY DEADDICTION, 2019-2028 (IN $ MILLION)
FIGURE 25: NORTH AMERICA OPIOIDS DRUGS MARKET, REGIONAL OUTLOOK, 2019 & 2028 (IN %)
FIGURE 26: UNITED STATES OPIOIDS DRUGS MARKET, 2020-2028 (IN $ MILLION)
FIGURE 27: CANADA OPIOIDS DRUGS MARKET, 2020-2028 (IN $ MILLION)
FIGURE 28: EUROPE OPIOIDS DRUGS MARKET, REGIONAL OUTLOOK, 2019 & 2028 (IN %)
FIGURE 29: UNITED KINGDOM OPIOIDS DRUGS MARKET, 2019-2028 (IN $ MILLION)
FIGURE 30: GERMANY OPIOIDS DRUGS MARKET, 2019-2028 (IN $ MILLION)
FIGURE 31: FRANCE OPIOIDS DRUGS MARKET, 2019-2028 (IN $ MILLION)
FIGURE 32: ITALY OPIOIDS DRUGS MARKET, 2019-2028 (IN $ MILLION)
FIGURE 33: RUSSIA OPIOIDS DRUGS MARKET, 2019-2028 (IN $ MILLION)
FIGURE 34: BELGIUM OPIOIDS DRUGS MARKET, 2019-2028 (IN $ MILLION)
FIGURE 35: POLAND OPIOIDS DRUGS MARKET, 2019-2028 (IN $ MILLION)
FIGURE 36: REST OF EUROPE OPIOIDS DRUGS MARKET, 2019-2028 (IN $ MILLION)
FIGURE 37: ASIA PACIFIC OPIOIDS DRUGS MARKET, REGIONAL OUTLOOK, 2019 & 2028 (IN %)
FIGURE 38: CHINA OPIOIDS DRUGS MARKET, 2020-2028 (IN $ MILLION)
FIGURE 39: JAPAN OPIOIDS DRUGS MARKET, 2020-2028 (IN $ MILLION)
FIGURE 40: INDIA OPIOIDS DRUGS MARKET, 2020-2028 (IN $ MILLION)
FIGURE 41: SOUTH KOREA OPIOIDS DRUGS MARKET, 2020-2028 (IN $ MILLION)
FIGURE 42: INDONESIA OPIOID DRUGS MARKET, 2020-2028 (IN $ MILLION)
FIGURE 43: THAILAND OPIOID DRUGS MARKET, 2020-2028 (IN $ MILLION)
FIGURE 44: VIETNAM OPIOID DRUGS MARKET, 2020-2028 (IN $ MILLION)
FIGURE 45: AUSTRALIA & NEW ZEALAND OPIOID DRUGS MARKET, 2020-2028 (IN $ MILLION)
FIGURE 46: REST OF WORLD OPIOIDS DRUGS MARKET, REGIONAL OUTLOOK, 2019 & 2028 (IN %)
FIGURE 47: LATIN AMERICA OPIOIDS DRUGS MARKET, 2020-2028 (IN $ MILLION)
FIGURE 48: MIDDLE EAST AND AFRICA OPIOIDS DRUGS MARKET, 2020-2028 (IN $ MILLION)
- MARKET BY PRODUCT
- BUPRENORPHINE
- FENTANYL
- HYDROCODONE
- MORPHINE
- OXYCODONE
- TRAMADOL
- OTHER PRODUCTS
- MARKET BY APPLICATION
- PAIN RELIEF
- CANCER PAIN
- POSTOPERATIVE PAIN MANAGEMENT
- LOW BACK PAIN
- ORTHOPEDIC
- FIBROMYALGIA
- NEUROPATHIC
- ANESTHESIA
- COUGH SUPPRESSION
- DIARRHEA SUPPRESSION
- DEADDICTION
- PAIN RELIEF
- GEOGRAPHICAL ANALYSIS
- NORTH AMERICA
- UNITED STATES
- CANADA
- EUROPE
- UNITED KINGDOM
- GERMANY
- FRANCE
- ITALY
- RUSSIA
- BELGIUM
- POLAND
- REST OF EUROPE
- ASIA PACIFIC
- CHINA
- JAPAN
- INDIA
- SOUTH KOREA
- INDONESIA
- THAILAND
- VIETNAM
- AUSTRALIA & NEW ZEALAND
- REST OF ASIA PACIFIC
- REST OF WORLD
- LATIN AMERICA
- MIDDLE EAST AND AFRICA
- NORTH AMERICA
To request a free sample copy of this report, please complete the form below :
We offer 10% free customization including country-level data, niche applications and competitive landscape with every report.
Choose License Type
RELATED REPORTS
-

GLOBAL HALAL PHARMACEUTICALS MARKET FORECAST 2025-2032
-

ASIA-PACIFIC HALAL PHARMACEUTICALS MARKET FORECAST 2025-2032
-

EUROPE HALAL PHARMACEUTICALS MARKET FORECAST 2025-2032
-

NORTH AMERICA HALAL PHARMACEUTICALS MARKET FORECAST 2025-2032
-

LATIN AMERICA HALAL PHARMACEUTICALS MARKET FORECAST 2025-2032
-

MIDDLE EAST & AFRICA HALAL PHARMACEUTICALS MARKET FORECAST 2025-2032
-

EGYPT HALAL PHARMACEUTICALS MARKET FORECAST 2025-2032
-

MALAYSIA HALAL PHARMACEUTICALS MARKET FORECAST 2025-2032
-

INDONESIA HALAL PHARMACEUTICALS MARKET FORECAST 2025-2032
-

GLOBAL HALAL NUTRACEUTICALS MARKET FORECAST 2025-2032