

NORWAY LIQUEFIED NATURAL GAS (LNG) MARKET
Natural gas is a fossil fuel majorly comprising of methane. As with other fossil fuels, it is formed deep beneath the earth’s surface due to the decomposition of dead plants and animals under extreme heat and pressures. Natural gas is cleaner than most other fossilized fuels. However, its calorific value is lower than the fossil fuels like petrol, diesel, and LPG.
To learn more about this report, request a free sample copy
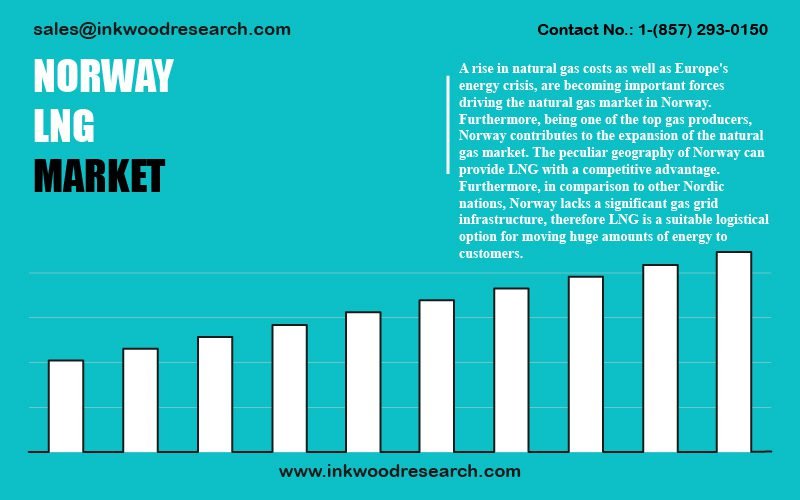
The rising natural gas costs and Europe’s energy crisis propel the natural gas market growth in Norway. It is one of the biggest gas producers in Europe, contributing to the expanding global natural gas market. As of 2020, the country’s total proven reserves are 1.40 trillion cubic meters.
Norway constitutes between 20% and 25% of Europe’s gas consumption. Almost all of the oil and gas produced is exported, together accounting for over half of the total value of Norwegian exports. As a result, these are the most significant export commodities in Norway’s economy. In 2020, primary energy consumption was increased by 8.43%.
The Norwegian gas pipeline network spans around 8 800 kilometers. Onshore facilities carry liquefied natural gas (LNG), oil, and wet gas to ships. In contrast, dry gas is carried to the United Kingdom and continental Europe.
The huge Snhvit LNG project began with the development of three gas fields, Albatross, Snøhvit, and Askeladd. These fields, found in the 1980s, are believed to have 193 Bm3 of natural gas reserves, 17.9 Bm3 of condensate reserves, and 5.1 metrics MMt of NGL reserves. The Albatross and Snøhvit fields became operational in 2007.
The peculiar geography of Norway provides a competitive advantage with regard to the LNG market. Given the LNG’s properties, it can be supplied and carried in huge quantities directly to customers in any part of the complex Norwegian landscape. Furthermore, compared to other Nordic nations, Norway lacks a significant gas grid infrastructure. Therefore, LNG is a suitable logistical option for moving huge amounts of energy to customers.
Since LNG is highly flammable and major exporting takes place by the sea, many regulations are to be followed by the industry players. Key regulatory authorities that govern the LNG industry in the country are the Ministry of Petroleum and Energy (MPE), the NPD, the Petroleum Safety Authority Norway (PSA), the Royal Norwegian Ministry of Labour and Social Affairs, the Ministry of Climate and Environment (Norway), the Norwegian Environment Agency, and the Ministry of Finance.
The top LNG companies in the country are Equinor ASA, Total E&P Norge AS, ExxonMobil, Shell, etc.
To request a free sample copy of this report, please complete the form below:
We offer 10% free customization including country-level data, niche applications and competitive landscape with every report.
- NORWAY LNG MARKET: EXECUTIVE SUMMARY
- NORWAY OVERALL ECONOMIC CONDITIONS
- NORWAY PRIMARY ENERGY CONSUMPTION
- NATURAL GAS
- NORWAY NATURAL GAS TOTAL PROVED RESERVES, PRODUCTION, AND CONSUMPTION
- TOTAL PROVED RESERVES
- NATURAL GAS PRODUCTION
- NATURAL GAS CONSUMPTION
- NORWAY NATURAL GAS TOTAL PROVED RESERVES, PRODUCTION, AND CONSUMPTION
- LIQUIFIED NATURAL GAS
- VALUE CHAIN ANALYSIS
- EXPLORATION AND PRODUCTION
- LIQUEFACTION
- SHIPPING
- STORAGE AND REGASIFICATION
- END-USERS
- TRADE
- EXPORTS
- LNG TERMINALS
- LIST OF LNG EXPORT TERMINALS
- REGULATORY FRAMEWORK FOR LNG
- VALUE CHAIN ANALYSIS
LIST OF TABLES
TABLE 1: NORWAY NATURAL GAS TOTAL PROVED RESERVES, 2000, 2010, AND 2020 (IN TRILLION CUBIC METERS)
TABLE 2: NORWAY NATURAL GAS PRODUCTION, 2016-2020 (IN EXAJOULES)
TABLE 3: NORWAY NATURAL GAS CONSUMPTION, 2016-2020 (IN EXAJOULES)
TABLE 4: NORWAY LNG EXPORTS, 2016-2020 (IN BILLION CUBIC METERS)
TABLE 5: LNG EXPORT TERMINALS, EXISTING
TABLE 6: REGULATORY FRAMEWORK
LIST OF FIGURES
FIGURE 1: NORWAY GROSS DOMESTIC PRODUCT, 2016-2020 ($ BILLION)
FIGURE 2: PRIMARY ENERGY CONSUMPTION, BY FUEL TYPES, 2019 & 2020 (IN %)
FIGURE 3: PRIMARY ENERGY CONSUMPTION, 2016-2020 (EXAJOULES)
FIGURE 4: NORWAY NATURAL GAS PRODUCTION VS CONSUMPTION, 2016-2020 (IN EXAJOULES)
FIGURE 5: VALUE CHAIN ANALYSIS
NORWAY GROSS DOMESTIC PRODUCT, 2016-2020, ($ BILLION)
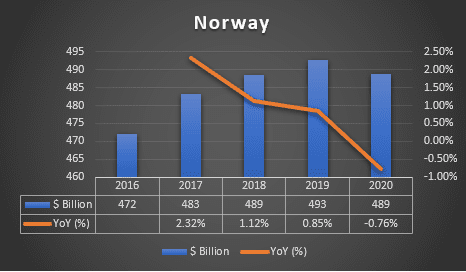
GDP (constant 2010 US$)
Source: World Bank
To request a free sample copy of this report, please complete the form below :
We offer 10% free customization including country-level data, niche applications and competitive landscape with every report.
RELATED REPORTS
-

UNITED STATES DATA CENTER ENERGY STORAGE MARKET FORECAST 2025-2032
-

INDIA DATA CENTER ENERGY STORAGE MARKET FORECAST 2025-2032
-

GERMANY DATA CENTER ENERGY STORAGE MARKET FORECAST 2025-2032
-

BRAZIL DATA CENTER ENERGY STORAGE MARKET FORECAST 2025-2032
-
GLOBAL DATA CENTER ENERGY STORAGE MARKET FORECAST 2025-2032
-

POLAND MOBILE IMAGING SERVICES MARKET FORECAST 2025-2032
-

UNITED STATES MOBILE IMAGING SERVICES MARKET FORECAST 2025-2032
-

INDIA MOBILE IMAGING SERVICES MARKET FORECAST 2025-2032
-

VIETNAM BABY DIAPER MARKET FORECAST 2025-2032
-

UNITED STATES BABY DIAPER MARKET FORECAST 2025-2032