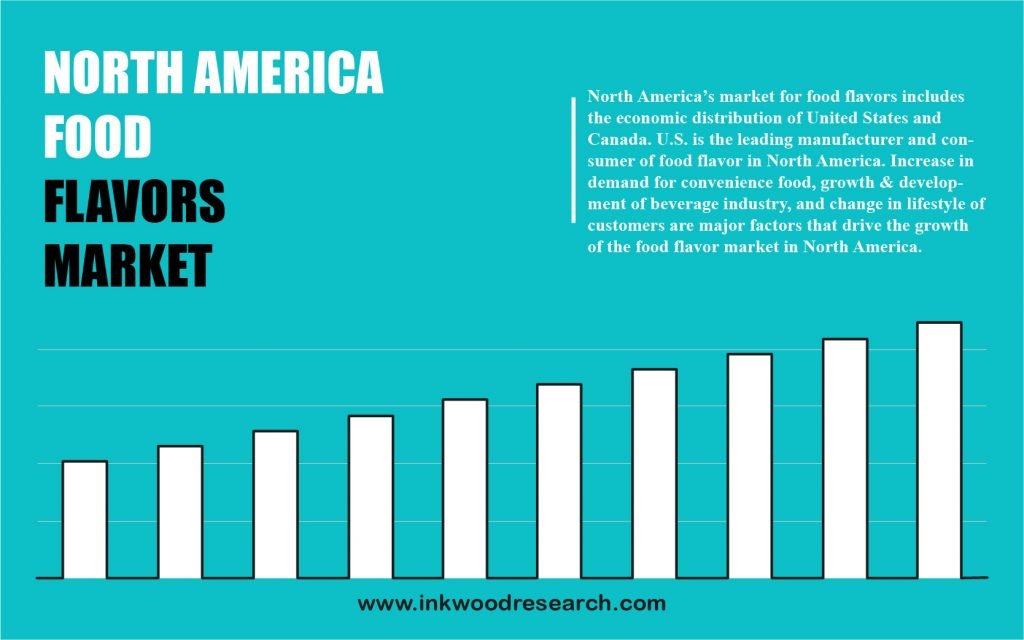
NORTH AMERICA FOOD FLAVORS MARKET FORECAST 2019-2028
North America Food Flavors Market by Type (Natural Flavors, Artificial Flavors) by End-user (Beverages(Hot Drinks, Soft Drinks, Alcoholic Drinks), Dairy & Frozen Products(Dairy Products, Frozen Products), Bakery & Confectionery(Bakery, Chocolate, Confectionery, Ice Cream), Savory & Snacks(Savory, Snacks), Animal & Pet Food(Animal Feed, Pet Food)) and by Geography.
The North America food flavors market is evaluated to grow with a CAGR of 3.56%, during the forecast years of 2019 to 2028. The region’s market growth is accredited to the surging demand for convenience food, consumer lifestyle changes, and the beverage industry’s development.

To know more about this report, request a free sample copy
The North America food flavors market growth is analyzed across the United States and Canada. The United States’ food flavor market is projected to depict stable growth, due to the rising demand for convenience food. Several factors have contributed to the increase in such food products, including the price, advertising, budget and time constraints, and demographic characteristics. Moreover, over 60% of the country’s diet comprises highly processed food that is disassembled and put back together again, through diverse combinations of salt, oil, sugar, and additives. For instance, most industrially-manufactured bread is the intricate and complex concoction of refined sugars, grains, dough conditioners, preservatives, and emulsifiers.
On the other hand, as per the Health and Human Services, the pursuit for convenience in the United States directs more customers towards away-from-home, quick-service, or restaurant meals, in addition to ready-to-eat meals, that can be easily prepared at home. Furthermore, the COVID-19 pandemic has considerably transitioned consumers’ lifestyles, inclining it towards consuming convenience foods, owing to strict lockdowns and restricted movements. Thus, such factors fuel the region’s food flavors market growth.
With its headquarters in the United States, Frutarom Industries Ltd, predominantly provides flavor and fine ingredients. The company manufactures, develops, and commercializes them for customers within the functional food, beverage, fragrance, flavor, nutraceutical, pharmaceutical, and cosmetic industries. In January 2019, IFF’s Frutarom division acquired 60% of the share capital of Mighty Co Ltd, a distinguished savory solutions provider in Thailand.
To request a free sample copy of this report, please complete the form below :
We offer 10% free customization including country-level data, niche applications and competitive landscape with every report.
- RESEARCH SCOPE & METHODOLOGY
- STUDY OBJECTIVES
- SCOPE OF STUDY
- METHODOLOGY
- ASSUMPTIONS & LIMITATIONS
- EXECUTIVE SUMMARY
- MARKET SIZE & ESTIMATES
- MARKET OVERVIEW
- MARKET DYNAMICS
- MARKET DEFINITION
- KEY DRIVERS
- INCREASING DEMAND FOR RTE MEAL AND FAST FOODS
- GROWING DEMAND FOR HEALTH PRODUCTS
- HIGH DEMAND FOR NATURAL FLAVORS
- KEY RESTRAINTS
- RISE IN SIDE EFFECTS OF ARTIFICIAL FLAVORS
- STERN GOVERNMENT REGULATIONS
- KEY ANALYTICS
- KEY INVESTMENT INSIGHTS
- PORTER’S FIVE FORCE ANALYSIS
- BUYER POWER
- SUPPLIER POWER
- SUBSTITUTION
- NEW ENTRANTS
- INDUSTRY RIVALRY
- OPPORTUNITY MATRIX
- VENDOR LANDSCAPE
- IMPACT OF COVID – FOOD FLAVORS
- MARKET BY TYPE
- NATURAL FLAVORS
- ARTIFICIAL FLAVORS
- MARKET BY END-USER
- BEVERAGES
- HOT DRINKS
- SOFT DRINKS
- ALCOHOLIC DRINKS
- DAIRY & FROZEN PRODUCTS
- DAIRY PRODUCTS
- FROZEN PRODUCTS
- BAKERY & CONFECTIONERY
- BAKERY
- CHOCOLATE
- CONFECTIONERY
- ICE CREAM
- SAVORY & SNACKS
- SAVORY
- SNACKS
- ANIMAL & PET FOOD
- ANIMAL FEED
- PET FOOD
- BEVERAGES
- GEOGRAPHICAL ANALYSIS
- NORTH AMERICA
- UNITED STATES
- CANADA
- NORTH AMERICA
- COMPANY PROFILES
- FIRMENICH SA
- FRUTAROM INDUSTRIES LTD
- GIVAUDAN INTERNATIONAL SA
- HUABAO INTERNATIONAL HOLDINGS LIMITED
- KERRY GROUP PLC
- ROBERTET SA
- S H KELKAR AND COMPANY LIMITED
- SENSIENT TECHNOLOGIES CORPORATION
- SYMRISE AG
- TAKASAGO INTERNATIONAL CORPORATION
- SYNERGY FLAVORS
- THE FOODIE FLAVOURS
- BESMOKE LTD
- CREATE FLAVORS
- AROMATA GROUP
TABLE LIST
TABLE 1: MARKET SNAPSHOT – FOOD FLAVORS
TABLE 2: NORTH AMERICA FOOD FLAVORS MARKET, BY TYPE, HISTORICAL YEARS, 2016-2019 (IN $ MILLION)
TABLE 3: NORTH AMERICA FOOD FLAVORS MARKET, BY TYPE, FORECAST YEARS, 2019-2028 (IN $ MILLION)
TABLE 4: NORTH AMERICA FOOD FLAVORS MARKET, BY END-USER, HISTORICAL YEARS, 2016-2019 (IN $ MILLION)
TABLE 5: NORTH AMERICA FOOD FLAVORS MARKET, BY END-USER, FORECAST YEARS, 2019-2028 (IN $ MILLION)
TABLE 6: NORTH AMERICA FOOD FLAVORS MARKET, BY COUNTRY, HISTORICAL YEARS, 2016-2019 (IN $ MILLION)
TABLE 7: NORTH AMERICA FOOD FLAVORS MARKET, BY COUNTRY, FORECAST YEARS, 2019-2028 (IN $ MILLION)
FIGURE LIST
FIGURE 1: KEY INVESTMENT INSIGHTS
FIGURE 2: PORTER’S FIVE FORCE ANALYSIS
FIGURE 3: OPPORTUNITY MATRIX
FIGURE 4: VENDOR LANDSCAPE
FIGURE 5: NORTH AMERICA FOOD FLAVORS MARKET, GROWTH POTENTIAL, BY TYPE, IN 2019
FIGURE 6: NORTH AMERICA FOOD FLAVORS MARKET, BY NATURAL, 2019-2028 (IN $ MILLION)
FIGURE 7: NORTH AMERICA FOOD FLAVORS MARKET, BY ARTIFICIAL FLAVORS, 2019-2028 (IN $ MILLION)
FIGURE 8: NORTH AMERICA FOOD FLAVORS MARKET, GROWTH POTENTIAL, BY END-USER, IN 2019
FIGURE 9: NORTH AMERICA FOOD FLAVORS MARKET, BY BEVERAGES, 2019-2028 (IN $ MILLION)
FIGURE 10: NORTH AMERICA FOOD FLAVORS MARKET, GROWTH POTENTIAL, BY BEVERAGES, IN 2019
FIGURE 11: NORTH AMERICA FOOD FLAVORS MARKET, BY HOT DRINKS, 2019-2028 (IN $ MILLION)
FIGURE 12: NORTH AMERICA FOOD FLAVORS MARKET, BY SOFT DRINKS, 2019-2028 (IN $ MILLION)
FIGURE 13: NORTH AMERICA FOOD FLAVORS MARKET, BY ALCOHOLIC DRINKS, 2019-2028 (IN $ MILLION)
FIGURE 14: NORTH AMERICA FOOD FLAVORS MARKET, BY DAIRY & FROZEN PRODUCTS, 2019-2028 (IN $ MILLION)
FIGURE 15: NORTH AMERICA FOOD FLAVORS MARKET, GROWTH POTENTIAL, BY DAIRY & FROZEN PRODUCTS, IN 2019
FIGURE 16: NORTH AMERICA FOOD FLAVORS MARKET, BY DAIRY PRODUCTS, 2019-2028 (IN $ MILLION)
FIGURE 17: NORTH AMERICA FOOD FLAVORS MARKET, BY FROZEN PRODUCTS, 2019-2028 (IN $ MILLION)
FIGURE 18: NORTH AMERICA FOOD FLAVORS MARKET, BY BAKERY & CONFECTIONERY, 2019-2028 (IN $ MILLION)
FIGURE 19: NORTH AMERICA FOOD FLAVORS MARKET, GROWTH POTENTIAL, BY BAKERY & CONFECTIONERY, IN 2019
FIGURE 20: NORTH AMERICA FOOD FLAVORS MARKET, BY BAKERY, 2019-2028 (IN $ MILLION)
FIGURE 21: NORTH AMERICA FOOD FLAVORS MARKET, BY CHOCOLATE, 2019-2028 (IN $ MILLION)
FIGURE 22: NORTH AMERICA FOOD FLAVORS MARKET, BY CONFECTIONERY, 2019-2028 (IN $ MILLION)
FIGURE 23: NORTH AMERICA FOOD FLAVORS MARKET, BY ICE CREAM, 2019-2028 (IN $ MILLION)
FIGURE 24: NORTH AMERICA FOOD FLAVORS MARKET, BY SAVORY & SNACKS, 2019-2028 (IN $ MILLION)
FIGURE 25: NORTH AMERICA FOOD FLAVORS MARKET, GROWTH POTENTIAL, BY SAVORY & SNACKS, IN 2019
FIGURE 26: NORTH AMERICA FOOD FLAVORS MARKET, BY SAVORY, 2019-2028 (IN $ MILLION)
FIGURE 27: NORTH AMERICA FOOD FLAVORS MARKET, BY SNACKS, 2019-2028 (IN $ MILLION)
FIGURE 28: NORTH AMERICA FOOD FLAVORS MARKET, BY ANIMAL & PET FOOD, 2019-2028 (IN $ MILLION)
FIGURE 29: NORTH AMERICA FOOD FLAVORS MARKET, GROWTH POTENTIAL, BY ANIMAL & PET FOOD, IN 2019
FIGURE 30: NORTH AMERICA FOOD FLAVORS MARKET, BY ANIMAL FEED, 2019-2028 (IN $ MILLION)
FIGURE 31: NORTH AMERICA FOOD FLAVORS MARKET, BY PET FOOD, 2019-2028 (IN $ MILLION)
FIGURE 32: NORTH AMERICA FOOD FLAVORS MARKET, REGIONAL OUTLOOK, 2019 & 2028 (IN %)
FIGURE 33: UNITED STATES FOOD FLAVORS MARKET, 2019-2028 (IN $ MILLION)
FIGURE 34: CANADA FOOD FLAVORS MARKET, 2019-2028 (IN $ MILLION)
- GEOGRAPHICAL ANALYSIS
- NORTH AMERICA
- UNITED STATES
- CANADA
- NORTH AMERICA
- MARKET BY TYPE
- NATURAL FLAVORS
- ARTIFICIAL FLAVORS
- MARKET BY END-USER
- BEVERAGES
- HOT DRINKS
- SOFT DRINKS
- ALCOHOLIC DRINKS
- DAIRY & FROZEN PRODUCTS
- DAIRY PRODUCTS
- FROZEN PRODUCTS
- BAKERY & CONFECTIONERY
- BAKERY
- CHOCOLATE
- CONFECTIONERY
- ICE CREAM
- SAVORY & SNACKS
- SAVORY
- SNACKS
- ANIMAL & PET FOOD
- ANIMAL FEED
- PET FOOD
- BEVERAGES
To request a free sample copy of this report, please complete the form below :
We offer 10% free customization including country-level data, niche applications and competitive landscape with every report.


