THE NETHERLANDS FLOATING POWER PLANT MARKET FORECAST 2024-2032
SCOPE OF THE REPORT
Netherlands Floating Power Plant Market by Source (Renewable Power Source, Non-renewable Power Source) Market by Capacity (0 MW – 5 MW, 5.1 MW – 20 MW, 20.1 MW – 100 MW, 100.1 MW – 250 MW, Above 250 MW)
REPORTS » ENERGY, POWER & UTILITIES » UTILITIES » THE NETHERLANDS FLOATING POWER PLANT MARKET FORECAST 2024-2032
MARKET OVERVIEW
The Netherlands floating power plant market is predicted to grow at a CAGR of 11.44% over the forecast period of 2024-2032. It is set to reach a revenue of $471.06 million by 2032.Â
The Netherlands floating power plant market is experiencing substantial growth fostered by an increase in renewable energy projects across the country. These projects are crucial in meeting sustainability goals and reducing carbon emissions, aligning with global efforts to combat climate change. The shift towards renewable energy sources like offshore wind reflects a growing commitment to clean energy solutions supported by favorable government policies and incentives.

To Know More About This Report, Request a Free Sample Copy
Concurrently, there has been a rising trend in offshore wind projects within the Netherlands. Offshore wind farms leverage the country’s strategic coastal location and strong wind resources to generate renewable electricity. This trend enhances energy security and stimulates economic growth through job creation and infrastructure development in coastal regions. The expansion of offshore wind capacity underscores the Netherlands proactive stance in advancing its renewable energy agenda.
Despite the growth in renewable energy, non-renewable sources continue to play a predominant role in the Netherlands floating power plant market. These sources, which include gas and other conventional fuels, provide reliable baseload power and complement intermittent renewable sources like wind and solar. The integration of both renewable and non-renewable energy sources ensures grid stability and resilience, which is crucial for meeting fluctuating energy demands across different seasons and weather conditions.
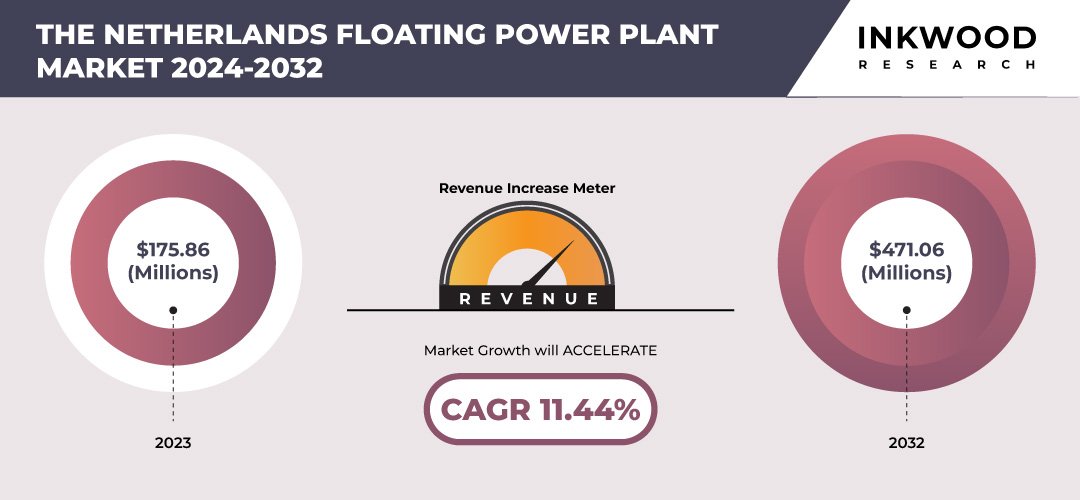
Netherlands Floating Power Plant Market : 11.44% CAGR (2024-2032)
Need a custom report or have specific data requirements? Let us know!
In terms of capacity, the segment ranging from 20.1 MW to 100 MW is experiencing rapid growth. This capacity range is optimal for balancing sizeable energy production with operational efficiency, catering to both local energy needs and export opportunities. The scalability and flexibility of these floating power plants make them versatile assets in the energy landscape, capable of adapting to evolving market conditions and technological advancements.
Furthermore, key drivers propelling the market include the surging demand for clean energy solutions. As global awareness of environmental sustainability grows, there is an increasing preference for renewable energy sources that minimize ecological impact and promote long-term energy security. Government investments in the energy industry further bolster market growth by providing financial incentives, regulatory support, and infrastructure development. These investments stimulate innovation and investment in renewable energy projects, reinforcing the Netherlands position as a leader in sustainable energy initiatives.
The Netherlands floating power plant market segmentation incorporates the market by source and capacity. The source segment is further segregated into renewable power source and non-renewable power source. Within the renewable power source sub-segment, the country has been actively expanding its capacity in offshore wind power. Offshore wind farms leverage the strong and consistent wind patterns over the North Sea, making them a reliable source of clean energy. The Dutch government has been supportive through various subsidies and incentives, driving substantial investments in offshore wind projects. This strategic focus on renewables aligns with the Netherlands ambitious targets for reducing greenhouse gas emissions and transitioning towards a sustainable energy future.
Additionally, non-renewable power source still plays a significant role in the Netherlands energy mix, particularly in floating power plants. Natural gas, in particular, remains a primary source due to its reliability and flexibility in meeting energy demands. The Netherlands has substantial natural gas reserves, and floating LNG (Liquefied Natural Gas) facilities contribute to the country’s energy security strategy. While there is a clear shift towards renewables, the integration of natural gas ensures a balanced approach to energy generation, supporting grid stability and minimizing dependency on imported energy sources.
In terms of technological advancements, both renewable and non-renewable floating power plants in the Netherlands are benefiting from innovations in energy storage and grid integration. Energy storage technologies, such as battery systems and hydrogen storage solutions, enhance the efficiency and reliability of renewable energy sources like offshore wind. These technologies enable better management of energy fluctuations and improve the integration of renewables into the national grid. Similarly, advancements in natural gas technologies, including efficient turbine designs and emissions reduction measures, contribute to the sustainability goals by minimizing environmental impacts while maintaining energy reliability.
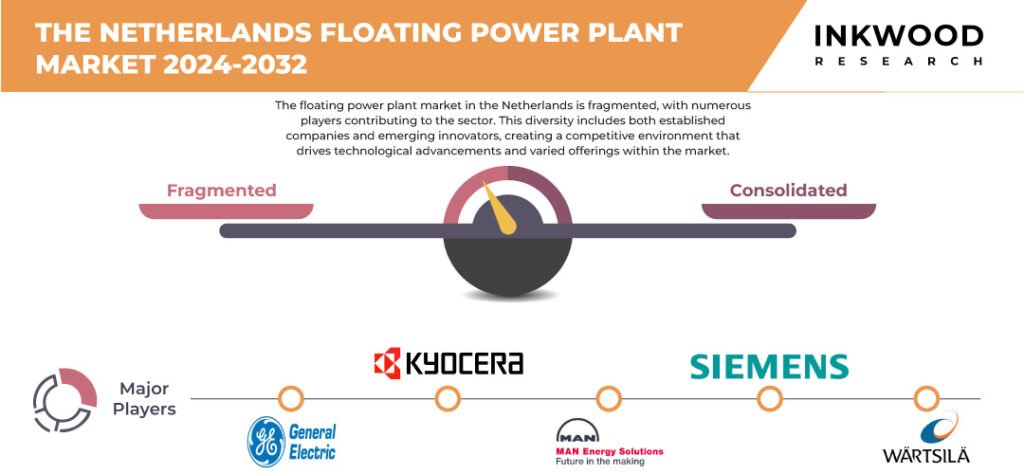
Some of the leading players in the Netherlands floating power plant market include Wartsila Corporation, General Electric, Mitsubishi Corporation, Siemens AG, etc.Â
Wartsila provides technologies and lifecycle solutions for the marine and energy sectors through its four business units: Wartsila Marine Power, Wartsila Marine Systems, Wartsila Voyage, and Wartsila Energy. The company, headquartered in Finland, maintains a global presence with a sales and service network spanning over 200 locations across 68 countries in Europe, North America, Asia-Pacific, Latin America, the Middle East & Africa.
REPORT SYNOPSIS
REPORT SCOPE | DETAILS |
---|---|
Market Forecast Years | 2024-2032 |
Base Year | 2023 |
Market Historical Years | 2018-2022 |
Forecast Units | Revenue ($ Million) |
Segments Analyzed | Source and Capacity |
Countries Analyzed | The Netherlands |
Companies Analyzed | KYOCERA Corporation, MAN Energy Solutions SE, General Electric, Mitsubishi Corporation, Siemens AG, Wartsila Corporation |
TABLE OF CONTENTS
RESEARCH SCOPE & METHODOLOGY
- STUDY OBJECTIVES
- METHODOLOGY
- ASSUMPTIONS & LIMITATIONS
EXECUTIVE SUMMARY
- MARKET SIZE & ESTIMATES
- COUNTRY SNAPSHOT
- COUNTRY ANALYSISÂ
- SCOPE OF STUDY
- CRISIS SCENARIO ANALYSIS
- IMPACT OF COVID-19 ON THE NETHERLANDS FLOATING POWER PLANT MARKET
- MAJOR MARKET FINDINGS
- GROWING NUMBER OF RENEWABLE ENERGY PROJECTSÂ
- RISE IN TREND FOR OFFSHORE WIND PROJECT
- NON-RENEWABLE ENERGY SOURCES ARE THE PREDOMINANT TYPE USED IN FLOATING POWER PLANTS
- CAPACITY RANGE OF 20.1 MW TO 100 MW IS EXPERIENCING THE FASTEST GROWTH
MARKET DYNAMICS
- KEY DRIVERS
- SURGING DEMAND FOR CLEAN ENERGY
- GOVERNMENT INVESTMENTS IN THE ENERGY INDUSTRY
- KEY RESTRAINTS
- HIGH PROJECT COSTS
- TECHNICAL CHALLENGES INVOLVED IN FLOATING POWER PLANTSÂ
- KEY DRIVERS
KEY ANALYTICS
- KEY MARKET TRENDS
- POPULARITY OF INTERNAL COMBUSTION (IC) ENGINE-BASED FLOATING POWER PLANTS
- RISE IN THE INSTALLATION OF NEW POWER PLANTS
- TECHNOLOGICAL ADVANCEMENTS AND INNOVATIONS
- PORTER’S FIVE FORCES ANALYSIS
- BUYERS POWER
- SUPPLIERS POWER
- SUBSTITUTION
- NEW ENTRANTS
- INDUSTRY RIVALRY
- GROWTH PROSPECT MAPPING
- GROWTH PROSPECT MAPPING FOR THE NETHERLANDS
- MARKET MATURITY ANALYSIS
- MARKET CONCENTRATION ANALYSIS
- VALUE CHAIN ANALYSIS
- RAW MATERIALS & COMPONENT SUPPLIERS
- ORIGINAL EQUIPMENT MANUFACTURERS (OEMS)
- ENGINEERING, PROCUREMENT, AND CONSTRUCTION (EPC) COMPANIES & DEVELOPERSÂ
- KEY BUYING CRITERIA
- TECHNOLOGICAL RELIABILITY AND EFFICIENCYÂ
- COST-EFFECTIVENESS
- EASE OF INSTALLATION AND DEPLOYMENT
- REPUTATION AND TRACK RECORD OF THE SUPPLIER OR MANUFACTURER
- KEY MARKET TRENDS
MARKET BY SOURCE
- RENEWABLE POWER SOURCE
- MARKET FORECAST FIGURE
- SEGMENT ANALYSIS
- NON-RENEWABLE POWER SOURCE
- MARKET FORECAST FIGURE
- SEGMENT ANALYSIS
- RENEWABLE POWER SOURCE
MARKET BY CAPACITY
- 0 MW – 5 MW
- MARKET FORECAST FIGURE
- SEGMENT ANALYSIS
- 5.1 MW – 20 MW
- MARKET FORECAST FIGURE
- SEGMENT ANALYSIS
- 20.1 MW – 100 MW
- MARKET FORECAST FIGURE
- SEGMENT ANALYSIS
- 100.1 MW – 250 MW
- MARKET FORECAST FIGURE
- SEGMENT ANALYSIS
- ABOVE 250 MW
- MARKET FORECAST FIGURE
- SEGMENT ANALYSIS
- 0 MW – 5 MW
COMPETITIVE LANDSCAPE
- KEY STRATEGIC DEVELOPMENTS
- MERGERS & ACQUISITIONS
- PRODUCT LAUNCHES & DEVELOPMENTS
- PARTNERSHIPS & AGREEMENTS
- BUSINESS EXPANSIONS & DIVESTITURES
- COMPANY PROFILES
- GENERAL ELECTRIC
- COMPANY OVERVIEW
- PRODUCTS LIST
- STRENGTHS & CHALLENGES
- KYOCERA CORPORATION
- COMPANY OVERVIEW
- PRODUCTS LIST
- STRENGTHS & CHALLENGES
- MAN ENERGY SOLUTIONS SE
- COMPANY OVERVIEW
- PRODUCTS LIST
- STRENGTHS & CHALLENGES
- MITSUBISHI CORPORATION
- COMPANY OVERVIEW
- PRODUCTS LIST
- STRENGTHS & CHALLENGES
- SIEMENS AG
- COMPANY OVERVIEW
- PRODUCTS LIST
- STRENGTHS & CHALLENGES
- WARTSILA CORPORATION
- COMPANY OVERVIEW
- PRODUCTS LIST
- STRENGTHS & CHALLENGES
- GENERAL ELECTRIC
- KEY STRATEGIC DEVELOPMENTS
LIST OF TABLES
TABLE 1: MARKET SNAPSHOT – FLOATING POWER PLANT
TABLE 2: THE NETHERLANDS FLOATING POWER PLANT MARKET, BY SOURCE, HISTORICAL YEARS, 2018-2022 (IN $ MILLION)
TABLE 3: THE NETHERLANDS FLOATING POWER PLANT MARKET, BY SOURCE, FORECAST YEARS, 2024-2032 (IN $ MILLION)
TABLE 4: THE NETHERLANDS FLOATING POWER PLANT MARKET, BY CAPACITY, HISTORICAL YEARS, 2018-2022 (IN $ MILLION)
TABLE 5: THE NETHERLANDS FLOATING POWER PLANT MARKET, BY CAPACITY, FORECAST YEARS, 2024-2032 (IN $ MILLION)
TABLE 6: LIST OF MERGERS & ACQUISITIONS
TABLE 7: LIST OF PRODUCT LAUNCHES & DEVELOPMENTS
TABLE 8: LIST OF PARTNERSHIPS & AGREEMENTS
TABLE 9: LIST OF BUSINESS EXPANSIONS & DIVESTITURES
LIST OF FIGURES
FIGURE 1: KEY MARKET TRENDS
FIGURE 2: PORTER’S FIVE FORCES ANALYSIS
FIGURE 3: GROWTH PROSPECT MAPPING FOR THE NETHERLANDS
FIGURE 4: MARKET MATURITY ANALYSIS
FIGURE 5: MARKET CONCENTRATION ANALYSIS
FIGURE 6: VALUE CHAIN ANALYSIS
FIGURE 7: KEY BUYING CRITERIA
FIGURE 8: THE NETHERLANDS FLOATING POWER PLANT MARKET, GROWTH POTENTIAL, BY SOURCE, IN 2023
FIGURE 9: THE NETHERLANDS FLOATING POWER PLANT MARKET, BY RENEWABLE POWER SOURCE, 2024-2032 (IN $ MILLION)
FIGURE 10: THE NETHERLANDS FLOATING POWER PLANT MARKET, BY NON-RENEWABLE POWER SOURCE, 2024-2032 (IN $ MILLION)
FIGURE 11: THE NETHERLANDS FLOATING POWER PLANT MARKET, GROWTH POTENTIAL, BY CAPACITY, IN 2023
FIGURE 12: THE NETHERLANDS FLOATING POWER PLANT MARKET, BY 0 MW – 5 MW, 2024-2032 (IN $ MILLION)
FIGURE 13: THE NETHERLANDS FLOATING POWER PLANT MARKET, BY 5.1 MW – 20 MW, 2024-2032 (IN $ MILLION)
FIGURE 14: THE NETHERLANDS FLOATING POWER PLANT MARKET, BY 20.1 MW – 100 MW, 2024-2032 (IN $ MILLION)
FIGURE 15: THE NETHERLANDS FLOATING POWER PLANT MARKET, BY 100.1 MW – 250 MW, 2024-2032 (IN $ MILLION)
FIGURE 16: THE NETHERLANDS FLOATING POWER PLANT MARKET, BY ABOVE 250 MW, 2024-2032 (IN $ MILLION)
FAQ’s
RELATED REPORTS
-
UNITED STATES DATA CENTER ENERGY STORAGE MARKET FORECAST 2025-2032
-
INDIA DATA CENTER ENERGY STORAGE MARKET FORECAST 2025-2032
-
GERMANY DATA CENTER ENERGY STORAGE MARKET FORECAST 2025-2032
-
BRAZIL DATA CENTER ENERGY STORAGE MARKET FORECAST 2025-2032
-
GLOBAL DATA CENTER ENERGY STORAGE MARKET FORECAST 2025-2032
-
POLAND MOBILE IMAGING SERVICES MARKET FORECAST 2025-2032
-
UNITED STATES MOBILE IMAGING SERVICES MARKET FORECAST 2025-2032
-
INDIA MOBILE IMAGING SERVICES MARKET FORECAST 2025-2032
-
VIETNAM BABY DIAPER MARKET FORECAST 2025-2032
-
UNITED STATES BABY DIAPER MARKET FORECAST 2025-2032