KENYA BIOCHAR MARKET FORECAST 2024-2032
SCOPE OF THE REPORT
Kenya Biochar Market by Technology (Slow Pyrolysis, Intermediate Pyrolysis, Hydrothermal Carbonization, Microwave Pyrolysis, Fast Pyrolysis, Gasification) Market by Feedstock (Forestry Waste, Biomass Plantation, Residential Waste, Agriculture Waste, Animal Manure) Market by Application (Agriculture and Livestock, Horticulture, Industries, Air, Soil, and Water Treatment)
REPORTS » AGRICULTURE » AGROCHEMICALS » KENYA BIOCHAR MARKET FORECAST 2024-2032
MARKET OVERVIEW
The Kenya biochar market is predicted to prosper at a CAGR of 17.09% over the forecast period of 2024-2032. It is set to reach a revenue of $142.06 million by 2032.Â
Kenya is emerging as a significant player in Africa’s biochar industry, propelled by its strong commitment to sustainable agriculture and environmental conservation. The nation’s focus on enhancing soil fertility, mitigating climate change through biochar carbon sequestration, and advancing renewable energy solutions reflects both its cultural values and forward-thinking environmental policies. With organizations such as the Kenya Forestry Research Institute (KEFRI) and various private enterprises spearheading innovations in biochar production, biochar solutions, and application, Kenya has positioned itself as a regional leader in this growing sector.
The Kenyan government has introduced legislation, such as the National Climate Change Action Plan and the Green Economy Strategy and Implementation Plan, to encourage sustainable practices and reduce environmental impact. These policies align with Kenya’s strategic efforts to boost biochar production and optimize the economic advantages of biochar products.

To Know More About This Report, Request a Free Sample Copy
Further, Kenya’s transition to a biochar-inclusive economy involves investing in biochar production facilities and encouraging its adoption among smallholder farmers. These initiatives aim to promote sustainable agriculture, boost crop yields, and crop residue management more efficiently. This approach not only minimizes waste but also improves soil health and enhances biochar carbon sequestration, contributing to greater market sustainability.
Innovative biochar production technologies are anticipated to boost Kenya’s market growth potential in the coming years. Key methods like thermal chemical processes, including pyrolysis, play a central role in thermally decomposing organic materials at high temperatures without oxygen. These processes provide several benefits, such as transforming agricultural waste into valuable biochar fertilizer, cutting greenhouse gas emissions, and aligning with Kenya’s stringent environmental standards.
Moreover, Kenya’s focus on developing a biochar-based economy, alongside technological advancements and supportive government policies, positions it as a key player in Africa’s biochar industry. This strategy not only fosters environmental sustainability but also drives economic growth and enhances food security, addressing the increasing demand for organic farming solutions.
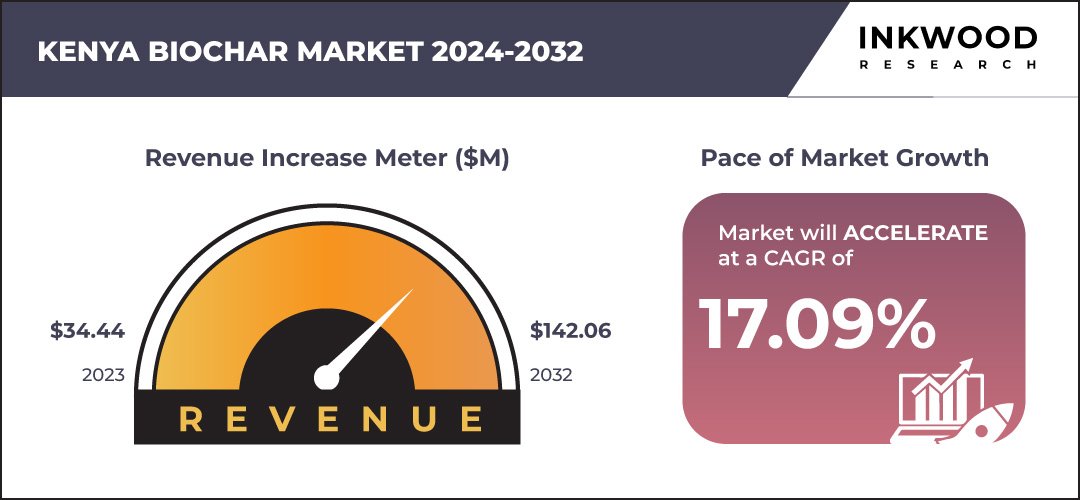
Kenya Biochar Market: CAGR 17.09% (2024-2032)
Need a custom report or have specific data requirements? Let us know!
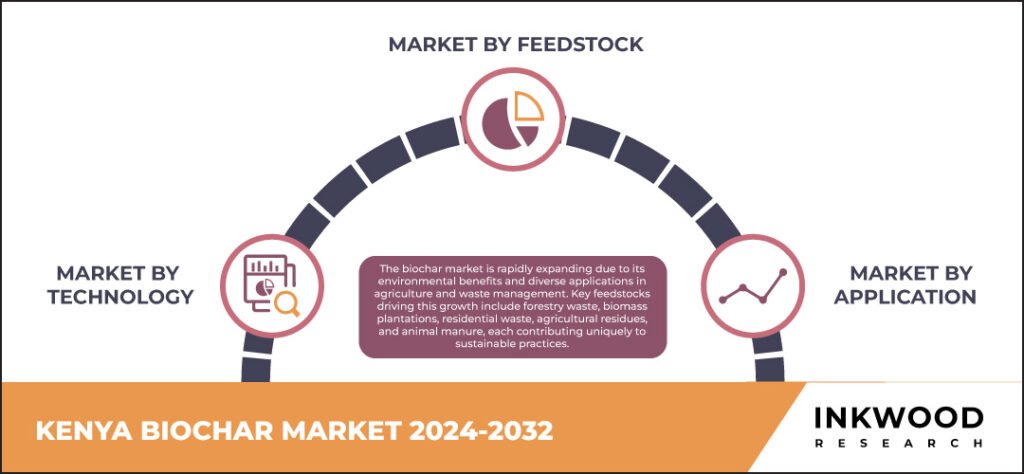
The Kenya biochar market segmentation includes the market by technology, feedstock, and application. The application segment is further differentiated into agriculture and livestock, horticulture, industries, and air, soil, and water treatment. Biochar’s carbon matrix can retain water, air, metals, and organic chemicals, making it highly effective for filtering toxic substances from air, water, and soil due to its strong sorption capacity. It binds heavy metals in the soil, preventing environmental harm, and the absorbed toxins can be safely disposed of, allowing the biochar to be recharged for reuse. As a soil enhancer, biochar improves fertility, boosts food security, preserves cropland diversity, and reduces the need for chemical fertilizers. It also enhances water quality by retaining nutrients and agrochemicals in the soil for plant use, thereby reducing pollution.
Primarily used in various industries, biochar’s low thermal conductivity and ability to absorb water up to six times its weight make it an ideal material for insulating buildings and regulating humidity. When mixed with clay, lime, or cement mortar at a ratio of up to 50%, biochar can be added to sand to create indoor plasters with excellent insulation and breathability. These plasters help maintain indoor humidity levels between 45-70% throughout the year, preventing both excessively dry air, which can cause respiratory issues and allergies, and dampness, which can lead to mold formation on external walls due to condensation.
In addition to its application in construction, biochar has a range of potential uses across various industries. It can be integrated into building materials, serve as a catalyst for chemical reactions, assist in controlling or storing gaseous emissions, and be utilized in fuel cell systems. Furthermore, biochar shows promise in the development of biochar-based supercapacitors, expanding its role in energy storage technologies.Â
Some of the leading players in the Kenya biochar market include PYREG GmbH, Seedballs Kenya, Cookswell Jikos, etc.Â
Seedballs Kenya is an innovative company focused on reforestation and sustainable agriculture, utilizing seed balls—clay balls infused with seeds designed for easy dispersal in various environments. Their approach aligns with biochar’s principles, as biochar can be integrated into seed balls to enhance soil fertility and improve water retention, promoting the growth of indigenous trees and crops. Headquartered in Nairobi, Kenya, Seedballs Kenya is dedicated to combating deforestation and enhancing food security while empowering local communities through environmentally sustainable practices. Their efforts contribute to both ecological restoration and the promotion of biochar as a valuable tool for sustainable land management.
REPORT SYNOPSIS
REPORT SCOPE | DETAILS |
---|---|
Market Forecast Years | 2024-2032 |
Base Year | 2023 |
Market Historical Years | 2018-2022 |
Forecast Units | Revenue ($ Million) |
Segments Analyzed | Technology, Feedstock, and Application |
Countries Analyzed | Kenya |
Companies Analyzed | BIOSORRA, Bio-Logical, Kenya Nut Company, PYREG GmbH, Seedballs Kenya, Cookswell Jikos |
TABLE OF CONTENTS
-
RESEARCH SCOPE & METHODOLOGY
- STUDY OBJECTIVES
- METHODOLOGY
- ASSUMPTIONS & LIMITATIONS
-
EXECUTIVE SUMMARY
- MARKET SIZE & ESTIMATES
- MARKET OVERVIEW
- SCOPE OF STUDY
- MAJOR MARKET FINDINGS
- BIOCHAR IMPROVES SOIL WITH ENHANCED WATER RETENTION AND NUTRIENT AVAILABILITY
- LIFE CYCLE ASSESSMENTS HIGHLIGHT EMISSION REDUCTION POTENTIAL, REQUIRING SCRUTINY OF FEEDSTOCK TRANSPORT AND ENERGY SOURCES
- META-ANALYSES SUGGEST 10-20% CROP YIELD BOOSTS FROM BIOCHAR, EMPHASIZING THE NEED FOR CONTROLLED TESTING IN DIVERSE ENVIRONMENTS
-
MARKET DYNAMICS
- KEY DRIVERS
- GROWING EMPHASIS ON CARBON SEQUESTRATION CAPABILITIES
- ABILITY TO UTILIZE SEVERAL SUSTAINABLE BIOMASS FEEDSTOCKS
- IMPROVING SOIL PRODUCTIVITY AND CROP YIELDS
- NUTRIENT RETENTION PROPERTIES AS A SOIL AMENDMENT
- POTENTIAL WASTE MANAGEMENT AND CIRCULAR ECONOMY SOLUTION
- KEY RESTRAINTS
- HIGH UPFRONT CAPITAL INVESTMENT REQUIREMENTS
- UNCERTAINTY ABOUT OPTIMAL PRODUCTION SYSTEMS AND TECHNIQUES
- LACK OF LONG-TERM FIELD STUDY QUANTIFYING BENEFITS
- VARIABILITY IN FEEDSTOCK AND BIOCHAR PROPERTIES
- KEY DRIVERS
-
KEY ANALYTICS
- KEY MARKET TRENDS
- TAILORING LOCALIZED BIOCHAR SOLUTIONS FOR REGIONAL FEEDSTOCKS AND SOILS
- EXPANDING CARBON CREDIT ELIGIBILITY AND POLICY INCENTIVE PROGRAMS
- ONGOING FIELD TESTING AND IMPACT MONITORING PARTNERSHIPS
- EXPLORING VALUE FOR DIVERSE AMENDMENT APPLICATIONS BEYOND AGRICULTURE
- INTEGRATING WITH WASTE BIOMASS STREAMS FROM OTHER PROCESSES
- PORTER’S FIVE FORCES ANALYSIS
- BUYERS POWER
- SUPPLIERS POWER
- SUBSTITUTION
- NEW ENTRANTS
- INDUSTRY RIVALRY
- GROWTH PROSPECT MAPPING
- GROWTH PROSPECT MAPPING FOR KENYA
- MARKET MATURITY ANALYSIS
- MARKET CONCENTRATION ANALYSIS
- VALUE CHAIN ANALYSIS
- RAW MATERIALSÂ
- MANUFACTURERS
- DISTRIBUTORS AND RETAILERS
- END-USERS
- KEY BUYING CRITERIA
- PRICE
- WATER AND ASH CONTENT
- BULK DENSITY AND ABSORPTION CAPACITY
- KENYA BIOCHAR MARKET REGULATORY FRAMEWORK
- KEY MARKET TRENDS
-
MARKET BY TECHNOLOGY
- SLOW PYROLYSIS
- MARKET FORECAST FIGURE
- SEGMENT ANALYSIS
- INTERMEDIATE PYROLYSIS
- MARKET FORECAST FIGURE
- SEGMENT ANALYSIS
- HYDROTHERMAL CARBONIZATION
- MARKET FORECAST FIGURE
- SEGMENT ANALYSIS
- MICROWAVE PYROLYSIS
- MARKET FORECAST FIGURE
- SEGMENT ANALYSIS
- FAST PYROLYSIS
- MARKET FORECAST FIGURE
- SEGMENT ANALYSIS
- GASIFICATION
- MARKET FORECAST FIGURE
- SEGMENT ANALYSIS
- SLOW PYROLYSIS
-
MARKET BY FEEDSTOCK
- FORESTRY WASTE
- MARKET FORECAST FIGURE
- SEGMENT ANALYSIS
- BIOMASS PLANTATIONÂ
- MARKET FORECAST FIGURE
- SEGMENT ANALYSIS
- RESIDENTIAL WASTEÂ
- MARKET FORECAST FIGURE
- SEGMENT ANALYSIS
- AGRICULTURE WASTE
- MARKET FORECAST FIGURE
- SEGMENT ANALYSIS
- ANIMAL MANUREÂ
- MARKET FORECAST FIGURE
- SEGMENT ANALYSIS
- FORESTRY WASTE
-
MARKET BY APPLICATION
- AGRICULTURE AND LIVESTOCK
- MARKET FORECAST FIGURE
- SEGMENT ANALYSIS
- HORTICULTURE
- MARKET FORECAST FIGURE
- SEGMENT ANALYSIS
- INDUSTRIES
- MARKET FORECAST FIGURE
- SEGMENT ANALYSIS
- AIR, SOIL, AND WATER TREATMENT
- MARKET FORECAST FIGURE
- SEGMENT ANALYSIS
- AGRICULTURE AND LIVESTOCK
-
COMPETITIVE LANDSCAPE
- KEY STRATEGIC DEVELOPMENTS
- MERGERS & ACQUISITIONS
- PRODUCT LAUNCHES & DEVELOPMENTS
- PARTNERSHIPS & AGREEMENTS
- BUSINESS EXPANSIONS & DIVESTITURES
- COMPANY PROFILES
- BIOSORRA
- COMPANY OVERVIEW
- PRODUCT LIST
- STRENGTHS & CHALLENGES
- BIO-LOGICAL
- COMPANY OVERVIEW
- PRODUCT LIST
- STRENGTHS & CHALLENGES
- KENYA NUT COMPANY
- COMPANY OVERVIEW
- PRODUCT LIST
- STRENGTHS & CHALLENGES
- PYREG GMBH
- COMPANY OVERVIEW
- PRODUCT LIST
- STRENGTHS & CHALLENGES
- SEEDBALLS KENYAÂ
- COMPANY OVERVIEW
- PRODUCT LIST
- STRENGTHS & CHALLENGES
- COOKSWELL JIKOS
- COMPANY OVERVIEW
- PRODUCT LIST
- STRENGTHS & CHALLENGES
- BIOSORRA
- KEY STRATEGIC DEVELOPMENTS
LIST OF TABLES
TABLE 1: MARKET SNAPSHOT – BIOCHARÂ
TABLE 2: KENYA BIOCHAR MARKET REGULATORY FRAMEWORK
TABLE 3: KENYA BIOCHAR MARKET, BY TECHNOLOGY, HISTORICAL YEARS, 2018-2022 (IN $ MILLION)
TABLE 4: KENYA BIOCHAR MARKET, BY TECHNOLOGY, FORECAST YEARS, 2024-2032 (IN $ MILLION)
TABLE 5: KENYA BIOCHAR MARKET, BY FEEDSTOCK, HISTORICAL YEARS, 2018-2022 (IN $ MILLION)
TABLE 6: KENYA BIOCHAR MARKET, BY FEEDSTOCK, FORECAST YEARS, 2024-2032 (IN $ MILLION)
TABLE 7: KENYA BIOCHAR MARKET, BY APPLICATION, HISTORICAL YEARS, 2018-2022 (IN $ MILLION)
TABLE 8: KENYA BIOCHAR MARKET, BY APPLICATION, FORECAST YEARS, 2024-2032 (IN $ MILLION)
TABLE 9: LIST OF MERGERS & ACQUISITIONS
TABLE 10: LIST OF PRODUCT LAUNCHES & DEVELOPMENTS
TABLE 11: LIST OF PARTNERSHIPS & AGREEMENTS
TABLE 12: LIST OF BUSINESS EXPANSIONS & DIVESTITURES
LIST OF FIGURES
FIGURE 1: KEY MARKET TRENDS
FIGURE 2: PORTER’S FIVE FORCES ANALYSIS
FIGURE 3: GROWTH PROSPECT MAPPING FOR KENYA
FIGURE 4: MARKET MATURITY ANALYSIS
FIGURE 5: MARKET CONCENTRATION ANALYSIS
FIGURE 6: VALUE CHAIN ANALYSIS
FIGURE 7: KEY BUYING CRITERIA
FIGURE 8: KENYA BIOCHAR MARKET, GROWTH POTENTIAL, BY TECHNOLOGY, IN 2023
FIGURE 9: KENYA BIOCHAR MARKET, BY SLOW PYROLYSIS, 2024-2032 (IN $ MILLION)
FIGURE 10: KENYA BIOCHAR MARKET, BY INTERMEDIATE PYROLYSIS, 2024-2032 (IN $ MILLION)
FIGURE 11: KENYA BIOCHAR MARKET, BY HYDROTHERMAL CARBONIZATION, 2024-2032 (IN $ MILLION)
FIGURE 12: KENYA BIOCHAR MARKET, BY MICROWAVE PYROLYSIS, 2024-2032 (IN $ MILLION)
FIGURE 13: KENYA BIOCHAR MARKET, BY FAST PYROLYSIS, 2024-2032 (IN $ MILLION)
FIGURE 14: KENYA BIOCHAR MARKET, BY GASIFICATION, 2024-2032 (IN $ MILLION)
FIGURE 15: KENYA BIOCHAR MARKET, GROWTH POTENTIAL, BY FEEDSTOCK, IN 2023
FIGURE 16: KENYA BIOCHAR MARKET, BY FORESTRY WASTE, 2024-2032 (IN $ MILLION)
FIGURE 17: KENYA BIOCHAR MARKET, BY BIOMASS PLANTATION, 2024-2032 (IN $ MILLION)
FIGURE 18: KENYA BIOCHAR MARKET, BY RESIDENTIAL WASTE, 2024-2032 (IN $ MILLION)
FIGURE 19: KENYA BIOCHAR MARKET, BY AGRICULTURE WASTE, 2024-2032 (IN $ MILLION)
FIGURE 20: KENYA BIOCHAR MARKET, BY ANIMAL MANURE, 2024-2032 (IN $ MILLION)
FIGURE 21: KENYA BIOCHAR MARKET, GROWTH POTENTIAL, BY APPLICATION, IN 2023
FIGURE 22: KENYA BIOCHAR MARKET, BY AGRICULTURE AND LIVESTOCK, 2024-2032 (IN $ MILLION)
FIGURE 23: KENYA BIOCHAR MARKET, BY HORTICULTURE, 2024-2032 (IN $ MILLION)
FIGURE 24: KENYA BIOCHAR MARKET, BY INDUSTRIES, 2024-2032 (IN $ MILLION)
FIGURE 25: KENYA BIOCHAR MARKET, BY AIR, SOIL, AND WATER TREATMENT, 2024-2032 (IN $ MILLION)
FAQ’s
RELATED REPORTS
-
UNITED STATES DATA CENTER ENERGY STORAGE MARKET FORECAST 2025-2032
-
INDIA DATA CENTER ENERGY STORAGE MARKET FORECAST 2025-2032
-
GERMANY DATA CENTER ENERGY STORAGE MARKET FORECAST 2025-2032
-
BRAZIL DATA CENTER ENERGY STORAGE MARKET FORECAST 2025-2032
-
POLAND MOBILE IMAGING SERVICES MARKET FORECAST 2025-2032
-
UNITED STATES MOBILE IMAGING SERVICES MARKET FORECAST 2025-2032
-
INDIA MOBILE IMAGING SERVICES MARKET FORECAST 2025-2032
-
VIETNAM BABY DIAPER MARKET FORECAST 2025-2032
-
UNITED STATES BABY DIAPER MARKET FORECAST 2025-2032
-
THAILAND BABY DIAPER MARKET FORECAST 2025-2032