

GLOBAL SMART SOLAR MARKET FORECAST 2018-2026
Global Smart Solar Market by Application (Commercial and Industrial, Domestic) by Device and Services (by Device, by Services) by Industry Sector(Utilities, Government, Construction, Agriculture, Healthcare, Education) by Solution (Supervisory Control and Data Acquisition, Network Monitoring, Analytics, Remote Metering, Meter Data Management, Asset Management, Outage Management) & by Geography
The global smart solar market is estimated to grow with approx.16.45% CAGR between the years 2018 – 2026. The base year considered for the study is 2017 and the forecast period is 2018-2026. The global Smart solar market is primarily driven by the following factors:
- Swift increase in solar energy utilization
- Increasing electricity charges
- Adoption of green & smart cities concept
- Regulatory compliance
- China’s solar power capacity more than double in 2016
To learn more about this report, request a free sample copy
The important driver increasing growth in the global smart solar market is the adoption of green & smart cities concept. The concept of smart cities is gaining popularity amongst various global governments, and the basic need is to optimize the use of the resources. Smart cities utilize information and communication technology (ICT) and the internet in every aspect of development such as smart grids, smart buildings, smart lightings, home automation and so on. The implication of smart solar in cities will include sensors embedded in physical objects, home automation appliances such as smart lights, thermostats and so on. This will ensure better waste management, better traffic control and better use of renewable resources.
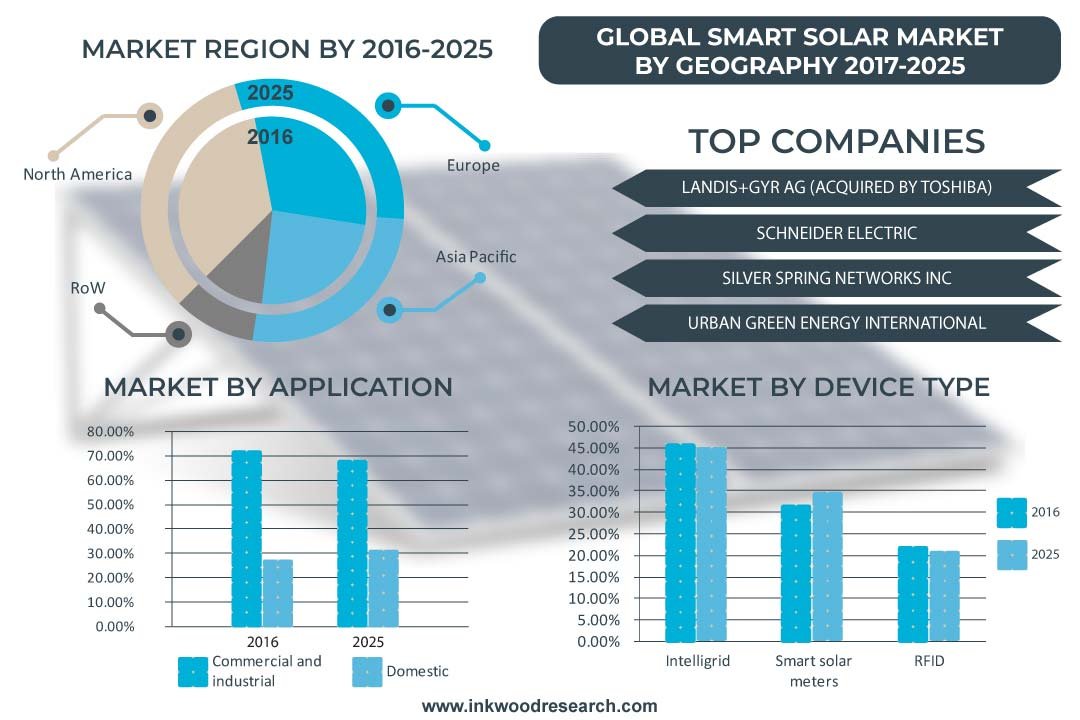
The commercial and industrial application is anticipated to govern the smart solar market. The increasing demand for energy in various industries became one of the major factors for the growth of the smart solar market. To fulfill the electricity demand of various industries and to reduce the operating cost, many factories have started to adopt solar plants. In the USA, commercial sector consumes more than 36% of the total electricity production. Similarly, the industrial sector consumes more than 26% of the total electricity production. This increasing demand for electricity in the commercial and industrial sector has increased the demand for smart solar products in commercial and industrial application. The domestic application is the second-largest application for the smart solar market. The increasing population and economy of various countries have pushed the demand for electricity in domestic use. In addition to this, the rising government investment for smart cities and smart homes also became one of the major drivers for the growth of the smart solar market in a domestic application.
The high cost of installation and reduction in subsidies are the major factors hindering the smart solar market. The solar power industry is increasingly gaining prominence with each passing day. Despite this, there are several concerns with a solar power plant setup. One such concern is the high installation cost as a lot of things are used in the installation of the solar plant ex: photovoltaic modules, land civil and general work, mounting structure, cables and transformer, etc. Central Electricity Regulatory Commission (CERC), India recently declared the standard tariff for setup of thermal plants and solar PV in India. These standard tariff regulations provide the benchmark capital cost norm for thermal power and solar power projects.
The global smart solar market segments include applications, industrial sector, device type and services, and solutions.
Applications are segmented into:
- Commercial and Industrial
- Domestic
Industrial Sector is segmented into:
- Utilities
- Government
- Construction
- Agriculture
- Healthcare
- Education
- Others
Device type includes:
- Intelligrid
- Smart Solar Meters
- RFID
Services include:
- System Integration And Deployment Services
- Support And Maintenance Services
- Consulting Services
- Demand Response Services
Solutions are segmented into:
- Supervisory Control And Data Acquisition
- Network Monitoring
- Analytics
- Remote Metering
- Meter Data Management
- Asset Management
- Outage Management
The report scope is widely categorized on the basis of its application which includes commercial, industrial and domestic. Moreover, the market revenue estimates and forecast includes only smart solar systems and excludes the conventional energy systems.
Geographically, the global smart solar market has been segmented on the basis of four major regions, which includes:
- Smart Solar North America Market – U.S. & Canada
- Smart Solar Asia Pacific Market– China, India, Japan, South Korea, Australia, RoAPAC
- Smart Solar Europe Market– UK, France, Germany, Spain, Italy, RoE
- Rest of World – Latin America, MEA and Africa
North America is anticipated to account for the largest market share of the global smart solar market. The growth in the North American smart solar market is mainly driven by the presence of the key market players such as SolarCity, Trilliant, etc. All these companies are involved in the continuous development of the new technology which is uplifting the growth in the North American market. The rising utilization of solar energy is one of the major factors which is driving growth in the North America smart solar market. The US held the largest market share in terms of revenue in 2016 and is a major growth influencer of the North America smart solar market. The rising consumption of the solar energy is a key force which is boosting the growth in the US market. On the other hand, the Asia-Pacific market is anticipated to the fastest-growing region in the global smart solar market. Growth in the Asia Pacific smart solar market is mainly influenced by rising government support for the use of solar energy and an increase in electricity tariffs in the region. Positive economic outlook has driven government and public bodies across the Asia Pacific to implement investment-friendly policies. This has resulted in the growth of end user industry of the smart solar market.
The Smart solar market is segmented based on applications which are sub-divided into commercial, industrial and domestic. The market is also segmented on the basis of industry sectors which are sub-divided into utilities, government, construction, agriculture, healthcare, education and others. Device types include intelligrid, smart solar meters and RFID. The service segment is divided into system integration and deployment services, support and maintenance services, consulting services, and demand response services. Solutions include supervisory control and data management, network monitoring, analytics, remote metering, meter data management, asset management, and outage management.
The major market players in the global smart solar market are:
- Solarcity
- Abb
- Itron Inc
- Vivint Solar
- Landis+Gyr Ag
- Others
Company Profiles covers analysis of important players
These companies are using organic and inorganic strategies for growth. For instance, in September 2017, ABB announced the acquisition of GE industrial solution, a company which has a strong customer base in more than 100 countries. In February 2016, Itron, one of the leader in technology and services, dedicated to the resourceful use of water and energy and launched Itron Idea Labs. It is an organization within Itron which is dedicated to developing new business opportunities in high-growth industries and the emerging market of smart solar.
Key findings of the global smart solar market.
- Swift increase in solar energy utilization and adoption of green & smart cities concept is fueling growth in the global smart solar market.
- North America accounted for the largest revenue share in 2017.
- The commercial and industrial segment is dominating the market due to the growing adoption of smart solar systems
- Increasing government support
- Product launch is the key strategy adopted by various market players of the global smart solar market.
- Supervisory control and data acquisition segment is a major solution segment.
- RESEARCH SCOPE
- STUDY GOALS
- SCOPE OF THE MARKET STUDY
- WHO WILL FIND THIS REPORT USEFUL?
- STUDY AND FORECASTING YEARS
- RESEARCH METHODOLOGY
- SOURCES OF DATA
- SECONDARY DATA
- PRIMARY DATA
- TOP DOWN APPROACH
- BOTTOM-UP APPROACH
- DATA TRIANGULATION
- ESTIMATION METHODOLOGY
- SOURCES OF DATA
- EXECUTIVE SUMMARY
- MARKET SUMMARY
- KEY FINDINGS
- NORTH AMERICA DOMINATES THE SMART SOLAR MARKET
- ASIA PACIFIC IS EXPECTED TO BE THE MOST PROMISING MARKET
- QUICK DEPLOYMENT OF SMART GRIDS
- UTILITIES SEGMENT HOLDS MAJOR CHUNK OF THE MARKET BY INDUSTRIAL SECTOR
- SMART SOLAR FINDS ITS MAJOR APPLICATION IN COMMERCIAL AND INDUSTRIAL SEGMENT
- MARKET DYNAMICS
- MARKET DEFINITION
- DRIVERS
- SWIFT INCREASE IN SOLAR ENERGY UTILIZATION
- INCREASING ELECTRICITY CHARGES
- ADOPTION OF GREEN & SMART CITIES CONCEPT
- REGULATORY COMPLIANCE
- CHINA’S SOLAR POWER CAPACITY MORE THAN DOUBLE IN 2016
- RESTRAINTS
- HIGH COST OF INSTALLATION
- REDUCTION IN SUBSIDIES
- OPPORTUNITIES
- RISING ENVIRONMENTAL AWARENESS AND TECHNOLOGICAL EVOLUTION
- NEED FOR ENERGY MANAGEMENT
- CHALLENGES
- LOW RETURN ON INVESTMENT (ROI) IN THE INITIAL PERIOD
- INSTABILITY AND INEFFICIENCY
- MARKET BY APPLICATION
- COMMERCIAL AND INDUSTRIAL
- DOMESTIC
- MARKET BY INDUSTRIAL SECTOR
- UTILITIES
- GOVERNMENT
- CONSTRUCTION
- AGRICULTURE
- HEALTHCARE
- EDUCATION
- OTHERS
- MARKET BY DEVICE TYPE AND SERVICES
- MARKET BY DEVICE TYPE
- INTELLIGRID
- SMART SOLAR METERS
- RFID
- MARKET BY SERVICES
- SYSTEM INTEGRATION AND DEPLOYMENT SERVICES
- SUPPORT AND MAINTENANCE SERVICES
- CONSULTING SERVICES
- DEMAND RESPONSE SERVICES
- MARKET BY DEVICE TYPE
- MARKET BY SOLUTION
- SUPERVISORY CONTROL AND DATA ACQUISITION
- NETWORK MONITORING
- ANALYTICS
- REMOTE METERING
- METER DATA MANAGEMENT
- ASSET MANAGEMENT
- OUTAGE MANAGEMENT
- KEY ANALYTICS
- PORTERS 5 FORCE ANALYSIS
- THREAT OF NEW ENTRANTS
- THREAT OF SUBSTITUTE PRODUCTS OR SERVICES
- BARGAINING POWER OF BUYERS
- BARGAINING POWER OF SUPPLIERS
- INTENSITY OF COMPETITIVE RIVALRY
- VALUE CHAIN ANALYSIS
- RAW MATERIAL SUPPLIERS
- MANUFACTURERS
- RETAILERS/DISTRIBUTORS
- END-USER
- KEY BUYING CRITERIA
- COST
- EFFICIENCY
- TECHNOLOGY
- APPLICATION & EFFECTIVENESS
- REGULATORY FRAMEWORK
- INVESTMENT OUTLOOK
- REGIONAL OUTLOOK
- VENDOR LANDSCAPE
- OPPORTUNITY MATRIX
- PORTERS 5 FORCE ANALYSIS
- GEOGRAPHICAL ANALYSIS
- NORTH AMERICA
- UNITED STATES
- CANADA
- EUROPE
- UNITED KINGDOM
- FRANCE
- GERMANY
- SPAIN
- ITALY
- ROE
- ASIA PACIFIC
- INDIA
- CHINA
- JAPAN
- SOUTH KOREA
- AUSTRALIA
- ROAPAC
- REST OF WORLD
- LATIN AMERICA
- MENA
- AFRICA
- NORTH AMERICA
- COMPETITIVE LANDSCAPE
- MARKET SHARE ANALYSIS
- SOLARCITY (TESLA MOTORS, INC.)
- ABB
- ITRON INC.
- VIVINT SOLAR
- LANDIS+GYR AG (ACQUIRED BY TOSHIBA)
- TOP WINNING STRATEGIES
- COMPANY PROFILES
- ABB
- OVERVIEW
- PRODUCT PORTFOLIO
- STRATEGIC INITIATIVE
- SCOT ANALYSIS
- STRATEGIC ANALYSIS
- ECHELON
- OVERVIEW
- PRODUCT PORTFOLIO
- SCOT ANALYSIS
- STRATEGIC ANALYSIS
- FIRST SOLAR
- OVERVIEW
- PRODUCT PORTFOLIO
- STRATEGIC INITIATIVE
- SCOT ANALYSIS
- STRATEGIC ANALYSIS
- GE POWER
- OVERVIEW
- PRODUCT PORTFOLIO
- STRATEGIC INITIATIVES-
- SCOT ANALYSIS
- STRATEGIC ANALYSIS
- ITRON INC.
- OVERVIEW
- PRODUCT PORTFOLIO
- STRATEGIC INITIATIVE
- SCOT ANALYSIS
- STRATEGIC ANALYSIS
- LANDIS+GYR AG (ACQUIRED BY TOSHIBA)
- OVERVIEW
- PRODUCTS PORTFOLIO
- STRATEGIC INITIATIVES
- SCOT ANALYSIS
- STRATEGIC ANALYSIS
- SCHNEIDER ELECTRIC
- OVERVIEW
- PRODUCT PORTFOLIO
- STRATEGIC INITIATIVE
- SCOT ANALYSIS
- STRATEGIC ANALYSIS
- SENSUS USA, INC. (ACQUIRED BY XYLEM INC.)
- OVERVIEW
- PRODUCT PORTFOLIO
- STRATEGIC INITIATIVE
- SCOT ANALYSIS
- STRATEGIC ANALYSIS
- SIEMENS
- OVERVIEW
- PRODUCT PORTFOLIO
- STRATEGIC INITIATIVE
- SCOT ANALYSIS
- STRATEGIC ANALYSIS
- SILVER SPRING NETWORKS INC.
- OVERVIEW
- PRODUCT PORTFOLIO
- STRATEGIC INITIATIVE
- SCOT ANALYSIS
- STRATEGIC ANALYSIS
- SOLARCITY (TESLA MOTORS, INC)
- OVERVIEW
- PRODUCT PORTFOLIO
- STRATEGIC INITIATIVE
- SCOT ANALYSIS
- STRATEGIC ANALYSIS
- SUNPOWER
- OVERVIEW
- PRODUCT PORTFOLIO
- STRATEGIC INITIATIVES
- SCOT ANALYSIS
- STRATEGIC ANALYSIS
- SUNNOVA
- OVERVIEW
- PRODUCT PORTFOLIO
- STRATEGIC INITIATIVES
- SCOT ANALYSIS
- STRATEGIC ANALYSIS
- URBAN GREEN ENERGY (UGE) INTERNATIONAL
- OVERVIEW
- PRODUCT PORTFOLIO
- STRATEGIC INITIATIVE
- SCOT ANALYSIS
- STRATEGIC ANALYSIS
- VIVINT SOLAR
- OVERVIEW
- PRODUCT PORTFOLIO
- STRATEGIC INITIATIVE
- SCOT ANALYSIS
- STRATEGIC ANALYSIS
- ABB
- MARKET SHARE ANALYSIS
LIST OF TABLES
TABLE 1 GLOBAL SMART SOLAR MARKET BY GEOGRAPHY 2018-2026 ($ MILLION)
TABLE 2 CERC BENCHMARK CAPITAL COST FOR SETUP OF THERMAL PLANTS AND SOLAR PV IN INDIA
TABLE 3 AVERAGE PRICES OF SOLAR PV SYSTEMS AND THE ANTICIPATED RETURN AND COST
TABLE 4 GLOBAL SMART SOLAR MARKET BY APPLICATION 2018-2026 ($ MILLION)
TABLE 5 GLOBAL COMMERCIAL AND INDUSTRIAL APPLICATION MARKET BY GEOGRAPHY 2018-2026 ($ MILLION)
TABLE 6 GLOBAL DOMESTIC APPLICATION MARKET BY GEOGRAPHY 2018-2026 ($ MILLION)
TABLE 7 GLOBAL SMART SOLAR MARKET BY INDUSTRIAL SECTOR 2018-2026 ($ MILLION)
TABLE 8 GLOBAL UTILITIES MARKET BY GEOGRAPHY 2018-2026 ($ MILLION)
TABLE 9 GLOBAL GOVERNMENT MARKET BY GEOGRAPHY 2018-2026 ($ MILLION)
TABLE 10 GLOBAL CONSTRUCTION MARKET BY GEOGRAPHY 2018-2026 ($ MILLION)
TABLE 11 GLOBAL AGRICULTURE MARKET BY GEOGRAPHY 2018-2026 ($ MILLION)
TABLE 12 GLOBAL HEALTHCARE MARKET BY GEOGRAPHY 2018-2026 ($ MILLION)
TABLE 13 GLOBAL EDUCATION MARKET BY GEOGRAPHY 2018-2026 ($ MILLION)
TABLE 14 GLOBAL OTHERS MARKET BY GEOGRAPHY 2018-2026 ($ MILLION)
TABLE 15 GLOBAL SMART SOLAR MARKET BY DEVICE TYPE 2018-2026 ($ MILLION)
TABLE 16 GLOBAL INTELLIGRIDS DEVICE TYPE MARKET BY GEOGRAPHY 2018-2026 ($ MILLION)
TABLE 17 GLOBAL SMART SOLAR METERS DEVICE MARKET BY GEOGRAPHY 2018-2026 ($ MILLION)
TABLE 18 GLOBAL RFID DEVICE TYPE MARKET BY GEOGRAPHY 2018-2026 ($ MILLION)
TABLE 19 GLOBAL SMART SOLAR MARKET BY SERVICES 2018-2026 ($ MILLION)
TABLE 20 GLOBAL SYSTEM INTEGRATION AND DEPLOYMENT SERVICES MARKET BY GEOGRAPHY 2018-2026 ($ MILLION)
TABLE 21 GLOBAL SUPPORT AND MAINTENANCE SERVICES MARKET BY GEOGRAPHY 2018-2026 ($ MILLION)
TABLE 22 GLOBAL CONSULTING SERVICES MARKET BY GEOGRAPHY 2018-2026 ($ MILLION)
TABLE 23 GLOBAL DEMAND AND RESPONSE SERVICES MARKET BY GEOGRAPHY 2018-2026 ($ MILLION)
TABLE 24 GLOBAL SMART SOLAR MARKET BY SOLUTION 2018-2026 ($ MILLION)
TABLE 25 GLOBAL SUPERVISORY CONTROL AND DATA ACQUISITION MARKET BY GEOGRAPHY 2018-2026 ($MILLION)
TABLE 26 GLOBAL NETWORK MONITORING MARKET BY GEOGRAPHY 2018-2026 ($ MILLION)
TABLE 27 GLOBAL ANALYTICS MARKET BY GEOGRAPHY 2018-2026 ($ MILLION)
TABLE 28 GLOBAL REMOTE METERING MARKET BY GEOGRAPHY 2018-2026 ($ MILLION)
TABLE 29 GLOBAL METER DATA MANAGEMENT MARKET BY GEOGRAPHY 2018-2026 ($ MILLION)
TABLE 30 GLOBAL ASSET MANAGEMENT MARKET BY GEOGRAPHY 2018-2026 ($ MILLION)
TABLE 31 GLOBAL OUTAGE MANAGEMENT MARKET BY GEOGRAPHY 2018-2026 ($ MILLION)
TABLE 32 GLOBAL SMART SOLAR MARKET BY GEOGRAPHY 2018-2026 ($ MILLION)
TABLE 33 NORTH AMERICA DRIVERS AND RESTRAINTS
TABLE 34 NORTH AMERICA SMART SOLAR MARKET BY COUNTRIES ($MILLION)
TABLE 35 EUROPE MARKET DRIVERS AND RESTRAINTS
TABLE 36 EUROPE SMART SOLAR MARKET BY COUNTRIES 2018-2026 ($MILLION)
TABLE 37 ASIA PACIFIC MARKET DRIVERS AND RESTRAINTS
TABLE 38 ASIA PACIFIC SMART SOLAR MARKET BY COUNTRIES 2018-2026 ($MILLION)
TABLE 39 REST OF THE WORD MARKET DRIVER AND RESTRAINTS
TABLE 40 ROW MARKET SHARE BY REGION 2018-2026 ($MILLION)
LIST OF FIGURES
FIGURE 1 GLOBAL SMART SOLAR MARKET BY INDUSTRY SECTOR 2018-2026 ($ MILLION)
FIGURE 2 NORTH AMERICA SMART SOLAR MARKET 2018-2026 ($ MILLION)
FIGURE 3 ASIA PACIFIC SMART SOLAR MARKET 2018-2026 ($ MILLION)
FIGURE 4 GLOBAL UTILITIES MARKET 2018-2026 ($ MILLION)
FIGURE 5 GLOBAL COMMERCIAL AND INDUSTRIAL MARKET 2018-2026 ($ MILLION)
FIGURE 6 EVOLUTION OF SMART SOLAR MARKET
FIGURE 7 NEWLY INSTALLED CAPACITY OF SOLAR ENERGY GLOBALLY – 2016
FIGURE 8 US SOLAR ENERGY CONSUMPTION TREND (TRILLION BRITISH THERMAL UNITS)
FIGURE 9 GLOBAL ELECTRICITY PRICES BY COUNTRIES IN 2015 (IN U.S. DOLLAR CENTS PER KILOWATT HOUR)
FIGURE 10 INVESTMENT IN RENEWABLE ENERGY 2015 (IN $ MILLION)
FIGURE 11 US GREENHOUSE GAS EMISSION IN 2015
FIGURE 12 US COMMERCIAL SECTOR ELECTRICITY CONSUMPTION BY MAJOR END USERS IN 2015
FIGURE 13 GLOBAL SMART SOLAR MARKET BY COMMERCIAL AND INDUSTRIAL APPLICATION 2018-2026 ($ MILLION)
FIGURE 14 US RESIDENTIAL SECTOR ELECTRICITY CONSUMPTION BY MAJOR END USERS, 2015
FIGURE 15 GLOBAL SMART SOLAR MARKET BY DOMESTIC APPLICATION 2018-2026 ($ MILLION)
FIGURE 16 GLOBAL UTILITIES MARKET 2018-2026 ($ MILLION)
FIGURE 17 GLOBAL GOVERNMENT MARKET 2018-2026 ($ MILLION)
FIGURE 18 GLOBAL CONSTRUCTION MARKET 2018-2026 ($ MILLION)
FIGURE 19 GLOBAL AGRICULTURE MARKET 2018-2026 ($ MILLION)
FIGURE 20 GLOBAL HEALTHCARE MARKET 2018-2026 ($ MILLION)
FIGURE 21 GLOBAL EDUCATION MARKET 2018-2026 ($ MILLION)
FIGURE 22 GLOBAL OTHERS MARKET 2018-2026 ($ MILLION)
FIGURE 23 GLOBAL SMART SOLAR MARKET BY INTELLIGRIDS DEVICE TYPE 2018-2026 ($ MILLION)
FIGURE 24 GLOBAL ANNUAL SMART METER INVESTMENT ($BN), 2015–2020
FIGURE 25 GLOBAL SMART SOLAR MARKET DEVICE TYPE 2018-2026 ($ MILLION)
FIGURE 26 GLOBAL SMART SOLAR MARKET BY RFID DEVICE TYPE SEGMENT 2018-2026 ($ MILLION)
FIGURE 27 GLOBAL SYSTEM INTEGRATION AND DEPLOYMENT SERVICES MARKET 2018-2026 ($ MILLION)
FIGURE 28 GLOBAL SUPPORT AND MAINTENANCE SERVICES MARKET 2018-2026 ($ MILLION)
FIGURE 29 GLOBAL CONSULTING SERVICES MARKET 2018-2026 ($ MILLION)
FIGURE 30 GLOBAL DEMAND AND RESPONSE SERVICES MARKET 2018-2026 ($ MILLION)
FIGURE 31 GLOBAL SUPERVISORY CONTROL AND DATA ACQUISITION MARKET 2018-2026 ($ MILLION)
FIGURE 32 GLOBAL NETWORK MONITORING MARKET 2018-2026 ($ MILLION)
FIGURE 33 GLOBAL ANALYTICS MARKET 2018-2026 ($ MILLION)
FIGURE 34 GLOBAL REMOTE METERING MARKET 2018-2026 ($ MILLION)
FIGURE 35 GLOBAL METER DATA MANAGEMENT MARKET 2018-2026 ($ MILLION)
FIGURE 36 GLOBAL ASSET MANAGEMENT MARKET 2018-2026 ($ MILLION)
FIGURE 37 GLOBAL OUTAGE MANAGEMENT MARKET 2018-2026 ($ MILLION)
FIGURE 38 INVESTMENT PROPOSITION FOR SMART SOLAR MARKET BY REGION
FIGURE 39 US ELECTRICITY TARIFF RATES ESTIMATE AND FORECAST 2014-2019 (₵/KWH)
FIGURE 40 US SMART SOLAR MARKET 2018-2026 ($MILLION)
FIGURE 41 AGGREGATED ELECTRICITY TARIFF RATES OF CANADA, ESTIMATES AND FORECASTS 2014-2019 (₵/KWH)
FIGURE 42 CANADA SMART SOLAR MARKET 2018-2026 ($MILLION)
FIGURE 43 TOP 10 COUNTRIES IN 2015 BASED ON TOTAL PV INSTALLED CAPACITY (MW)
FIGURE 44 UK SMART SOLAR MARKET 2018-2026 ($MILLION)
FIGURE 45 FRANCE SMART SOLAR MARKET 2018-2026 ($MILLION)
FIGURE 46 GERMANY SMART SOLAR MARKET 2018-2026 ($MILLION)
FIGURE 47 SPAIN SMART SOLAR MARKET 2018-2026 ($MILLION)
FIGURE 48 ITALY SMART SOLAR MARKET 2018-2026 ($MILLION)
FIGURE 49 ROE SMART SOLAR MARKET 2014-2024 ($MILLION)
FIGURE 50 TOTAL ELECTRICITY DEMAND OF INDIA, ESTIMATE AND FORECAST 2014-2020 (GW)
FIGURE 51 INDIA SMART SOLAR MARKET 2018-2026 ($MILLION)
FIGURE 52 BREAKDOWN OF CLEAN ENERGY INVESTMENT OF CHINA IN 2015 BY SECTOR
FIGURE 53 CHINA SMART SOLAR MARKET 2018-2026 ($MILLION)
FIGURE 54 ELECTRICITY TARIFF IN JAPAN 2014-2019 (₵/KWH)
FIGURE 55 JAPAN SMART SOLAR MARKET 2018-2026 ($MILLION)
FIGURE 56 SOUTH KOREA SMART SOLAR MARKET 2018-2026 ($MILLION)
FIGURE 57 AUSTRALIA SMART SOLAR MARKET 2018-2026 ($MILLION)
FIGURE 58 ROAPAC SMART SOLAR MARKET 2018-2026 ($MILLION)
FIGURE 59 LATIN AMERICA SOLAR PV INSTALLATION 2015 & 2016 (MW)
FIGURE 60 LATIN AMERICA SMART SOLAR MARKET 2018-2026 ($MILLION)
FIGURE 61 MENA SMART SOLAR MARKET 2018-2026 ($MILLION)
FIGURE 62 AFRICA SMART SOLAR MARKET 2018-2026 ($MILLION)
FIGURE 63 MARKET SHARE ANALYSIS OF KEY PLAYERS 2017 (%)
- MARKET BY APPLICATION
- COMMERCIAL AND INDUSTRIAL
- DOMESTIC
- MARKET BY INDUSTRIAL SECTOR
- UTILITIES
- GOVERNMENT
- CONSTRUCTION
- AGRICULTURE
- HEALTHCARE
- EDUCATION
- OTHERS
- MARKET BY DEVICE TYPE AND SERVICES
- MARKET BY DEVICE TYPE
- INTELLIGRID
- SMART SOLAR METERS
- RFID
- MARKET BY SERVICES
- SYSTEM INTEGRATION AND DEPLOYMENT SERVICES
- SUPPORT AND MAINTENANCE SERVICES
- CONSULTING SERVICES
- DEMAND RESPONSE SERVICES
- MARKET BY DEVICE TYPE
- MARKET BY SOLUTION
- SUPERVISORY CONTROL AND DATA ACQUISITION
- NETWORK MONITORING
- ANALYTICS
- REMOTE METERING
- METER DATA MANAGEMENT
- ASSET MANAGEMENT
- OUTAGE MANAGEMENT
- GEOGRAPHICAL ANALYSIS
- NORTH AMERICA
- UNITED STATES
- CANADA
- EUROPE
- UNITED KINGDOM
- FRANCE
- GERMANY
- SPAIN
- ITALY
- ROE
- ASIA PACIFIC
- INDIA
- CHINA
- JAPAN
- SOUTH KOREA
- AUSTRALIA
- ROAPAC
- REST OF WORLD
- LATIN AMERICA
- MENA
- AFRICA
- NORTH AMERICA
To request a free sample copy of this report, please complete the form below :
We offer 10% free customization including country-level data, niche applications and competitive landscape with every report.
Choose License Type
RELATED REPORTS
-

UNITED STATES DATA CENTER ENERGY STORAGE MARKET FORECAST 2025-2032
-

INDIA DATA CENTER ENERGY STORAGE MARKET FORECAST 2025-2032
-

GERMANY DATA CENTER ENERGY STORAGE MARKET FORECAST 2025-2032
-

BRAZIL DATA CENTER ENERGY STORAGE MARKET FORECAST 2025-2032
-

GLOBAL DATA CENTER ENERGY STORAGE MARKET FORECAST 2025-2032
-

GLOBAL INDUSTRIAL BIOMASS BOILER MARKET FORECAST 2025-2032
-

ASIA-PACIFIC INDUSTRIAL BIOMASS BOILER MARKET FORECAST 2025-2032
-

EUROPE INDUSTRIAL BIOMASS BOILER MARKET FORECAST 2025-2032
-

NORTH AMERICA INDUSTRIAL BIOMASS BOILER MARKET FORECAST 2025-2032
-

INDIA INDUSTRIAL BIOMASS BOILER MARKET FORECAST 2025-2032