GLOBAL FLOATING POWER PLANT MARKET FORECAST 2024-2032
SCOPE OF THE REPORT
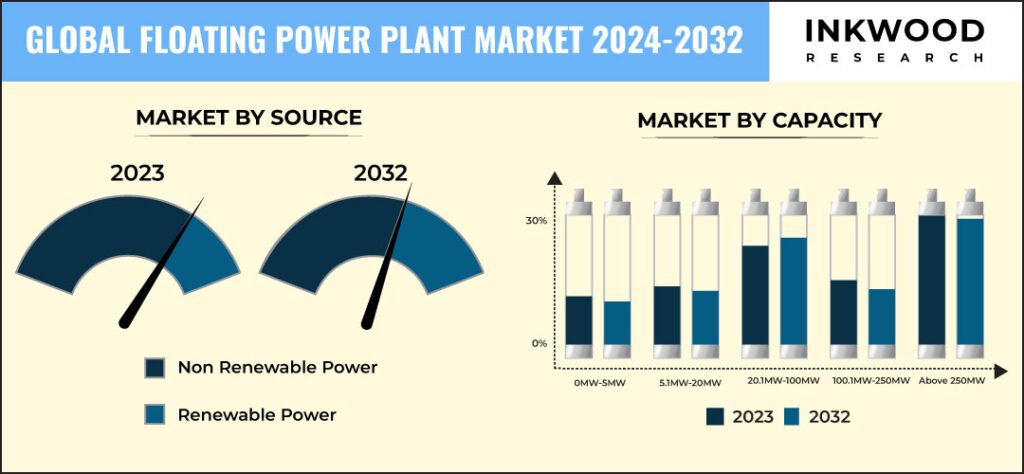
Global Floating Power Plant Market by Source (Renewable Power Source, Non-renewable Power Source) Market by Capacity (0 MW – 5 MW, 5.1 MW – 20 MW, 20.1 MW – 100 MW, 100.1 MW – 250 MW, Above 250 MW) by Geography
REPORTS » ENERGY, POWER & UTILITIES » UTILITIES » GLOBAL FLOATING POWER PLANT MARKET FORECAST 2024-2032
MARKET OVERVIEW
The global floating power plant market size was $11,262.96 million in 2023 and is expected to reach $27,988.30 million by 2032, growing at a CAGR of 10.51% during the forecast period 2024-2032. The base year considered for the study is 2023, and the estimated period is between 2024 and 2032.
The floating power plant industry is witnessing significant growth due to the increasing demand for floating power plants and the rising adoption of renewable energy sources. A key player in this market, the floating nuclear power plant Russia, exemplifies advancements in floating electricity generation technologies. As a floating plant magnet, Russia is leading the way with its innovative approach to floating power supply. Floating solar energy and offshore wind energy infrastructure are pivotal in driving the market forward. These technologies contribute to clean energy projects and support the development of sustainable energy sources.
The market’s expansion is further fueled by numerous floating power plant projects and offshore wind projects that aim to harness renewable energy from oceans and large water bodies. The industry’s growth is also bolstered by IC engine-based floating power plants, which provide a flexible and efficient solution for remote areas and disaster-prone regions. These floating power plants can be deployed quickly to meet urgent energy needs, making them a valuable asset in the global energy landscape. As countries strive to reduce carbon emissions and transition to greener energy solutions, the floating power plant industry is poised for substantial expansion.
The combination of floating solar energy and offshore wind energy infrastructure plays a crucial role in achieving global energy sustainability goals. With increasing investments in floating power plant projects, the market is set to grow exponentially, driven by the need for reliable, clean, and efficient energy sources. Moving ahead, the global floating power plant market is emerging as a critical component of the global energy sector, supported by advancements in renewable energy sources and innovative technologies. The ongoing development of clean energy projects and the strategic implementation of offshore wind projects highlight the industry’s potential to transform energy generation and consumption.

Read our latest blog on the Floating Power Plant Market
GROWTH ENABLERS
Key growth enablers of the global floating power plant market:
- Surging demand for clean energy to drive market growth
- The rapid increase in carbon dioxide emission from fossil fuels has encouraged the government to increasingly adopt clean energy from renewable energy sources such as solar, wind, etc.
- Moreover, installing solar panels on water bodies such as oceans prevents the over-exploitation of land areas. The rising power demand is also boosting the capacity of renewable energy, leading to the widespread adoption of floating power plants.
- Government investments in the energy industry boost market demand
GROWTH RESTRAINTS
Key growth restraining factors of the global floating power plant market:
- High project costs hinder market growth
- Offshore wind farms have higher installation costs compared to onshore wind farms. These increased costs are due to the need to set up and maintain wind turbines in the challenging marine environment.
- As a result, planning and project development expenses are higher, and lead times are longer. Greater sea depths require more expensive foundations, and logistical costs increase depending on the distance of the plant from the port.
- Technical challenges involved in floating power plants
To Know More About This Report, Request a Free Sample Copy
KEY MARKET TRENDS
Global Floating Power Plant Market | Top Market Trends
- Internal combustion (IC) engine-based floating power plants are emerging as a popular trend in the industry. IC engines, a non-renewable power generation method, utilize the expansion of hot gases to drive a piston within a cylinder. The piston’s linear motion is further converted into rotational action through a crankshaft, generating power.
- The global wind energy sector saw substantial growth in 2023 and 2024. A record 117 GW of new wind energy capacity was installed in 2023, making it the highest year ever for wind energy installations, representing a 50% increase compared to 2022. Of this new capacity, 106 GW came from onshore wind, with offshore wind installations contributing an additional 10.8 GW.
- In essence, China played a significant role in this growth by installing 75 GW of new capacity in 2023, accounting for nearly 65% of the global total. Other notable contributors included the United States, Brazil, Germany, and India.
- The United Kingdom further increased its wind capacity by 1.4 GW in 2023, reaching a total of 30.2 GW. Germany also experienced significant growth, adding 3.2 GW to achieve a total capacity of 69.5 GW. Meanwhile, offshore wind installations expanded in countries such as the Netherlands, which added 2.8 GW of new capacity.
- Technological advancements are important in the growth of the global floating power plant market. Innovations in materials, design, and construction techniques are enhancing the efficiency, durability, and cost-effectiveness of floating power plants. For example, improvements in turbine design and the development of more robust and corrosion-resistant materials are addressing some of the technical challenges associated with offshore installations.
MARKET SEGMENTATION
Need a custom report or have specific data requirements? Let us know!
Market Segmentation – Source and Capacity –
Market by Source:
- Non-Renewable Power Source
- In 2023, the majority of the market share was captured by the non-renewable power source segment under the source category.
- The non-renewable power source segment includes power generated from thermal, natural gas, nuclear, and fossil fuel sources such as petroleum and coal. Gas turbines, IC engines, and other technologies are commonly used for generating power from these sources.
- Moreover, gas turbines enable high efficiency and better emission performance on various gaseous and liquid fuels. Due to these advantages, they find wide applications in offshore platforms within the oil and gas industry.
- Renewable Power Source
Market by Capacity:
- 0 MW – 5 MW
- 5.1 MW – 20 MW
- 20.1 MW – 100 MW
- In 2023, the majority of market share was captured by the 20.1 MW – 100 MW segment under the capacity category. In addition, 20.1 MW – 100 MW is anticipated to be the fastest-growing capacity in the global floating power plant market.
- The 20.1 MW – 100 MW capacity segment includes gas turbines, IC engines, and other technologies that generate energy ranging from 20.1 MW to 100 MW. These systems utilize various sources such as natural gas, fossil fuels (non-renewable sources), solar, wind, and other renewable sources. Floating power plants of this capacity primarily rely on renewable energy sources, including solar and wind.
- 100.1 MW – 250 MW
- Above 250 MW
GEOGRAPHICAL STUDY
Geographical Study based on Four Major Regions:- North America: The United States and Canada
- Europe: The United Kingdom, Germany, France, Italy, Spain, Belgium, the Netherlands, and Rest of Europe
- Asia-Pacific: China, Japan, India, South Korea, Australia & New Zealand, Indonesia, Vietnam, and Rest of Asia-Pacific
- The Asia-Pacific is expected to be the leading region in the global floating power plant market over the forecast period.
- The Asia-Pacific is witnessing rapid adoption and development of floating power plants, particularly in countries like China, Japan, South Korea, India, Indonesia and Vietnam. These nations are making significant investments in floating offshore wind technology to leverage their extensive coastlines and deep-water sites, which are unsuitable for traditional fixed-bottom wind turbines. This strategy enhances their renewable energy capacity and aligns with their objectives of reducing carbon emissions and strengthening energy security.
- Additionally, companies and governments in the region are collaborating with global leaders in floating wind technology to advance and implement innovative solutions. These partnerships aim to enhance the efficiency, stability, and cost-effectiveness of floating power plants, positioning them as a viable alternative to traditional energy sources. Ongoing research and pilot projects are integral in overcoming technical challenges and scaling up commercial operations in the coming years.
- Rest of World: Latin America, the Middle East & Africa
MAJOR PLAYERS
Major players in the global floating power plant market:
- BW Ideol
- General Electric (GE)
- Karpowership
- KYOCERA Corporation
- Mitsubishi Corporation
- Siemens AG
- Wartsila Corporation
Key strategies adopted by some of these companies:
- Mitsubishi Heavy Industries (MHI) and the Electricity Generating Authority of Thailand (EGAT) signed a memorandum of understanding (MoU) in June 2024. The agreement aims to introduce hydrogen large gas turbine co-firing technology in Thailand as part of efforts to achieve net-zero goals.
- Wartsila launched the world’s first large-scale 100% hydrogen-ready engine power plant in June 2024, aiming to enable future net-zero power systems.
REPORT SYNOPSIS
| REPORT SCOPE | DETAILS |
|---|---|
| Market Forecast Years | 2024-2032 |
| Base Year | 2023 |
| Market Historical Years | 2018-2022 |
| Forecast Units | Revenue ($ Million) |
| Segments Analyzed | Source and Capacity |
| Geographies Analyzed | North America, Europe, Asia-Pacific, and Rest of World |
| Companies Analyzed | BW Ideol, Ciel & Terre International, Floating Power Plant A/S, General Electric, Karpowership, KYOCERA Corporation, MAN Energy Solutions SE, Mitsubishi Corporation, Ocean Sun, SeaTwirl AB, Siemens AG, Upsolar Group Co Ltd, Vikram Solar Limited, Wartsila Corporation |
TABLE OF CONTENTS
RESEARCH SCOPE & METHODOLOGY
- STUDY OBJECTIVES
- METHODOLOGY
- ASSUMPTIONS & LIMITATIONS
EXECUTIVE SUMMARY
- MARKET SIZE & ESTIMATES
- MARKET OVERVIEW
- SCOPE OF STUDY
- CRISIS SCENARIO ANALYSIS
- IMPACT OF COVID-19 ON THE GLOBAL FLOATING POWER PLANT MARKET
- MAJOR MARKET FINDINGS
- GROWING NUMBER OF RENEWABLE ENERGY PROJECTS
- RISE IN TREND FOR OFFSHORE WIND PROJECT
- NON-RENEWABLE ENERGY SOURCES ARE THE PREDOMINANT TYPE USED IN FLOATING POWER PLANTS
- CAPACITY RANGE OF 20.1 MW TO 100 MW IS EXPERIENCING THE FASTEST GROWTH
MARKET DYNAMICS
- KEY DRIVERS
- SURGING DEMAND FOR CLEAN ENERGY
- GOVERNMENT INVESTMENTS IN THE ENERGY INDUSTRY
- KEY RESTRAINTS
- HIGH PROJECT COSTS
- TECHNICAL CHALLENGES INVOLVED IN FLOATING POWER PLANTS
- KEY DRIVERS
KEY ANALYTICS
- ASSESSMENT OF SHIP-BASED FLOATING POWER PLANTS
- DEVELOPMENTS RELATED TO SHIP-BASED FLOATING POWER PLANTS
- KEY MARKET TRENDS
- POPULARITY OF INTERNAL COMBUSTION (IC) ENGINE-BASED FLOATING POWER PLANTS
- RISE IN THE INSTALLATION OF NEW POWER PLANTS
- TECHNOLOGICAL ADVANCEMENTS AND INNOVATIONS
- PORTER’S FIVE FORCES ANALYSIS
- BUYERS POWER
- SUPPLIERS POWER
- SUBSTITUTION
- NEW ENTRANTS
- INDUSTRY RIVALRY
- GROWTH PROSPECT MAPPING
- GROWTH PROSPECT MAPPING FOR GERMANY
- GROWTH PROSPECT MAPPING FOR THE NETHERLANDS
- GROWTH PROSPECT MAPPING FOR INDIA
- GROWTH PROSPECT MAPPING FOR BRAZIL
- MARKET MATURITY ANALYSIS
- MARKET CONCENTRATION ANALYSIS
- VALUE CHAIN ANALYSIS
- RAW MATERIALS & COMPONENT SUPPLIERS
- ORIGINAL EQUIPMENT MANUFACTURERS (OEMS)
- ENGINEERING, PROCUREMENT, AND CONSTRUCTION (EPC) COMPANIES & DEVELOPERS
- KEY BUYING CRITERIA
- TECHNOLOGICAL RELIABILITY AND EFFICIENCY
- COST-EFFECTIVENESS
- EASE OF INSTALLATION AND DEPLOYMENT
- REPUTATION AND TRACK RECORD OF THE SUPPLIER OR MANUFACTURER
- ASSESSMENT OF SHIP-BASED FLOATING POWER PLANTS
MARKET BY SOURCE
- RENEWABLE POWER SOURCE
- MARKET FORECAST FIGURE
- SEGMENT ANALYSIS
- NON-RENEWABLE POWER SOURCE
- MARKET FORECAST FIGURE
- SEGMENT ANALYSIS
- RENEWABLE POWER SOURCE
MARKET BY CAPACITY
- 0 MW – 5 MW
- MARKET FORECAST FIGURE
- SEGMENT ANALYSIS
- 5.1 MW – 20 MW
- MARKET FORECAST FIGURE
- SEGMENT ANALYSIS
- 20.1 MW – 100 MW
- MARKET FORECAST FIGURE
- SEGMENT ANALYSIS
- 100.1 MW – 250 MW
- MARKET FORECAST FIGURE
- SEGMENT ANALYSIS
- ABOVE 250 MW
- MARKET FORECAST FIGURE
- SEGMENT ANALYSIS
- 0 MW – 5 MW
GEOGRAPHICAL ANALYSIS
- NORTH AMERICA
- MARKET SIZE & ESTIMATES
- NORTH AMERICA FLOATING POWER PLANT MARKET DRIVERS
- NORTH AMERICA FLOATING POWER PLANT MARKET CHALLENGES
- NORTH AMERICA FLOATING POWER PLANT MARKET REGULATORY FRAMEWORK
- KEY PLAYERS IN NORTH AMERICA FLOATING POWER PLANT MARKET
- COUNTRY ANALYSIS
- UNITED STATES
- UNITED STATES FLOATING POWER PLANT MARKET SIZE & OPPORTUNITIES
- CANADA
- CANADA FLOATING POWER PLANT MARKET SIZE & OPPORTUNITIES
- UNITED STATES
- EUROPE
- MARKET SIZE & ESTIMATES
- EUROPE FLOATING POWER PLANT MARKET DRIVERS
- EUROPE FLOATING POWER PLANT MARKET CHALLENGES
- EUROPE FLOATING POWER PLANT MARKET REGULATORY FRAMEWORK
- KEY PLAYERS IN EUROPE FLOATING POWER PLANT MARKET
- COUNTRY ANALYSIS
- UNITED KINGDOM
- UNITED KINGDOM FLOATING POWER PLANT MARKET SIZE & OPPORTUNITIES
- GERMANY
- GERMANY FLOATING POWER PLANT MARKET SIZE & OPPORTUNITIES
- FRANCE
- FRANCE FLOATING POWER PLANT MARKET SIZE & OPPORTUNITIES
- SPAIN
- SPAIN FLOATING POWER PLANT MARKET SIZE & OPPORTUNITIES
- ITALY
- ITALY FLOATING POWER PLANT MARKET SIZE & OPPORTUNITIES
- THE NETHERLANDS
- THE NETHERLANDS FLOATING POWER PLANT MARKET SIZE & OPPORTUNITIES
- BELGIUM
- BELGIUM FLOATING POWER PLANT MARKET SIZE & OPPORTUNITIES
- REST OF EUROPE
- REST OF EUROPE FLOATING POWER PLANT MARKET SIZE & OPPORTUNITIES
- UNITED KINGDOM
- ASIA-PACIFIC
- MARKET SIZE & ESTIMATES
- ASIA-PACIFIC FLOATING POWER PLANT MARKET DRIVERS
- ASIA-PACIFIC FLOATING POWER PLANT MARKET CHALLENGES
- ASIA-PACIFIC FLOATING POWER PLANT MARKET REGULATORY FRAMEWORK
- KEY PLAYERS IN ASIA-PACIFIC FLOATING POWER PLANT MARKET
- COUNTRY ANALYSIS
- CHINA
- CHINA FLOATING POWER PLANT MARKET SIZE & OPPORTUNITIES
- JAPAN
- JAPAN FLOATING POWER PLANT MARKET SIZE & OPPORTUNITIES
- INDIA
- INDIA FLOATING POWER PLANT MARKET SIZE & OPPORTUNITIES
- SOUTH KOREA
- SOUTH KOREA FLOATING POWER PLANT MARKET SIZE & OPPORTUNITIES
- AUSTRALIA & NEW ZEALAND
- AUSTRALIA & NEW ZEALAND FLOATING POWER PLANT MARKET SIZE & OPPORTUNITIES
- INDONESIA
- INDONESIA FLOATING POWER PLANT MARKET SIZE & OPPORTUNITIES
- VIETNAM
- VIETNAM FLOATING POWER PLANT MARKET SIZE & OPPORTUNITIES
- REST OF ASIA-PACIFIC
- REST OF ASIA-PACIFIC FLOATING POWER PLANT MARKET SIZE & OPPORTUNITIES
- CHINA
- REST OF WORLD
- MARKET SIZE & ESTIMATES
- REST OF WORLD FLOATING POWER PLANT MARKET DRIVERS
- REST OF WORLD FLOATING POWER PLANT MARKET CHALLENGES
- REST OF WORLD FLOATING POWER PLANT MARKET REGULATORY FRAMEWORK
- KEY PLAYERS IN REST OF WORLD FLOATING POWER PLANT MARKET
- REGIONAL ANALYSIS
- LATIN AMERICA
- LATIN AMERICA FLOATING POWER PLANT MARKET SIZE & OPPORTUNITIES
- MIDDLE EAST & AFRICA
- MIDDLE EAST & AFRICA FLOATING POWER PLANT MARKET SIZE & OPPORTUNITIES
- LATIN AMERICA
- NORTH AMERICA
COMPETITIVE LANDSCAPE
- KEY STRATEGIC DEVELOPMENTS
- MERGERS & ACQUISITIONS
- PRODUCT LAUNCHES & DEVELOPMENTS
- PARTNERSHIPS & AGREEMENTS
- BUSINESS EXPANSIONS & DIVESTITURES
- COMPANY PROFILES
- BW IDEOL
- COMPANY OVERVIEW
- PRODUCTS LIST
- STRENGTHS & CHALLENGES
- CIEL & TERRE INTERNATIONAL
- COMPANY OVERVIEW
- PRODUCTS LIST
- STRENGTHS & CHALLENGES
- FLOATING POWER PLANT A/S
- COMPANY OVERVIEW
- PRODUCTS LIST
- STRENGTHS & CHALLENGES
- GENERAL ELECTRIC
- COMPANY OVERVIEW
- PRODUCTS LIST
- STRENGTHS & CHALLENGES
- KARPOWERSHIP
- COMPANY OVERVIEW
- PRODUCTS LIST
- STRENGTHS & CHALLENGES
- KYOCERA CORPORATION
- COMPANY OVERVIEW
- PRODUCTS LIST
- STRENGTHS & CHALLENGES
- MAN ENERGY SOLUTIONS SE
- COMPANY OVERVIEW
- PRODUCTS LIST
- STRENGTHS & CHALLENGES
- MITSUBISHI CORPORATION
- COMPANY OVERVIEW
- PRODUCTS LIST
- STRENGTHS & CHALLENGES
- OCEAN SUN
- COMPANY OVERVIEW
- PRODUCTS LIST
- STRENGTHS & CHALLENGES
- SEATWIRL AB
- COMPANY OVERVIEW
- PRODUCTS LIST
- STRENGTHS & CHALLENGES
- SIEMENS AG
- COMPANY OVERVIEW
- PRODUCTS LIST
- STRENGTHS & CHALLENGES
- UPSOLAR GROUP CO LTD
- COMPANY OVERVIEW
- PRODUCTS LIST
- STRENGTHS & CHALLENGES
- VIKRAM SOLAR LIMITED
- COMPANY OVERVIEW
- PRODUCTS LIST
- STRENGTHS & CHALLENGES
- WARTSILA CORPORATION
- COMPANY OVERVIEW
- PRODUCTS LIST
- STRENGTHS & CHALLENGES
- BW IDEOL
- KEY STRATEGIC DEVELOPMENTS
LIST OF TABLES
TABLE 1: MARKET SNAPSHOT – FLOATING POWER PLANT
TABLE 2: GLOBAL FLOATING POWER PLANT MARKET, BY SOURCE, HISTORICAL YEARS, 2018-2022 (IN $ MILLION)
TABLE 3: GLOBAL FLOATING POWER PLANT MARKET, BY SOURCE, FORECAST YEARS, 2024-2032 (IN $ MILLION)
TABLE 4: GLOBAL RENEWABLE POWER SOURCE MARKET, BY REGION, HISTORICAL YEARS, 2018-2022 (IN $ MILLION)
TABLE 5: GLOBAL RENEWABLE POWER SOURCE MARKET, BY REGION, FORECAST YEARS, 2024-2032 (IN $ MILLION)
TABLE 6: GLOBAL NON-RENEWABLE POWER SOURCE MARKET, BY REGION, HISTORICAL YEARS, 2018-2022 (IN $ MILLION)
TABLE 7: GLOBAL NON-RENEWABLE POWER SOURCE MARKET, BY REGION, FORECAST YEARS, 2024-2032 (IN $ MILLION)
TABLE 8: GLOBAL FLOATING POWER PLANT MARKET, BY CAPACITY, HISTORICAL YEARS, 2018-2022 (IN $ MILLION)
TABLE 9: GLOBAL FLOATING POWER PLANT MARKET, BY CAPACITY, FORECAST YEARS, 2024-2032 (IN $ MILLION)
TABLE 10: GLOBAL 0 MW – 5 MW MARKET, BY REGION, HISTORICAL YEARS, 2018-2022 (IN $ MILLION)
TABLE 11: GLOBAL 0 MW – 5 MW MARKET, BY REGION, FORECAST YEARS, 2024-2032 (IN $ MILLION)
TABLE 12: GLOBAL 5.1 MW – 20 MW MARKET, BY REGION, HISTORICAL YEARS, 2018-2022 (IN $ MILLION)
TABLE 13: GLOBAL 5.1 MW – 20 MW MARKET, BY REGION, FORECAST YEARS, 2024-2032 (IN $ MILLION)
TABLE 14: GLOBAL 20.1 MW – 100 MW MARKET, BY REGION, HISTORICAL YEARS, 2018-2022 (IN $ MILLION)
TABLE 15: GLOBAL 20.1 MW – 100 MW MARKET, BY REGION, FORECAST YEARS, 2024-2032 (IN $ MILLION)
TABLE 16: GLOBAL 100.1 MW – 250 MW MARKET, BY REGION, HISTORICAL YEARS, 2018-2022 (IN $ MILLION)
TABLE 17: GLOBAL 100.1 MW – 250 MW MARKET, BY REGION, FORECAST YEARS, 2024-2032 (IN $ MILLION)
TABLE 18: GLOBAL ABOVE 250 MW MARKET, BY REGION, HISTORICAL YEARS, 2018-2022 (IN $ MILLION)
TABLE 19: GLOBAL ABOVE 250 MW MARKET, BY REGION, FORECAST YEARS, 2024-2032 (IN $ MILLION)
TABLE 20: GLOBAL FLOATING POWER PLANT MARKET, BY REGIONAL OUTLOOK, HISTORICAL YEARS, 2018-2022 (IN $ MILLION)
TABLE 21: GLOBAL FLOATING POWER PLANT MARKET, BY REGIONAL OUTLOOK, FORECAST YEARS, 2024-2032 (IN $ MILLION)
TABLE 22: NORTH AMERICA FLOATING POWER PLANT MARKET, BY COUNTRY, HISTORICAL YEARS, 2018-2022 (IN $ MILLION)
TABLE 23: NORTH AMERICA FLOATING POWER PLANT MARKET, BY COUNTRY, FORECAST YEARS, 2024-2032 (IN $ MILLION)
TABLE 24: KEY PLAYERS OPERATING IN NORTH AMERICA FLOATING POWER PLANT MARKET
TABLE 25: EUROPE FLOATING POWER PLANT MARKET, BY COUNTRY, HISTORICAL YEARS, 2018-2022 (IN $ MILLION)
TABLE 26: EUROPE FLOATING POWER PLANT MARKET, BY COUNTRY, FORECAST YEARS, 2024-2032 (IN $ MILLION)
TABLE 27: KEY PLAYERS OPERATING IN EUROPE FLOATING POWER PLANT MARKET
TABLE 28: ASIA-PACIFIC FLOATING POWER PLANT MARKET, BY COUNTRY, HISTORICAL YEARS, 2018-2022 (IN $ MILLION)
TABLE 29: ASIA-PACIFIC FLOATING POWER PLANT MARKET, BY COUNTRY, FORECAST YEARS, 2024-2032 (IN $ MILLION)
TABLE 30: KEY PLAYERS OPERATING IN ASIA-PACIFIC FLOATING POWER PLANT MARKET
TABLE 31: REST OF WORLD FLOATING POWER PLANT MARKET, BY REGION, HISTORICAL YEARS, 2018-2022 (IN $ MILLION)
TABLE 32: REST OF WORLD FLOATING POWER PLANT MARKET, BY REGION, FORECAST YEARS, 2024-2032 (IN $ MILLION)
TABLE 33: KEY PLAYERS OPERATING IN REST OF WORLD FLOATING POWER PLANT MARKET
TABLE 34: LIST OF MERGERS & ACQUISITIONS
TABLE 35: LIST OF PRODUCT LAUNCHES & DEVELOPMENTS
TABLE 36: LIST OF PARTNERSHIPS & AGREEMENTS
TABLE 37: LIST OF BUSINESS EXPANSIONS & DIVESTITURES
LIST OF FIGURES
FIGURE 1: KEY MARKET TRENDS
FIGURE 2: PORTER’S FIVE FORCES ANALYSIS
FIGURE 3: GROWTH PROSPECT MAPPING FOR GERMANY
FIGURE 4: GROWTH PROSPECT MAPPING FOR THE NETHERLANDS
FIGURE 5: GROWTH PROSPECT MAPPING FOR INDIA
FIGURE 6: GROWTH PROSPECT MAPPING FOR BRAZIL
FIGURE 7: MARKET MATURITY ANALYSIS
FIGURE 8: MARKET CONCENTRATION ANALYSIS
FIGURE 9: VALUE CHAIN ANALYSIS
FIGURE 10: KEY BUYING CRITERIA
FIGURE 11: GLOBAL FLOATING POWER PLANT MARKET, GROWTH POTENTIAL, BY SOURCE, IN 2023
FIGURE 12: GLOBAL FLOATING POWER PLANT MARKET, BY RENEWABLE POWER SOURCE, 2024-2032 (IN $ MILLION)
FIGURE 13: GLOBAL FLOATING POWER PLANT MARKET, BY NON-RENEWABLE POWER SOURCE, 2024-2032 (IN $ MILLION)
FIGURE 14: GLOBAL FLOATING POWER PLANT MARKET, GROWTH POTENTIAL, BY CAPACITY, IN 2023
FIGURE 15: GLOBAL FLOATING POWER PLANT MARKET, BY 0 MW – 5 MW, 2024-2032 (IN $ MILLION)
FIGURE 16: GLOBAL FLOATING POWER PLANT MARKET, BY 5.1 MW – 20 MW, 2024-2032 (IN $ MILLION)
FIGURE 17: GLOBAL FLOATING POWER PLANT MARKET, BY 20.1 MW – 100 MW, 2024-2032 (IN $ MILLION)
FIGURE 18: GLOBAL FLOATING POWER PLANT MARKET, BY 100.1 MW – 250 MW, 2024-2032 (IN $ MILLION)
FIGURE 19: GLOBAL FLOATING POWER PLANT MARKET, BY ABOVE 250 MW, 2024-2032 (IN $ MILLION)
FIGURE 20: NORTH AMERICA FLOATING POWER PLANT MARKET, COUNTRY OUTLOOK, 2023 & 2032 (IN %)
FIGURE 21: UNITED STATES FLOATING POWER PLANT MARKET, 2024-2032 (IN $ MILLION)
FIGURE 22: CANADA FLOATING POWER PLANT MARKET, 2024-2032 (IN $ MILLION)
FIGURE 23: EUROPE FLOATING POWER PLANT MARKET, COUNTRY OUTLOOK, 2023 & 2032 (IN %)
FIGURE 24: UNITED KINGDOM FLOATING POWER PLANT MARKET, 2024-2032 (IN $ MILLION)
FIGURE 25: GERMANY FLOATING POWER PLANT MARKET, 2024-2032 (IN $ MILLION)
FIGURE 26: FRANCE FLOATING POWER PLANT MARKET, 2024-2032 (IN $ MILLION)
FIGURE 27: SPAIN FLOATING POWER PLANT MARKET, 2024-2032 (IN $ MILLION)
FIGURE 28: ITALY FLOATING POWER PLANT MARKET, 2024-2032 (IN $ MILLION)
FIGURE 29: THE NETHERLANDS FLOATING POWER PLANT MARKET, 2024-2032 (IN $ MILLION)
FIGURE 30: BELGIUM FLOATING POWER PLANT MARKET, 2024-2032 (IN $ MILLION)
FIGURE 31: REST OF EUROPE FLOATING POWER PLANT MARKET, 2024-2032 (IN $ MILLION)
FIGURE 32: ASIA-PACIFIC FLOATING POWER PLANT MARKET, COUNTRY OUTLOOK, 2023 & 2032 (IN%)
FIGURE 33: CHINA FLOATING POWER PLANT MARKET, 2024-2032 (IN $ MILLION)
FIGURE 34: JAPAN FLOATING POWER PLANT MARKET, 2024-2032 (IN $ MILLION)
FIGURE 35: INDIA FLOATING POWER PLANT MARKET, 2024-2032 (IN $ MILLION)
FIGURE 36: SOUTH KOREA FLOATING POWER PLANT MARKET, 2024-2032 (IN $ MILLION)
FIGURE 37: AUSTRALIA & NEW ZEALAND FLOATING POWER PLANT MARKET, 2024-2032 (IN $ MILLION)
FIGURE 38: INDONESIA FLOATING POWER PLANT MARKET, 2024-2032 (IN $ MILLION)
FIGURE 39: VIETNAM FLOATING POWER PLANT MARKET, 2024-2032 (IN $ MILLION)
FIGURE 40: REST OF ASIA-PACIFIC FLOATING POWER PLANT MARKET, 2024-2032 (IN $ MILLION)
FIGURE 41: REST OF WORLD FLOATING POWER PLANT MARKET, REGIONAL OUTLOOK, 2023 & 2032 (IN %)
FIGURE 42: LATIN AMERICA FLOATING POWER PLANT MARKET, 2024-2032 (IN $ MILLION)
FIGURE 43: MIDDLE EAST & AFRICA FLOATING POWER PLANT MARKET, 2024-2032 (IN $ MILLION)
FAQ’s
FAQs
The global floating power plant market is anticipated to generate a revenue of $27,988.30 million by 2032.
The Asia-Pacific is emerging as a promising market for floating power plants, driven by the rapid adoption of renewable energy sources and infrastructure development in emerging economies such as India, Japan, and China. Moreover, advancements in technologies such as digitization and automation in the power plant sector are further propelling regional growth.
The fastest-growing source of floating power plants is renewable power.
RELATED REPORTS
-

UNITED STATES DATA CENTER ENERGY STORAGE MARKET FORECAST 2025-2032
-

INDIA DATA CENTER ENERGY STORAGE MARKET FORECAST 2025-2032
-

GERMANY DATA CENTER ENERGY STORAGE MARKET FORECAST 2025-2032
-

BRAZIL DATA CENTER ENERGY STORAGE MARKET FORECAST 2025-2032
-

GLOBAL DATA CENTER ENERGY STORAGE MARKET FORECAST 2025-2032
-

GLOBAL INDUSTRIAL BIOMASS BOILER MARKET FORECAST 2025-2032
-

ASIA-PACIFIC INDUSTRIAL BIOMASS BOILER MARKET FORECAST 2025-2032
-

EUROPE INDUSTRIAL BIOMASS BOILER MARKET FORECAST 2025-2032
-

NORTH AMERICA INDUSTRIAL BIOMASS BOILER MARKET FORECAST 2025-2032
-
INDIA INDUSTRIAL BIOMASS BOILER MARKET FORECAST 2025-2032