BRAZIL FLOATING POWER PLANT MARKET FORECAST 2024-2032
SCOPE OF THE REPORT
Brazil Floating Power Plant Market by Source (Renewable Power Source, Non-renewable Power Source) Market by Capacity (0 MW – 5 MW, 5.1 MW – 20 MW, 20.1 MW – 100 MW, 100.1 MW – 250 MW, Above 250 MW)
REPORTS » ENERGY, POWER & UTILITIES » UTILITIES » BRAZIL FLOATING POWER PLANT MARKET FORECAST 2024-2032
MARKET OVERVIEW
The Brazil floating power plant market is anticipated to grow at a CAGR of 9.30% over the forecast period of 2024-2032. It is set to reach a revenue of $923.85 million by 2032.Â
The Brazil floating power plant market is observing developing growth, driven primarily by the increasing demand for clean energy solutions. As the global focus shifts towards sustainable energy sources, Brazil stands at the forefront. With abundant natural resources and growing energy needs, the country is adopting innovative technologies such as floating power plants.
Government investments play a crucial role in steering the market’s direction. In Brazil, strategic initiatives and policies aimed at strengthening the energy sector bolster market demand and encourage private sector involvement. These investments are pivotal in expanding the infrastructure necessary for floating power plants, thereby increasing energy production capacity nationwide.

To Know More About This Report, Request a Free Sample Copy
Technological innovations in Brazil are important in shaping the floating power plant market. Advancements such as floating solar panels optimize energy capture from water surfaces while minimizing environmental impact. Additionally, integrating energy storage technologies with floating platforms enhances operational efficiency and reinforces grid stability. These developments underscore Brazil’s commitment to sustainable energy solutions, positioning floating power plants as integral components of its broader energy transition strategy.
However, despite the promising outlook, the market faces notable challenges. High project costs present a significant barrier to entry for many potential stakeholders. The capital-intensive nature of floating power plant projects requires substantial upfront investments, posing financial challenges that can deter investment and slow market growth.
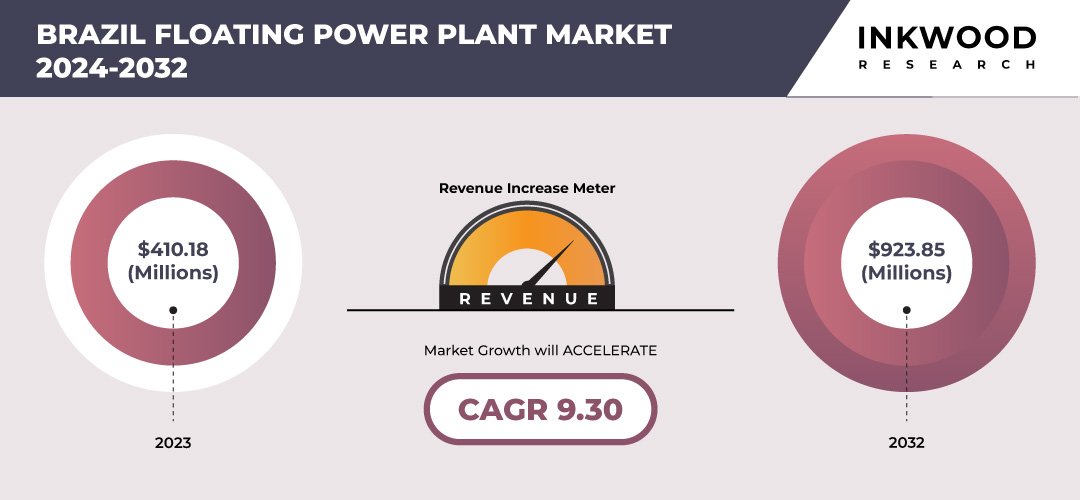
Brazil floating power plant market : 9.30% CAGR (2024-2032)
Need a custom report or have specific data requirements? Let us know!
Moreover, technical complexities associated with floating power plants present another set of challenges. From engineering and construction to operational and maintenance considerations, these projects demand specialized expertise and technology. Overcoming these technical hurdles is crucial for ensuring the reliability and efficiency of floating power plants in Brazil’s diverse environmental conditions.
There is also a notable preference for internal combustion (IC) engine-based floating power plants. These plants offer flexibility in fuel options, operational efficiency, and scalability, making them a preferred choice in Brazil’s evolving energy landscape. The popularity of IC engine-based solutions underscores the market’s responsiveness to adaptable energy solutions that can cater to varying demand profiles and environmental conditions.
Moving ahead, while the Brazil floating power plant market holds immense potential driven by clean energy demands and government support, challenges such as high costs and technical complexities must be effectively managed. As the market matures and technology advancements continue, addressing these challenges will be pivotal. This will enable floating power plants to fully realize their potential in meeting Brazil’s growing energy needs sustainably.
The Brazil floating power plant market segmentation incorporates the market by source and capacity. The source segment is further expanded into renewable power source and non-renewable power source. In terms of renewable power sources, Brazil is leveraging its vast hydropower potential, primarily through floating hydroelectric plants. These plants utilize Brazil’s extensive network of rivers and water bodies to generate clean energy.Â
Additionally, solar power is gaining traction in the Brazil floating power plant sector, particularly in regions with ample sunlight. The country’s strategic location near the equator ensures significant solar irradiance, making solar power a viable option for floating installations. These renewable sources contribute to Brazil’s energy security but also align with global sustainability goals, reducing carbon emissions and environmental impact.
Conversely, the non-renewable power source sub-segment of the market predominantly focuses on natural gas. Floating liquefied natural gas (FLNG) facilities are deployed offshore to tap into Brazil’s substantial offshore natural gas reserves. These facilities are integral in supplementing Brazil’s energy mix by providing reliable and efficient power generation.Â
Moreover, Brazil’s rich oil reserves also influence the non-renewable segment, with floating oil platforms being utilized for power generation in certain regions. Despite the shift towards renewables, natural gas and oil continue to be integral to Brazil’s energy strategy, ensuring stability in energy supply and supporting economic growth initiatives across the country.
Some of the leading players in the Brazil floating power plant market include General Electric, Mitsubishi Corporation, Siemens AG, etc.Â
Mitsubishi Corporation, headquartered in Tokyo, Japan, is a global integrated business enterprise operating across diverse industries, including industrial finance, energy, chemicals, metals, machinery, foods, and environmental businesses. The company spans North and South America, Asia-Pacific, Europe, and the Middle East & Africa. They offer comprehensive solutions across various sectors, including industrial materials, petroleum and chemicals, natural gas, mineral resources, and industrial infrastructure.
REPORT SYNOPSIS
REPORT SCOPE | DETAILS |
---|---|
Market Forecast Years | 2024-2032 |
Base Year | 2023 |
Market Historical Years | 2018-2022 |
Forecast Units | Revenue ($ Million) |
Segments Analyzed | Source and Capacity |
Countries Analyzed | Brazil |
Companies Analyzed | Ciel & Terre International, General Electric, Mitsubishi Corporation, Siemens AG, Wartsila Corporation |
TABLE OF CONTENTS
RESEARCH SCOPE & METHODOLOGY
- STUDY OBJECTIVES
- METHODOLOGY
- ASSUMPTIONS & LIMITATIONS
EXECUTIVE SUMMARY
- MARKET SIZE & ESTIMATES
- COUNTRY SNAPSHOT
- COUNTRY ANALYSISÂ
- SCOPE OF STUDY
- CRISIS SCENARIO ANALYSIS
- IMPACT OF COVID-19 ON THE BRAZIL FLOATING POWER PLANT MARKET
- MAJOR MARKET FINDINGS
- GROWING NUMBER OF RENEWABLE ENERGY PROJECTSÂ
- RISE IN TREND FOR OFFSHORE WIND PROJECT
- NON-RENEWABLE ENERGY SOURCES ARE THE PREDOMINANT TYPE USED IN FLOATING POWER PLANTS
- CAPACITY RANGE OF 20.1 MW TO 100 MW IS EXPERIENCING THE FASTEST GROWTH
MARKET DYNAMICS
- KEY DRIVERS
- SURGING DEMAND FOR CLEAN ENERGY
- GOVERNMENT INVESTMENTS IN THE ENERGY INDUSTRY
- KEY RESTRAINTS
- HIGH PROJECT COSTS
- TECHNICAL CHALLENGES INVOLVED IN FLOATING POWER PLANTS
- KEY DRIVERS
KEY ANALYTICS
- KEY MARKET TRENDS
- POPULARITY OF INTERNAL COMBUSTION (IC) ENGINE-BASED FLOATING POWER PLANTS
- RISE IN THE INSTALLATION OF NEW POWER PLANTS
- TECHNOLOGICAL ADVANCEMENTS AND INNOVATIONS
- PORTER’S FIVE FORCES ANALYSIS
- BUYERS POWER
- SUPPLIERS POWER
- SUBSTITUTION
- NEW ENTRANTS
- INDUSTRY RIVALRY
- GROWTH PROSPECT MAPPING
- GROWTH PROSPECT MAPPING FOR BRAZIL
- MARKET MATURITY ANALYSIS
- MARKET CONCENTRATION ANALYSIS
- VALUE CHAIN ANALYSIS
- RAW MATERIALS & COMPONENT SUPPLIERS
- ORIGINAL EQUIPMENT MANUFACTURERS (OEMS)
- ENGINEERING, PROCUREMENT, AND CONSTRUCTION (EPC) COMPANIES & DEVELOPERSÂ
- KEY BUYING CRITERIA
- TECHNOLOGICAL RELIABILITY AND EFFICIENCYÂ
- COST-EFFECTIVENESS
- EASE OF INSTALLATION AND DEPLOYMENT
- REPUTATION AND TRACK RECORD OF THE SUPPLIER OR MANUFACTURER
- KEY MARKET TRENDS
MARKET BY SOURCE
- RENEWABLE POWER SOURCE
- MARKET FORECAST FIGURE
- SEGMENT ANALYSIS
- NON-RENEWABLE POWER SOURCE
- MARKET FORECAST FIGURE
- SEGMENT ANALYSIS
- RENEWABLE POWER SOURCE
MARKET BY CAPACITY
- 0 MW – 5 MW
- MARKET FORECAST FIGURE
- SEGMENT ANALYSIS
- 5.1 MW – 20 MW
- MARKET FORECAST FIGURE
- SEGMENT ANALYSIS
- 20.1 MW – 100 MW
- MARKET FORECAST FIGURE
- SEGMENT ANALYSIS
- 100.1 MW – 250 MW
- MARKET FORECAST FIGURE
- SEGMENT ANALYSIS
- ABOVE 250 MW
- MARKET FORECAST FIGURE
- SEGMENT ANALYSIS
- 0 MW – 5 MW
COMPETITIVE LANDSCAPE
- KEY STRATEGIC DEVELOPMENTS
- MERGERS & ACQUISITIONS
- PRODUCT LAUNCHES & DEVELOPMENTS
- PARTNERSHIPS & AGREEMENTS
- BUSINESS EXPANSIONS & DIVESTITURES
- COMPANY PROFILES
- CIEL & TERRE INTERNATIONAL
- COMPANY OVERVIEW
- PRODUCTS LIST
- STRENGTHS & CHALLENGES
- GENERAL ELECTRIC
- COMPANY OVERVIEW
- PRODUCTS LIST
- STRENGTHS & CHALLENGES
- MITSUBISHI CORPORATION
- COMPANY OVERVIEW
- PRODUCTS LIST
- STRENGTHS & CHALLENGES
- SIEMENS AG
- COMPANY OVERVIEW
- PRODUCTS LIST
- STRENGTHS & CHALLENGES
- WARTSILA CORPORATION
- COMPANY OVERVIEW
- PRODUCTS LIST
- STRENGTHS & CHALLENGES
- CIEL & TERRE INTERNATIONAL
- KEY STRATEGIC DEVELOPMENTS
LIST OF TABLES
TABLE 1: MARKET SNAPSHOT – FLOATING POWER PLANT
TABLE 2: BRAZIL FLOATING POWER PLANT MARKET, BY SOURCE, HISTORICAL YEARS, 2018-2022 (IN $ MILLION)
TABLE 3: BRAZIL FLOATING POWER PLANT MARKET, BY SOURCE, FORECAST YEARS, 2024-2032 (IN $ MILLION)
TABLE 4: BRAZIL FLOATING POWER PLANT MARKET, BY CAPACITY, HISTORICAL YEARS, 2018-2022 (IN $ MILLION)
TABLE 5: BRAZIL FLOATING POWER PLANT MARKET, BY CAPACITY, FORECAST YEARS, 2024-2032 (IN $ MILLION)
TABLE 6: LIST OF MERGERS & ACQUISITIONS
TABLE 7: LIST OF PRODUCT LAUNCHES & DEVELOPMENTS
TABLE 8: LIST OF PARTNERSHIPS & AGREEMENTS
TABLE 9: LIST OF BUSINESS EXPANSIONS & DIVESTITURES
LIST OF FIGURES
FIGURE 1: KEY MARKET TRENDS
FIGURE 2: PORTER’S FIVE FORCES ANALYSIS
FIGURE 3: GROWTH PROSPECT MAPPING FOR BRAZIL
FIGURE 4: MARKET MATURITY ANALYSIS
FIGURE 5: MARKET CONCENTRATION ANALYSIS
FIGURE 6: VALUE CHAIN ANALYSIS
FIGURE 7: KEY BUYING CRITERIA
FIGURE 8: BRAZIL FLOATING POWER PLANT MARKET, GROWTH POTENTIAL, BY SOURCE, IN 2023
FIGURE 9: BRAZIL FLOATING POWER PLANT MARKET, BY RENEWABLE POWER SOURCE, 2024-2032 (IN $ MILLION)
FIGURE 10: BRAZIL FLOATING POWER PLANT MARKET, BY NON-RENEWABLE POWER SOURCE, 2024-2032 (IN $ MILLION)
FIGURE 11: BRAZIL FLOATING POWER PLANT MARKET, GROWTH POTENTIAL, BY CAPACITY, IN 2023
FIGURE 12: BRAZIL FLOATING POWER PLANT MARKET, BY 0 MW – 5 MW, 2024-2032 (IN $ MILLION)
FIGURE 13: BRAZIL FLOATING POWER PLANT MARKET, BY 5.1 MW – 20 MW, 2024-2032 (IN $ MILLION)
FIGURE 14: BRAZIL FLOATING POWER PLANT MARKET, BY 20.1 MW – 100 MW, 2024-2032 (IN $ MILLION)
FIGURE 15: BRAZIL FLOATING POWER PLANT MARKET, BY 100.1 MW – 250 MW, 2024-2032 (IN $ MILLION)
FIGURE 16: BRAZIL FLOATING POWER PLANT MARKET, BY ABOVE 250 MW, 2024-2032 (IN $ MILLION)
FAQ’s
RELATED REPORTS
-
UNITED STATES TRADING CARD GAME (TCG) MARKET FORECAST 2025-2032
-
GERMANY TRADING CARD GAME (TCG) MARKET FORECAST 2025-2032
-
CHINA TRADING CARD GAME (TCG) MARKET FORECAST 2025-2032
-
INDIA WIND ENERGY MARKET FORECAST 2025-2032
-
INDIA SOLAR ENERGY MARKET FORECAST 2025-2032
-
INDIA GREEN HYDROGEN MARKET FORECAST 2025-2032
-
INDIA GREEN BUILDING MATERIAL MARKET FORECAST 2025-2032
-
UNITED STATES DATA CENTER ENERGY STORAGE MARKET FORECAST 2025-2032
-
INDIA DATA CENTER ENERGY STORAGE MARKET FORECAST 2025-2032
-
GERMANY DATA CENTER ENERGY STORAGE MARKET FORECAST 2025-2032