GLOBAL BIODEGRADABLE PLASTICS MARKET FORECAST 2026
Global Biodegradable Plastics Market by Type (Pla, Starch Blends, Pcl, Regenerated Cellulose, Pbs, Pha, Other Types) Market by Application (Packaging, Fibres, Agriculture, Injection Molding, Other Applications) by Geography
The global biodegradable plastics market size is valued at $29 billion as of 2026 and is expected to reach $111 billion by 2034, progressing with a CAGR of 17.44% during the forecast years, 2026-2034.
Biodegradable plastics break down completely in the environment. Microorganisms do this work. They metabolize the polymer structure and convert it into natural by-products. Producers can make these polymers from renewable feedstocks such as corn and sugarcane. They can also make them from petroleum-based inputs, as with PBAT. As a result, the category is defined by end-of-life behavior rather than by feedstock alone.
Market Scale: What the Capacity Data Tells Decision Makers
The industry data points to strong expansion. According to European Bioplastics (EUBP), global biobased plastics production capacity is set to roughly double, rising from 2.31 million tonnes in 2025 to about 4.69 million tonnes by 2030. However, the base remains small. Biobased plastics still account for only around 0.5% of the 431 million tonnes of plastics produced globally each year. This gap represents the core opportunity in the biodegradable plastics market.
Utilization rates add useful context. In 2025, the industry ran at an average utilisation rate of 72%, producing 1.67 million tonnes against 2.31 million tonnes of capacity, with rates varying between 28% and 100% by polymer. In other words, demand has not yet caught up with installed capacity in several polymer classes.
In the United States, the wider bioeconomy is already sizable. According to the USDA BioPreferred Program, biobased products contributed $489 billion to the U.S. economy in 2021, up from $464 billion in 2020. Meanwhile, the waste problem remains large. The U.S. EPA reports that plastics generation reached 35.7 million tons in 2018, or 12.2 percent of municipal solid waste. Moreover, only about three million tons were recycled that year, an 8.7 percent recycling rate. This low recycling rate strengthens the case for organic recycling routes.

To learn more about this report, request a free sample copy
Material Types: PLA, PHA, PBAT/PBS, and Starch Blends
Polylactic Acid (PLA) is the most widely used biodegradable biopolymer. Producers ferment sugars into lactic acid and then polymerize it. Polyhydroxyalkanoates (PHA), in contrast, come from microbial fermentation. They offer broad compostability, and some grades even biodegrade in marine settings. Similarly, starch blends and synthetic biodegradable polyesters such as PBAT and PBS dominate flexible film uses.
Blending matters too. For example, BASF’s ecovio compounds biodegradable and bio-based polyesters such as PBAT and PLA for rigid, food-contact packaging.
Bio-PET and Bio-PE need a clear distinction here. These are drop-in polymers made from renewable feedstocks such as sugarcane ethanol. Nevertheless, they are not biodegradable. They lower fossil dependence but still require mechanical recycling. Consequently, buyers should not treat bio-based and biodegradable as the same claim. The EUBP data shows why this matters. In Europe, Bio-PE’s share of bioplastics production is expected to climb from 5.2 percent in 2025 to 17.5 percent in 2030, while PHA’s share nearly triples from 2.9 percent to 9.5 percent.
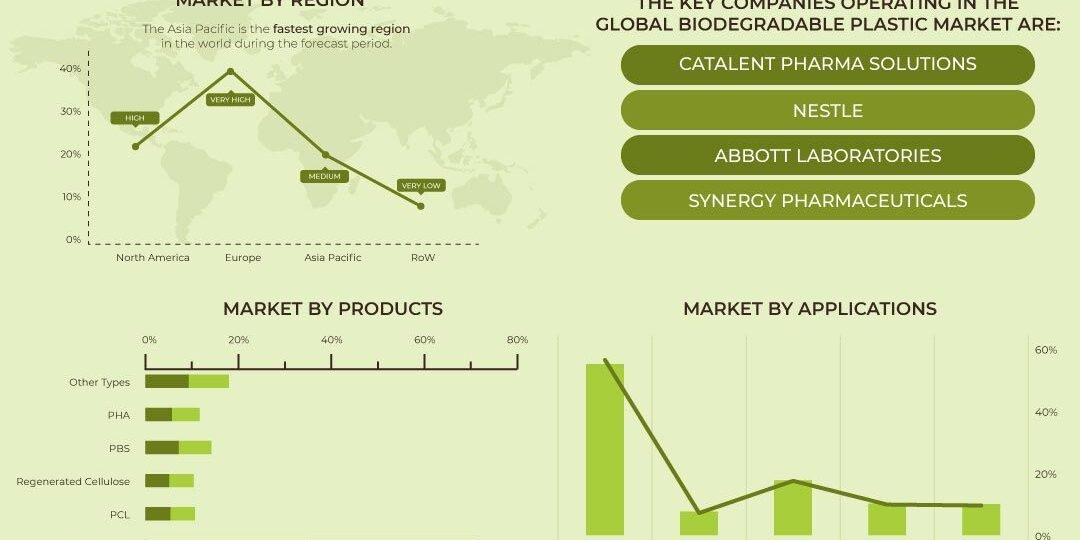
Global Biodegradable Plastic market has been segmented on the basis of polymer type and applications. Their further sub-segmentation is as follows:
Market Drivers: Regulation, ESG, and Decarbonization
Single-Use Plastics (SUP) directives remain the strongest demand trigger. In Europe, the new Packaging and Packaging Waste Regulation (PPWR) raises the stakes. The PPWR became enforceable on 12 August 2026, and its compostable packaging requirements begin in February 2028 for selected items. Specifically, tea and coffee bags and sticky fruit-and-vegetable labels must be industrially compostable by 12 February 2028. Furthermore, compostable plastic packaging received an exemption from the regulation’s recycled-content targets. These rules create a defined, legally backed demand pool.
Beyond regulation, ESG frameworks and carbon neutrality goals push brand owners to act. Decarbonization and carbon footprint reduction targets favor renewable feedstocks over fossil inputs. Likewise, the circular bioeconomy model rewards materials with clear end-of-life routes. Other supporting factors include:
- Wider availability of bio-based raw materials for production.
- Rising demand for eco-friendly packaging solutions.
- Broader applications across farming, textiles, and consumer goods.
However, policy stability remains decisive. EUBP stresses that the next growth phase depends on clear and stable policies that support innovation and investment.
Applications and Processing Technologies
Rigid and flexible packaging lead demand. Packaging remained the largest segment in 2025, at 41.3% (0.95 million tonnes) of global bioplastics production capacity. This includes trays, bottles, films, and pouches.
Agricultural mulch films form a second growth pillar. These films break down in soil after harvest. Therefore, farmers avoid costly collection and reduce soil pollution.
On the processing side, extrusion and injection molding dominate. Importantly, many biodegradable polymers run on existing equipment. For instance, ecovio parts can be made on standard plastics manufacturing machines. This compatibility lowers the switching cost for converters.
By Type of Bioplastics:
- PLA
- Starch Blends
- PCL
- Regenerated Cellulose
- PBS
- PHA
- Others
By Applications:
- Packaging
- Fibers
- Agriculture
- Injection Molding
- Other applications
Industry Challenges: Composting, Feedstock, and Cost Parity
Industrial composting infrastructure is the main bottleneck. Many certified materials need controlled heat, moisture, and oxygen to break down. Without collection and composting access, their environmental benefit weakens.
Feedstock sourcing adds a second layer of risk. Producers rely on renewable biomass such as corn starch, sugarcane, and cellulose. Yields, weather, and food-versus-material debates all affect supply.
Cost parity remains the third hurdle. Biodegradable resins still cost more than petro-based plastics. Moreover, recent events have widened this gap. For example, TotalEnergies Corbion raised Luminy PLA prices effective 24 July 2026, citing rising costs for key raw materials, energy, packaging, and logistics. This followed an earlier increase in April 2026. Consequently, scale and process efficiency will shape who wins in the biodegradable plastics market.
Country-Level Analysis and Leading Company Profiles
United States
PLA, industrial composting infrastructure, and cost parity shape the US biodegradable plastics market. Federal procurement support through BioPreferred helps demand. However, uneven composting access limits end-of-life performance across states.
Company Profile – NatureWorks: NatureWorks is the leading US PLA producer, known for its Ingeo biopolymer. The company operates a 150,000 tonne/year plant in Blair, Nebraska, and is jointly owned by Cargill and PTT Global Chemical. In April 2026, it expanded globally. NatureWorks opened a fully integrated Ingeo facility in Nakhon Sawan, Thailand, combining sugarcane-based lactic acid, lactide monomer, and polymer production in one complex. Additionally, the Thai site has an annual capacity of about 75,000 tonnes. As a result, NatureWorks strengthens its supply position in Asia-Pacific.
Germany
PBAT, rigid and flexible packaging, and the PPWR define Germany’s role. The country hosts a strong chemicals base and a mature organic waste system. Therefore, it acts as a testing ground for certified compostable formats.
Company Profile – BASF: BASF leads with ecoflex (PBAT) and ecovio. In April 2026, BASF expanded its certified compostable ecovio portfolio with new grades aimed at the recycling needs of flexible barrier packaging. Notably, these home-compostable grades suit extrusion coating or film lamination on paper and plastic substrates. The company showcased the portfolio at Interpack 2026 in Düsseldorf. BASFBASF
Italy
Agricultural mulch films, starch blends, and the circular bioeconomy lead Italy’s market. The country has an early record of compostable bag mandates and organic waste collection.
Company Profile – Novamont: Novamont, part of Versalis (Eni), produces the Mater-Bi family of starch-based bioplastics. It has been part of Versalis since October 2023. In November 2025, Novamont secured EU Fertilizer Regulation 2019/1009 conformity certification for its Mater-Bi mulch film, which biodegrades in soil and needs no separate disposal. Furthermore, it presented a new positioning and communication strategy for Mater-Bi at Marca 2026 in January.
Netherlands
PLA, extrusion and injection molding, and decarbonization anchor the Dutch market. The country serves as a European hub for biopolymer R&D and logistics.
Company Profile – TotalEnergies Corbion: The Gorinchem-based joint venture produces Luminy PLA. In July 2026, it commercially launched Luminy FOAM 50F, a high melt strength PLA grade for extrusion foamed packaging such as meat and fish trays, clamshells, and bowls. Notably, the grade targets extruded polystyrene replacement as polystyrene restrictions expand globally. However, the company also raised prices twice in 2026, which reflects ongoing cost pressure.
China
PBAT/PBS, Single-Use Plastics (SUP) directives, and feedstock sourcing dominate China’s biodegradable plastics market. Policy set the pace here. In January 2020, the NDRC and the Ministry of Ecology and Environment jointly issued opinions to strengthen plastic pollution governance, with restriction milestones at the end of 2020, 2022, and 2025. Moreover, the use of non-biodegradable plastic bags was to be banned in major cities by the end of 2020 and in all urban built-up areas and coastal counties by 2022.
Company Profile – Kingfa: Kingfa is a major Chinese materials company with a strong biodegradable portfolio. It has industrialized key bio-based raw materials, including succinic acid and BDO, building an integrated chain from monomers to polymerization and modification. Additionally, at CHINAPLAS 2026, Kingfa introduced a bio-based, home-compostable PBS extrusion coating solution.
India
PLA, Single-Use Plastics (SUP) directives, and feedstock sourcing drive India’s market. The Ministry of Environment, Forest and Climate Change set a firm policy base. Under the Plastic Waste Management Amendment Rules, 2021, it banned the manufacture, import, sale, and use of identified single-use plastic items from 1 July 2022. These include plates, cups, cutlery, straws, and trays.
Company Profile – Balrampur Chini Mills (Balrampur Bioyug): This sugar producer is building India’s first large PLA plant. According to IBEF, the Kumbhi facility in Uttar Pradesh is expected to start operations in October 2026, with an annual capacity of 80,000 tonnes of PLA. Furthermore, in February 2026, Balrampur Bioyug won its first institutional order from the Lucknow Cantonment Board for compostable garbage bags, PLA bottles, 3D-printed pens, and folders. Sugarcane integration gives the company a clear feedstock advantage.
South Korea
PHA, ESG frameworks, and carbon neutrality define South Korea’s position. The country leads in fermentation-based biopolymer innovation.
Company Profile – CJ Biomaterials: CJ Biomaterials is a division of CJ CheilJedang. In May 2026, it announced the commercial availability of PHACT CB0504A, an all-PHA compound for extrusion paper coatings. Moreover, the compound earned TÜV Austria’s OK compost Home, OK compost Industrial, and OK biodegradable MARINE certifications, with BPI certification underway. It targets hot and cold paper cups and food service packaging.
Japan
PHA, marine biodegradability, and injection molding lead Japan’s market. Japanese brand owners increasingly adopt marine-safe materials for single-use items.
Company Profile – Kaneka: Kaneka produces Green Planet PHBH, a PHA copolymer. The material runs on conventional injection molding and extrusion equipment and suits food packaging, organic waste, agricultural, and marine-related uses. Kaneka has also expanded its commercial reach in North America, with exhibitions at PACK Expo International 2026
The total market revenue is calculated by evaluating the revenue generated from the use of biodegradable plastics in various applications such as in agriculture, packaging, catering etc. However, the total market revenue does not include revenue from other non-biodegradable polymers such as polyvinyl chloride (PVC), poly vinyl alcohol (PVOH) etc.
Competitive Landscape: Strategic Takeaways
The biodegradable plastics market remains moderately consolidated. PLA leadership rests with NatureWorks, TotalEnergies Corbion, and new entrants like Balrampur Bioyug. Meanwhile, PHA competition involves CJ Biomaterials, Kaneka, and Danimer Scientific. Notably, Teknor Apex acquired Danimer Scientific, which continues to operate as a separate entity under its own name. In the PBAT and PBS segment, BASF, Novamont, and Kingfa hold strong positions.
Three strategies stand out. First, vertical integration from feedstock to polymer lowers cost exposure. Second, certification breadth, especially home and marine compostability, opens regulated markets. Third, application-specific grades, such as PLA foams and PHA coatings, target formats that regulators are phasing out.
Looking ahead, the biodegradable plastics market will reward players that close the cost gap and align with composting infrastructure. Consequently, investors should track capacity utilization, PPWR enforcement, and Asian capacity additions through 2034.
- RESEARCH SCOPE
- STUDY GOALS
- SCOPE OF THE MARKET STUDY
- WHO WILL FIND THIS REPORT USEFUL?
- STUDY AND FORECASTING YEARS
- RESEARCH METHODOLOGY
- SOURCES OF DATA
- SECONDARY DATA
- PRIMARY DATA
- TOP-DOWN APPROACH
- BOTTOM-UP APPROACH
- DATA TRIANGULATION
- SOURCES OF DATA
- EXECUTIVE SUMMARY
- MARKET SUMMARY
- KEY FINDINGS
- EUROPE LEADS THE OVERALL MARKET BY CAPTURING THE LARGEST MARKET SHARE
- PACKAGING AND AGRICULTURE – KEY APPLICATION SEGMENTS
- LATIN AMERICA – EMERGING MARKETPLACE
- STARCH BLENDS & PLA TO OFFER LUCRATIVE GROWTH OPPORTUNITIES
- INCREASED PRODUCTION OF RAW MATERIALS
- ONGOING TREND PERTAINING TOWARDS SUSTAINABLE PRODUCTS ACROSS GEOGRAPHIES
- MARKET DYNAMICS
- PARENT MARKET ANALYSIS: PLASTICS MARKET
- ETYMOLOGY OF BIODEGRADABLE PLASTIC
- MARKET DEFINITION & SCOPE
- MARKET DRIVERS
- HIGH AVAILABILITY OF BIO-BASED RAW MATERIALS FOR THE PRODUCTION OF BIODEGRADABLE PLASTICS
- EMPHASIS ON EFFICIENT PLASTIC WASTE MANAGEMENT
- FAVOURABLE GOVERNMENT POLICIES TO REDUCE THE USE OF PETROLEUM-BASED POLYMERS
- INCREASED DEMAND FOR ECO-FRIENDLY PACKAGING SOLUTIONS
- WIDENING APPLICATIONS OF BIODEGRADABLE PLASTICS
- MARKET RESTRAINTS
- COST-EFFECTIVENESS OF PETROLEUM-BASED PLASTICS OVER BIODEGRADABLE PLASTICS
- NON-DURABILITY OF BIODEGRADABLE PLASTICS
- MARKET OPPORTUNITIES
- GROWING PRODUCTION OF BIOPLASTICS
- AUTOMOTIVE MANUFACTURERS FOCUSING ON REDUCTION IN CARBON FOOTPRINT
- ABUNDANT AVAILABILITY OF COST-EFFECTIVE BIO-BASED RAW MATERIALS
- MARKET CHALLENGES
- EASY AVAILABILITY OF SUBSTITUTES SUCH AS CONVENTIONAL PLASTICS, & NON-BIODEGRADABLE BIOPLASTICS
- PERFORMANCE ISSUES RELATED TO BIODEGRADABLE PLASTICS
- MARKET BY TYPE
- PLA
- STARCH BLENDS
- PCL
- REGENERATED CELLULOSE
- PBS
- PHA
- OTHER TYPES
- MARKET BY APPLICATION
- PACKAGING
- FIBERS
- AGRICULTURE
- INJECTION MOLDING
- OTHER APPLICATIONS
- KEY ANALYTICS
- PORTER’S FIVE FORCE MODEL
- THREAT OF NEW ENTRANTS
- THREAT OF SUBSTITUTE
- BARGAINING POWER OF SUPPLIERS
- BARGAINING POWER OF BUYERS
- THREAT OF COMPETITIVE RIVALRY
- OPPORTUNITY MATRIX
- VENDOR LANDSCAPE
- KEY BUYING CRITERIA
- COST
- SUBSTITUTES
- AVAILABILITY
- END OF LIFE
- VALUE CHAIN ANALYSIS
- RAW MATERIAL SUPPLIERS
- MANUFACTURERS
- RETAILERS & DISTRIBUTORS
- END USER OR CONSUMER
- LEGAL, POLICY & REGULATORY FRAMEWORK
- INVESTMENT ANALYSIS
- BY REGION
- BY TYPE
- BY APPLICATION
- PORTER’S FIVE FORCE MODEL
- GEOGRAPHICAL ANALYSIS
- NORTH AMERICA
- UNITED STATES
- CANADA
- EUROPE
- UNITED KINGDOM
- FRANCE
- GERMANY
- SPAIN
- REST OF EUROPE
- ASIA PACIFIC
- CHINA
- JAPAN
- INDIA
- AUSTRALIA
- REST OF ASIA PACIFIC
- REST OF WORLD
- LATIN AMERICA
- MIDDLE EAST AND AFRICA
- NORTH AMERICA
- COMPETITIVE LANDSCAPE
- MARKET SHARE ANALYSIS
- KEY COMPANY ANALYSIS
- BASF SE
- NATUREWORKS LLC
- DOW CHEMICAL
- MITSUBISHI CHEMICAL CORPORATION
- ZHEJIANG HISUN BIOMATERIALS
- CORPORATE STRATEGIES
- PARTNERSHIP & COLLABORATION
- PRODUCT LAUNCH
- MERGER & ACQUISITION
- BUSINESS EXPANSION
- COMPANY PROFILES
- BALRAMPUR CHINI MILLS LIMITED (BALRAMPUR BIOYUG)
- BASF SE
- BIOME BIOPLASTICS LIMITED
- BIO-ON S.P.A. (ACQUISITION BY HARUKI SPA)
- CJ BIOMATERIALS (DIVISION OF CJ CHEILJEDANG)
- DANIMER SCIENTIFIC (ACQUISITION BY TEKNOR APEX)
- FKUR KUNSTSTOFF GMBH
- FUTERRO SA
- KANEKA CORPORATION
- KINGFA SCI. & TECH. CO., LTD.
- NATUREWORKS LLC
- NOVAMONT S.P.A. (PART OF VERSALIS, ENI)
- PLANTIC TECHNOLOGIES (ACQUISITION BY KURARAY)
- TIANAN BIOLOGIC MATERIAL CO. LTD
- TOTALENERGIES CORBION (JOINT VENTURE OF TOTALENERGIES AND CORBION N.V.)
- ZHEJIANG HISUN BIOMATERIALS CO. LTD.
TABLE LIST
TABLE 1: GLOBAL BIODEGRADABLE PLASTICS MARKET, BY GEOGRAPHY, 2018-2026 (IN $ MILLION)
TABLE 2: COMPARISON BETWEEN BIOPLASTICS AND CONVENTIONAL PLASTICS
TABLE 3: COST ANALYSIS OF BIODEGRADABLE PLASTICS IN 2016
TABLE 4: COST ANALYSIS OF FOSSIL BASED PLASTICS IN 2016
TABLE 5: AUTOMOTIVE MANUFACTURERS USING BIOPOLYMERS IN THEIR MANUFACTURING
TABLE 6: SUSTAINABILITY OF MAJOR BIO-BASED PLASTIC TYPES FOR DIFFERENT APPLICATIONS
TABLE 7: GLOBAL BIODEGRADABLE PLASTIC MARKET, BY TYPE, 2018-2026, (IN $ MILLION)
TABLE 8: GLOBAL PLA MARKET, BY REGION, 2018-2026 (IN $ MILLION)
TABLE 9: GLOBAL STARCH BLENDS MARKET, BY REGION, 2018-2026 (IN $ MILLION)
TABLE 10: GLOBAL PCL MARKET, BY REGION, 2018-2026 (IN $ MILLION)
TABLE 11: GLOBAL REGENERATED CELLULOSE MARKET, BY REGION, 2018-2026 (IN $ MILLION)
TABLE 12: GLOBAL PBS MARKET, BY REGION, 2018-2026 (IN $ MILLION)
TABLE 13: GLOBAL PHA MARKET, BY REGION, 2018-2026 (IN $ MILLION)
TABLE 14: GLOBAL OTHER TYPES MARKET, BY REGION, 2018-2026 (IN $ MILLION)
TABLE 15: GLOBAL BIODEGRADABLE PLASTIC MARKET, BY APPLICATION, 2018-2026, (IN $ MILLION)
TABLE 16: GLOBAL PACKAGING MARKET, BY REGION, 2018-2026 (IN $ MILLION)
TABLE 17: GLOBAL FIBERS MARKET, BY REGION, 2018-2026 (IN $ MILLION)
TABLE 18: GLOBAL AGRICULTURE MARKET, BY REGION, 2018-2026 (IN $ MILLION)
TABLE 19: GLOBAL INJECTION MOLDING MARKET, BY REGION, 2018-2026 (IN $ MILLION)
TABLE 20: GLOBAL OTHER APPLICATIONS MARKET, BY REGION, 2018-2026 (IN $ MILLION)
TABLE 21: OPPORTUNITY MATRIX FOR BIODEGRADABLE PLASTICS MARKET
TABLE 22: VENDOR LANDSCAPE OF BIODEGRADABLE PLASTICS MARKET
TABLE 23: LEGAL, POLICY & REGULATORY FRAMEWORK
TABLE 24: GLOBAL BIODEGRADABLE PLASTICS MARKET, BY GEOGRAPHY, 2018-2026, (IN $ MILLION)
TABLE 25: NORTH AMERICA BIODEGRADABLE PLASTICS MARKET, BY COUNTRY, 2018-2026 (IN $ MILLION)
TABLE 26: EUROPE BIODEGRADABLE PLASTICS MARKET, BY COUNTRY, 2018-2026 (IN $ MILLION)
TABLE 27: ASIA PACIFIC BIODEGRADABLE PLASTICS MARKET, BY COUNTRY, 2018-2026 (IN $ MILLION)
TABLE 28: REST OF WORLD BIODEGRADABLE PLASTICS MARKET, BY REGION, 2018-2026 (IN $ MILLION)
TABLE 29: LIST OF PARTNERSHIP & COLLABORATION
TABLE 30: LIST OF PRODUCT LAUNCH
TABLE 31: LIST OF MERGER & ACQUISITION
TABLE 32: LIST OF BUSINESS EXPANSION
FIGURE LIST
FIGURE 1: GLOBAL BIODEGRADABLE PLASTIC MARKET, BY BIODEGRADABLE POLYMER TYPE, 2017 & 2026 (IN %)
FIGURE 2: EUROPE BIODEGRADABLE PLASTICS MARKET, 2018-2026 (IN $ MILLION)
FIGURE 3: GLOBAL BIODEGRADABLE PLASTICS MARKET, BY PACKAGING & AGRICULTURE, 2018-2026 (IN $ MILLION)
FIGURE 4: GLOBAL BIODEGRADABLE PLASTICS MARKET, BY STARCH BLENDS & PLA, 2018-2026 (IN $ MILLION)
FIGURE 5: SUGARCANE AND CORN PRODUCTION IN KEY COUNTRIES, 2016 (IN %)
FIGURE 6: GLOBAL PRODUCTION OF SUGAR CANE AND CORN, 2014- 2023 (IN MILLION TONNES)
FIGURE 7: TIMELINE OF BIODEGRADABLE PLASTICS
FIGURE 8: WORLDWIDE CORN PRODUCTION, 2010-2017, (IN MILLION METRIC TONNES)
FIGURE 9: MAJOR CORN PRODUCERS ACROSS THE GLOBE, 2015-2016 (% OF TOTAL PRODUCTION)
FIGURE 10: WORLDWIDE BIOPLASTIC PRODUCTION CAPACITY, 2017-2022 (IN ‘000 TONNES)
FIGURE 11: PERCENTAGE SHARE OF THE TOTAL BIOPLASTIC PRODUCTION ACROSS REGIONS IN 2017 (IN %)
FIGURE 12: MAJOR SUGARCANE PRODUCERS ACROSS THE GLOBE IN 2016 (IN MILLION TONNES)
FIGURE 13: GLOBAL BIODEGRADABLE PLASTICS MARKET, BY PLA, 2018-2026 (IN $ MILLION)
FIGURE 14: GLOBAL BIODEGRADABLE PLASTICS MARKET, BY STARCH BLENDS, 2018-2026 (IN $ MILLION)
FIGURE 15: GLOBAL BIODEGRADABLE PLASTICS MARKET, BY PCL, 2018-2026 (IN $ MILLION)
FIGURE 16: GLOBAL BIODEGRADABLE PLASTICS MARKET, BY REGENERATED CELLULOSE, 2018-2026 (IN $ MILLION)
FIGURE 17: GLOBAL BIODEGRADABLE PLASTIC MARKET, BY PBS, 2018-2026 (IN $ MILLION)
FIGURE 18: GLOBAL BIODEGRADABLE PLASTIC MARKET, BY PHA, 2018-2026 (IN $ MILLION)
FIGURE 19: GLOBAL BIODEGRADABLE PLASTIC MARKET, BY OTHER TYPES, 2018-2026 (IN $ MILLION)
FIGURE 20: GLOBAL BIODEGRADABLE PLASTIC MARKET, BY PACKAGING, 2018-2026 (IN $ MILLION)
FIGURE 21: GLOBAL BIODEGRADABLE PLASTIC MARKET, BY FIBERS, 2018-2026 (IN $ MILLION)
FIGURE 22: GLOBAL BIODEGRADABLE PLASTIC MARKET, BY AGRICULTURE, 2018-2026 (IN $ MILLION)
FIGURE 23: GLOBAL BIODEGRADABLE PLASTIC MARKET, BY INJECTION MOLDING, 2018-2026 (IN $ MILLION)
FIGURE 24: GLOBAL BIODEGRADABLE PLASTIC MARKET, BY OTHER APPLICATIONS, 2018-2026 (IN $ MILLION)
FIGURE 25: PORTER’S FIVE FORCE MODEL OF BIODEGRADABLE PLASTIC MARKET
FIGURE 26: KEY BUYING IMPACT ANALYSIS
FIGURE 27: VALUE CHAIN OF BIODEGRADABLE PLASTIC MARKET
FIGURE 28: INVESTMENT ANALYSIS OF BIODEGRADABLE PLASTIC MARKET IN 2017, BY REGION
FIGURE 29: INVESTMENT ANALYSIS OF BIODEGRADABLE PLASTIC MARKET IN 2017, BY TYPE
FIGURE 30: INVESTMENT ANALYSIS OF BIODEGRADABLE PLASTIC MARKET IN 2017, BY APPLICATION
FIGURE 31: GLOBAL BIODEGRADABLE PLASTIC MARKET, REGIONAL OUTLOOK, 2017 & 2026 (IN %)
FIGURE 32: UNITED STATES BIODEGRADABLE PLASTIC MARKET, 2018-2026 (IN $ MILLION)
FIGURE 33: CANADA BIODEGRADABLE PLASTIC MARKET, 2018-2026 (IN $ MILLION)
FIGURE 34: UNITED KINGDOM BIODEGRADABLE PLASTIC MARKET, 2018-2026 (IN $ MILLION)
FIGURE 35: FRANCE BIODEGRADABLE PLASTIC MARKET, 2018-2026 (IN $ MILLION)
FIGURE 36: GERMANY BIODEGRADABLE PLASTIC MARKET, 2018-2026 (IN $ MILLION)
FIGURE 37: SPAIN BIODEGRADABLE PLASTIC MARKET, 2018-2026 (IN $ MILLION)
FIGURE 38: REST OF EUROPE BIODEGRADABLE PLASTIC MARKET, 2018-2026 (IN $ MILLION)
FIGURE 39: CHINA BIODEGRADABLE PLASTIC MARKET, 2018-2026 (IN $ MILLION)
FIGURE 40: JAPAN BIODEGRADABLE PLASTIC MARKET, 2018-2026 (IN $ MILLION)
FIGURE 41: INDIA BIODEGRADABLE PLASTIC MARKET, 2018-2026 (IN $ MILLION)
FIGURE 42: AUSTRALIA BIODEGRADABLE PLASTIC MARKET, 2018-2026 (IN $ MILLION)
FIGURE 43: REST OF ASIA PACIFIC BIODEGRADABLE PLASTIC MARKET, 2018-2026 (IN $ MILLION)
FIGURE 44: LATIN AMERICA BIODEGRADABLE PLASTIC MARKET, 2018-2026 (IN $ MILLION)
FIGURE 45: MIDDLE EAST AND AFRICA BIODEGRADABLE PLASTIC MARKET, BY COUNTRY, 2018-2026 (IN $ MILLION)
FIGURE 46: MARKET SHARE ANALYSIS OF KEY PLAYERS IN 2017 (IN %)
- MARKET BY TYPE
- PLA
- STARCH BLENDS
- PCL
- REGENERATED CELLULOSE
- PBS
- PHA
- OTHER TYPES
- MARKET BY APPLICATION
- PACKAGING
- FIBRES
- AGRICULTURE
- INJECTION MOLDING
- OTHER APPLICATIONS
- GEOGRAPHICAL ANALYSIS
- NORTH AMERICA
- UNITED STATES
- CANADA
- EUROPE
- UNITED KINGDOM
- FRANCE
- GERMANY
- SPAIN
- REST OF EUROPE
- ASIA PACIFIC
- CHINA
- JAPAN
- INDIA
- AUSTRALIA
- REST OF ASIA PACIFIC
- REST OF WORLD
- LATIN AMERICA
- MIDDLE EAST AND AFRICA
- NORTH AMERICA