

AUSTRALIA LIQUEFIED NATURAL GAS (LNG) MARKET
Natural gas is a fossil fuel majorly comprising methane. Like other fossil fuels, it is formed deep beneath the earth’s surface due to the decomposition of dead plants and animals under extreme heat and pressures. Although natural gas is cleaner than most other fossilized fuels, its calorific value is lower than other fossil fuels such as petrol, diesel, and LPG. Liquified natural gas is compressed natural gas at -290 degrees, useful while transporting and in heat generation.
To learn more about this report, request a free sample copy
Australia has been the largest exporter of liquified natural gas (LNG) globally since it surpassed Qatar in 2020. Aligning with the changing dynamics of the country, Australia has witnessed a significant rollout of wind and solar energy plants. Strong transportation and connecting routes between plants are the country’s major growth drivers.
However, the Australian government does not have a comprehensive plan for minimizing the rise in greenhouse gases, leading to increased extraction of natural gas. As a result, the need for storage as well as transportation has increased, thus augmenting the demand for LNG within and outside the country.
Australia has ten LNG production facilities in the country, with two situated in the Northern territory, three in Queensland, and five in Western Australia. The country has a recent history of LNG export, with major changes occurring in the industry from 2014. Furthermore, the boom in investment from both the private and public sectors as well as foreign investors has increased the extraction of natural gas in Australia. In 2014, Australia produced and exported 24 million tons of LNG, outgrowing to 86 million tons in the year 2019.
The top LNG companies in the country are BHP Billiton, Origin Energy Ltd, Caltex Australia Ltd, etc.
To request a free sample copy of this report, please complete the form below:
We offer 10% free customization including country-level data, niche applications and competitive landscape with every report.
- AUSTRALIA LNG MARKET: EXECUTIVE SUMMARY
- AUSTRALIA OVERALL ECONOMIC CONDITIONS
- AUSTRALIA PRIMARY ENERGY CONSUMPTION
- NATURAL GAS
- AUSTRALIA NATURAL GAS TOTAL PROVED RESERVES, PRODUCTION, AND CONSUMPTION
- TOTAL PROVED RESERVES
- NATURAL GAS PRODUCTION
- NATURAL GAS CONSUMPTION
- AUSTRALIA NATURAL GAS TOTAL PROVED RESERVES, PRODUCTION, AND CONSUMPTION
- LIQUIFIED NATURAL GAS
- VALUE CHAIN ANALYSIS
- EXPLORATION AND PRODUCTION
- LIQUEFACTION
- SHIPPING
- STORAGE AND REGASIFICATION
- END-USERS
- TRADE
- EXPORTS
- LNG TERMINALS
- LIST OF LNG EXPORT TERMINALS
- REGULATORY FRAMEWORK FOR LNG
- VALUE CHAIN ANALYSIS
LIST OF TABLES
TABLE 1: AUSTRALIA NATURAL GAS PRODUCTION, 2016-2020 (IN EXAJOULES)
TABLE 2: AUSTRALIA NATURAL GAS CONSUMPTION, 2016-2020 (IN EXAJOULES)
TABLE 3: AUSTRALIA LNG EXPORTS, 2016-2020 (IN BILLION CUBIC METERS)
TABLE 4: LNG EXPORT TERMINALS, EXISTING
TABLE 5: LNG EXPORT TERMINALS, NOT YET BUILT
TABLE 6: REGULATORY FRAMEWORK
LIST OF FIGURES
FIGURE 1: AUSTRALIA GROSS DOMESTIC PRODUCT, 2016-2020 ($ BILLION)
FIGURE 2: PRIMARY ENERGY CONSUMPTION, BY FUEL TYPES, 2019 & 2020 (IN %)
FIGURE 3: PRIMARY ENERGY CONSUMPTION, 2016-2020, (EXAJOULES)
FIGURE 4: AUSTRALIA NATURAL GAS TOTAL PROVED RESERVES, 2000, 2010, AND 2020 (IN TRILLION CUBIC METERS)
FIGURE 5: AUSTRALIA NATURAL GAS PRODUCTION VS CONSUMPTION, 2016-2020 (IN EXAJOULES)
FIGURE 6: VALUE CHAIN ANALYSIS
AUSTRALIA GROSS DOMESTIC PRODUCT, 2016-2020, ($ BILLION)
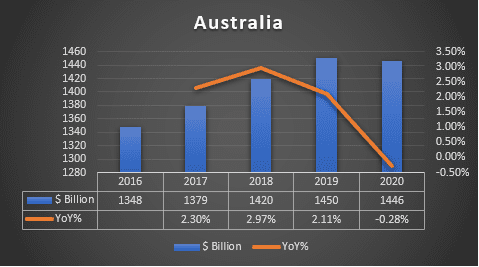
GDP (constant 2010 US$)
Source: World Bank
To request a free sample copy of this report, please complete the form below :
We offer 10% free customization including country-level data, niche applications and competitive landscape with every report.
Choose License Type
RELATED REPORTS
-

POLAND MOBILE IMAGING SERVICES MARKET FORECAST 2025-2032
-

UNITED STATES MOBILE IMAGING SERVICES MARKET FORECAST 2025-2032
-

INDIA MOBILE IMAGING SERVICES MARKET FORECAST 2025-2032
-

VIETNAM BABY DIAPER MARKET FORECAST 2025-2032
-

UNITED STATES BABY DIAPER MARKET FORECAST 2025-2032
-

THAILAND BABY DIAPER MARKET FORECAST 2025-2032
-

TAIWAN BABY DIAPER MARKET FORECAST 2025-2032
-

SOUTH AFRICA BABY DIAPER MARKET FORECAST 2025-2032
-

INDONESIA BABY DIAPER MARKET FORECAST 2025-2032
-

INDIA BABY DIAPER MARKET FORECAST 2025-2032